|
Greetings, and welcome to the December 2020 edition of FGS News and Research. A lot has happened since our last issue at the beginning of the year, and I hope that you and your loved ones are well during these unprecedented times. I am proud to say that our staff have continued to shine and produce quality work for the department.
Some of this quality work includes receiving a grant from the U.S. Geological Survey to take part in the national Earth Mapping Resources Initiative (Earth MRI) by helping to identify critical mineral commodities in Florida. Learn more about it in this issue. Also in this edition, we discuss the reconnaissance of spring and river flow measurements along the Ocklawaha River by FGS geoscientists during the 2019-2020 drawdown of the Rodman Reservoir. Finally, learn about the Cypresshead Formation and the geology of Torreya State Park, and discover numerous geologic “hidden gems” online!
Before you dive in, I would like to congratulate just a few of our FGS rock stars! FGS P.G. Administrator and Assistant State Geologist Harley Means received a well-deserved, prestigious Supreme Service Award from Deputy Secretary John Truitt of Regulatory Programs. More accolades were received at our Virtual FGS Awards Ceremony, when the following awards were presented:
- Clint Kromhout, P.G. Administrator - Sustained Exemplary Performance Award
- Dr. Christopher P. Williams, P.G. II – 2019 FGS Employee of the Year
- Annette Roberts, Government Operations Consultant I – Individual Extra Effort
- Alex Lamarche, Environmental Specialist III – Individual Extra Effort
- P.G. Administrator Alan Baker and P.G. II Michelle Ladle – Team Extra Effort Award for GEODES Implementation
The theme for Earth Science Week (ESW) this year was “Earth Materials in our Lives.” Although we were unable to safely hold our annual ESW Open House, I did have the pleasure of giving a virtual talk to hundreds of attendees on “The Earth Rocks All Around You!” Many thanks are extended to the DEP Press Office, which publicized the event, and to DEP’s Office of Technology and Information Services for making the video accessible on YouTube. I hope you will take the time to watch!
Have a safe and wonderful holiday season.

Jonathan D. Arthur, Ph.D., P.G.
Director and State Geologist
Florida Geological Survey
Florida Department of Environmental Protection


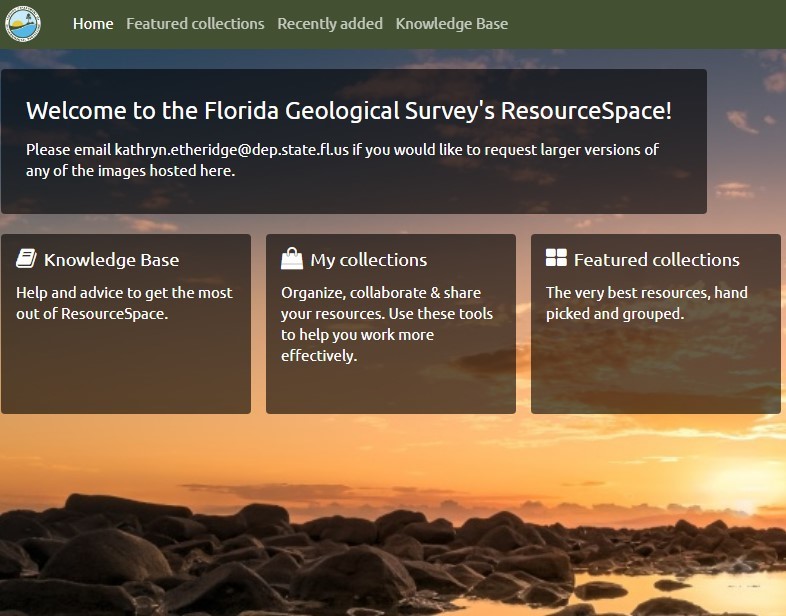
Sometimes sleuthing for online information can become overwhelming. The mission of the FGS is to collect, interpret, maintain and distribute geologic information to benefit Florida. As we achieve our mission, we do our best to make geologic information about Florida easy to find. However, there is a lot of information! This article provides a snapshot of the depth and breadth of our online resources.
Are you a student of the Earth and wish you had a photograph of one of Florida’s beautiful springs, outcrop exposures or even a nice image of microbial reefs created by ancient blue-green algae (stromatolite)? Check out the FGS ResourceSpace to search our collection of more than 7,000 scanned images.
Have you ever wondered what the FGS does exactly? Click here to watch a presentation that will more than answer your question.
If you work in the energy sector, our map of borehole temperatures might interest you. These data were collected from oil and gas test wells through a collaboration between the FGS and the USGS for the National Geothermal Data System.
If you are an educator, check out our geonarrative on Florida’s geological history, and if you want to take a deeper dive, this informative illustrated poster can be downloaded. You can also contact us to order a printed copy.
If you are doing research and want learn more about the 18,964 wells, 9,424 surface samples and 14,352 geophysical logs within the FGS collections, have you checked out our Florida Geologic Well and Borehole Data map? [Hint: hit the “+” sign to zoom in and give it time to load.] Once you click on a point on the map, additional links provide access to sample descriptions and logs.
Florida’s springs are amazing natural treasures. The next time you want to take a break from work, check out Florida’s Aquifer Adventure, a film produced by FGS and partners that provides information about our springs and groundwater. If you desire more technical information, you can view our maps of the potentiometric surface of the Floridan aquifer system. Springs form in areas where aquifer water levels would rise to elevations greater than land surface. Here’s a short video about how spring flow is measured.
While this is only a small sample of FGS data and information, I want to close with a mention of the newsletter you are reading. Don’t forget about back issues of FGS News and Research. Among those pages you will find our “series” articles such as:
Of course, the newsletter also includes many popular articles like the discovery of 27 previously undocumented springs and the importance of geology in land conservation. Explore on, friends of FGS!
Contact: Dr. Jonathan D. Arthur, FGS Director and State Geologist
Geologic formations are the basic rock units used in stratigraphy, the branch of geology that deals with the layers of sedimentary rock (called strata) that have accumulated over geologic time.
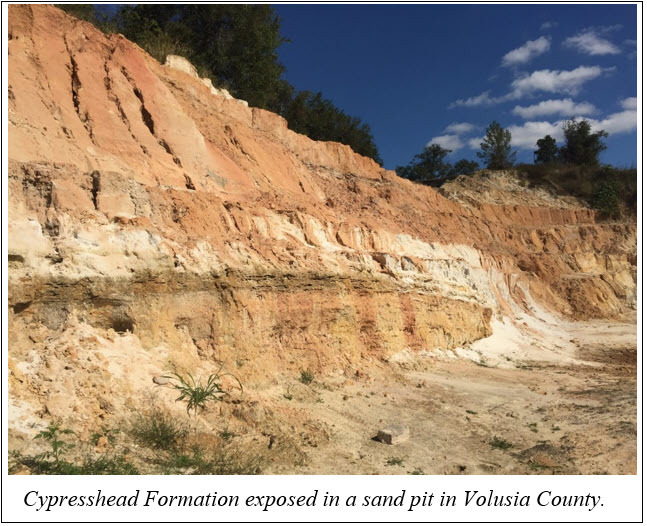
The Cypresshead Formation was described and named by Paul Huddleston (1988). The type locality is in a sand pit just below the confluence of Cypresshead Branch and Goose Creek, near the town of Jesup in Wayne County, Georgia. Four additional reference localities were designated in southeast Georgia. These reference sections each contain some important characteristics of the formation (like bedding, sediment grain-size, overall thickness, etc.). The formation was extended into Florida by Scott (1988).
The Cypresshead Formation is comprised primarily of quartz sand, but it can also contain variable percentages of clay, feldspar and heavy minerals. The quartz sand ranges in size from fine to coarse with occasional discoid quartz pebbles. Clay content ranges from a trace amount to as much as 50 percent. When the clay content is high enough, it can act as a binding agent. The upper portion of the Cypresshead Formation is typically orange to reddish in color with a mottled appearance due to weathering. The formation can be as much as 200 feet thick in parts of Florida.
Fossil burrows of marine shrimp and internal casts of mollusks are occasionally found in the Cypresshead Formation and reflect a marine depositional environment. However, these trace fossils are not age-diagnostic and as a result the age of the Cypresshead Formation was determined based on the its relationship to other adjacent and underlying formations of known age. For example, the Cypresshead Formation in Florida overlies formations of the Oligocene to Pliocene Hawthorn Group, and grades laterally into the early Pleistocene Nashua Formation to the east. Therefore, the Cypresshead Formation can be no older than late Pliocene to early Pleistocene (3.6 – 1.8 million years) based on these relationships. Formations of similar age and composition occur further west in the Panhandle and include the Plio-Pleistocene Miccosukee and Citronelle formations.
|
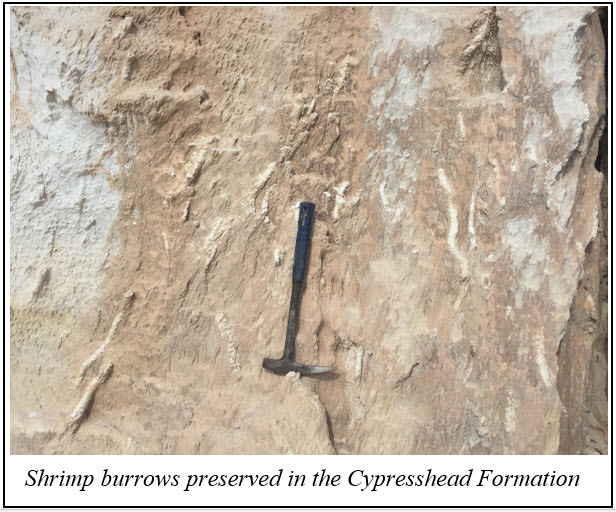
The Cypresshead Formation occurs in northeastern Georgia where it is exposed along beach ridges and hilltops in the coastal counties. In Florida, it occurs from Nassau County in the north down to Highlands County at the southern extent. Many of the long, coast-parallel ridges that run down the center of the Florida peninsula are comprised of the Cypresshead Formation. The ridges formed in nearshore coastal environments that existed during the late Pliocene and early Pleistocene when sea level was higher. Cross bedding, highly weathered mollusk fossils and the burrows of marine organisms are occasionally found in the Cypresshead Formation and provide additional evidence of the nearshore marine depositional environment in which it formed.
References:
Huddleston, P.F., 1988, A revision of the lithostratigraphic units of the Coastal Plain of Georgia: the Miocene through Holocene: Georgia Geological Survey Bulletin 104, 162 p.
Scott, T.M., 1988, The Cypresshead Formation in northern peninsular Florida, in Pirkle, F.L. and Reynolds, J.G., eds., Heavy mineral mining in northeast Florida and an examination of the Hawthorne Formation and post-Hawthorne clastic sediments: Southeastern Geological Society Annual Field Trip Guidebook February 19-20, 1988, p. 70-72.
Contact: Harley Means, P.G. Administrator
|
Critical mineral commodities are vital to the stability and growth of the U.S. economy. These critical mineral resources are used in smartphones, computer chips, communications equipment, medical technology and numerous other products that improve the lives of our citizens. Locating sources within the United States will reduce our dependence on foreign sources and ensure that supplies are adequate and reliably available.
The United States is 100 percent dependent on imports for 21 critical mineral commodities and is at least 50 percent dependent on imports for another 28 critical mineral commodities (Lederer and McCullough, 2018). In response to our nation’s dependency on these imports, Presidential Executive Order 13817 was issued in December 2017 directing selected federal agencies to create a strategy to ensure secure and reliable supplies of critical minerals. The U.S. Geological Survey (USGS), was directed to identify which minerals are deemed critical to the United States and where those minerals can be found. In cooperation with the Association of American State Geologists (AASG) and federal, state and private-sector partners, the USGS developed a plan to improve the geophysical, topographic and geologic mapping of the United States in order to identify new areas where critical mineral commodities might be discovered. This plan is called the Earth Mapping Resources Initiative (Earth MRI).
Locating critical minerals, however, requires an understanding of the geology of areas that may contain them. The Earth MRI provides funding for projects that enhance this through geologic mapping, geophysical surveys and the collection of high-resolution elevation data (e.g., LiDAR). Technical working groups consisting of experts from federal, state and private-sector partners identify target areas where critical mineral resources might exist. Projects are then considered for funding in these target areas.
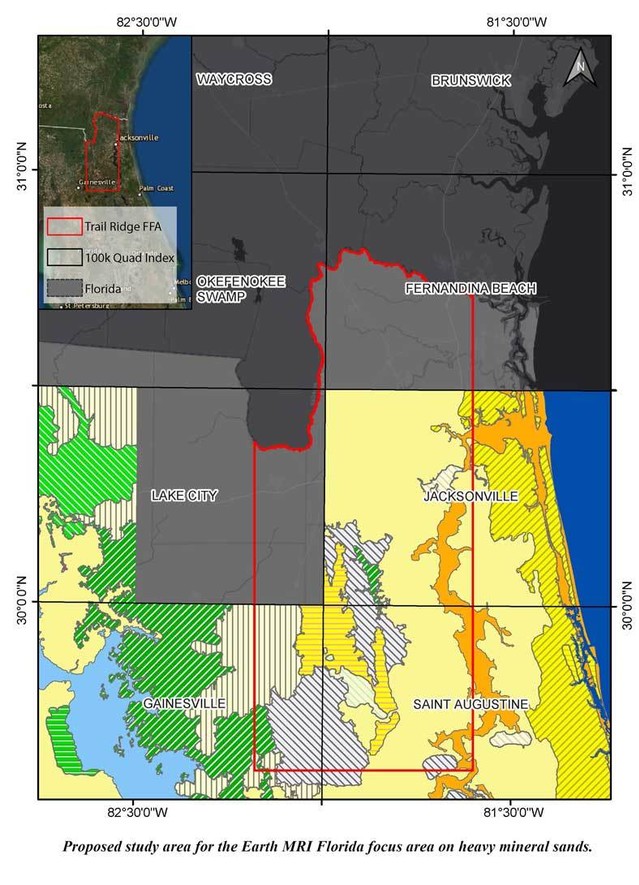
Florida contains known economic deposits of phosphate and heavy-mineral sands that are sources of rare-earth elements (REE) and titanium. These are considered critical mineral commodities. Geologists with the FGS participated in the Earth MRI technical working group and helped delineate areas within the southeastern United States where these mineral commodities might occur. The FGS also recently acquired a grant from USGS for funding through Earth MRI to conduct geologic mapping in northeast Florida, along Trail Ridge, where heavy-mineral sands are known to exist. The project will include geochemical analyses of heavy-mineral sands in the study area to gain a better understanding of the chemical composition and source of these critical mineral resources. Geologic mapping and geochemical data will provide a much better understanding of the geologic framework in this part of northeast Florida. It also may lead to the discovery of new deposits of some of the nation’s critical mineral commodities, fulfilling the goal of Earth MRI.
Reference:
Lederer, G. W., and E. A. McCullough (2018), Meeting the mineral needs of the United States, Eos, 99, https://doi.org/10.1029/2018EO102177
Contact: Mary Beth Lupo, Environmental Consultant
Back to top
Torreya State Park covers an area of more than 14,000 acres in parts of Jackson, Gadsden, Liberty and Calhoun counties in Florida’s panhandle. The park is named for the endangered Torreya tree (Torreya taxifolia) and is well known for the many rare plants and animals that can be found there. However, the park is also one of the best places in the state to see some of Florida’s geologic units exposed. Much of the park is adjacent to the Apalachicola River, which cuts through and exposes the underlying geology. The park is also one of the few places in Florida where the topographic relief is greater than 100 feet.
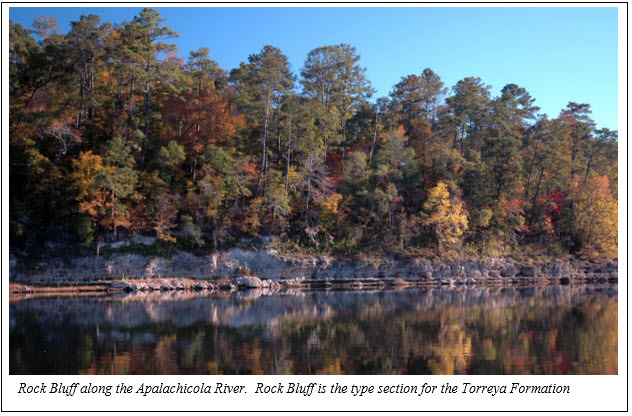
The upland areas within the park are underlain by several geologic formations of different ages. Formations are layers of rock or sediment that are defined by their lithologic components and their stratigraphic relationships. They are the basic units of stratigraphy and are generally what is represented on geologic maps. In the northern parts of Torreya State Park, the Miocene Chattahoochee Formation and Miocene Torreya Formation are exposed in the creeks that flow toward the Apalachicola River. The Pliocene-Pleistocene Citronelle Formation is exposed further south, capping the higher bluffs. There are numerous places to see these formations throughout the park. However, the best geologic exposure is located along the east side of the Apalachicola River at Rock Bluff.
Rock Bluff is a steep, tall, limestone bluff that has been exposed by erosional activity of the Apalachicola River. As this large river moves across the landscape, it erodes the underlying rocks creating the broad valley it occupies, which is called a floodplain. Rock Bluff is located at the eastern edge of the Apalachicola River floodplain and is one of the tallest natural geologic exposures of rock and sediment in Florida. When strata are exposed at land surface, the area is known to geologists as an outcrop. At 100 feet tall, the outcrop at Rock Bluff is among the best in Florida.
The formations exposed at the Rock Bluff outcrop are comprised of limestone, quartz sand and clay. The limestone was deposited during the early to middle Miocene Epoch, between 15 and 19 million years ago, when sea level was high enough to cover much of Florida. Evidence for this can be found in the form of numerous casts and molds of sea-dwelling animals like clams, oysters and snails that are preserved in the limestone. These fossils can be seen in the limestone that is exposed when the river level is low enough. It is important to remember that this is a State Park and therefore fossil collecting is prohibited.
The limestone, quartz sand and clay exposed at Rock Bluff belong to the early Miocene Torreya Formation. When a geologist names a new formation, they also designate a place where other geologists can go and see an example of the formation. These places are called “Type Sections.” Rock Bluff is the Type Section for the Torreya Formation which makes it an important site for geologists.
Contact: Harley Means, P.G. Administrator
Back to top
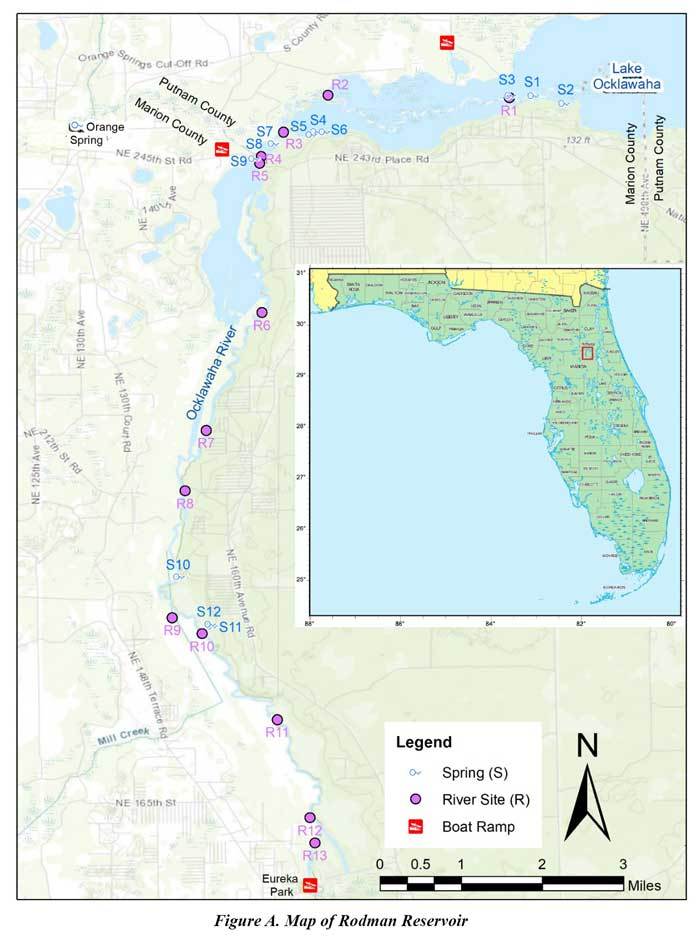
The Rodman Reservoir was created in 1968 when the U.S. Army Corps of Engineers constructed an earthen dam across the Ocklawaha River in southern Putnam and northern Marion County Florida (Figure A).
The reservoir was built for navigational purposes for the proposed Cross Florida Barge Canal and flooded an expanse of 9,500 acres, permanently submerging river floodplains, woodlands and numerous springs. Construction of the Cross Florida Barge Canal was halted in 1971 by President Richard Nixon following a series of environmental legal challenges led by Marjorie Harris Carr and the Florida Defenders of the Environment. Although the Cross Florida Barge Canal was never completed, the dam and the reservoir remain, and dispute over restoring a free-flowing Ocklawaha River has persisted ever since.
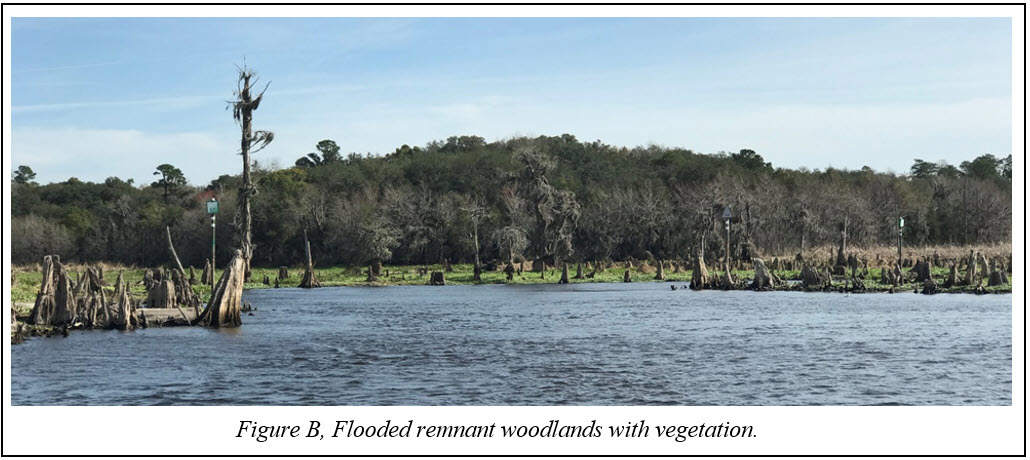
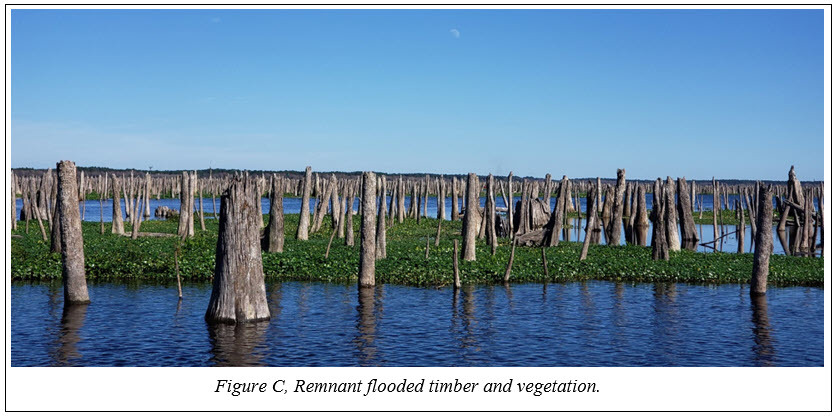
The Florida Department of Environmental Protection (DEP) has been managing the Rodman Reservoir since the mid-1990’s and conducts drawdowns every three to four years for invasive aquatic plant control and wildlife habitat enhancement. DEP’s most recent drawdown of the Rodman Reservoir occurred between September of 2019 and April of 2020. During this period, the reservoir’s water level was raised and lowered in various stages, ultimately lowered by about nine feet in elevation, and then maintained at 11 feet above mean sea level from November 5, 2019 through March 3, 2020. The Florida Fish and Wildlife Conservation Commission describes the reservoir as having three primary sections: the southern flooded woodlands of the Ocklawaha River reach (Figure B), a transitional mid-section of flooded standing timber (Figure C) and the main pool adjacent to the Kirkpatrick Dam. The water depths range from shallow sloping and contoured shorelines to deeper river channels, and the remnants of the barge canal can be up to 30 feet deep.
The Ocklawaha River originates about 50 miles south from Lake Griffin, near Leesburg, FL. As the Ocklawaha River meanders north from Lake Griffin, groundwater is emitted through springs and seeps, adding to the river’s flow along the way. The single largest addition of groundwater to the Ocklawaha River originates from the Silver Springs Group via the Silver River near Ocala, FL. Like much of Florida, the topography surrounding the reservoir and the rivers is influenced by karst. Karst topography results from the uneven dissolution of the carbonate rock (limestone and dolostone) underlying the surface. An undulating topography develops as the subsurface carbonate rocks slowly dissolve, subside and sometimes collapse. Beneath this distinctive surface resides the Floridan aquifer system, whose groundwater supplies most of Florida’s drinking water and is readily enjoyed in the state’s many springs.
Dr. Elizabeth Abbott published The Twenty Springs of the Ocklawaha [white paper] in the summer of 1971. Her anecdotal accounts and descriptions of the Ocklawaha river and the culture of the area captured things as they were in their natural, unaltered state prior to the reservoir. The St. Johns River Water Management District (SJRWMD) commissioned two separate investigations of the Rodman Reservoir during the 2007 and the 2015-2016 reservoir drawdowns. During those investigations, multiple springs were located, their flows were measured and the hydrological effects of the reservoir’s drawdown on the surficial and Floridan aquifer systems were examined.
2019-2020 FGS Drawdown Investigation
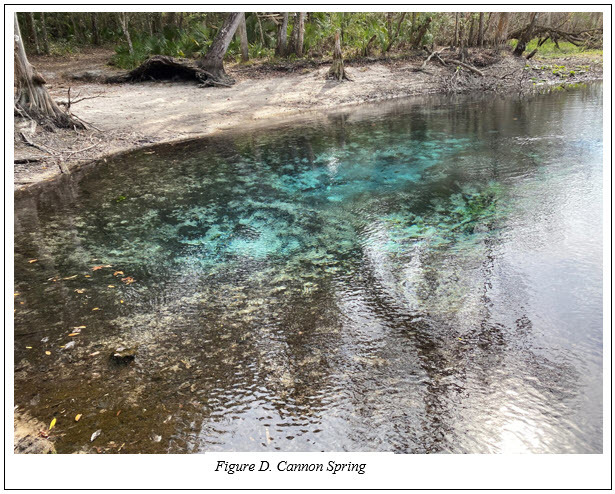
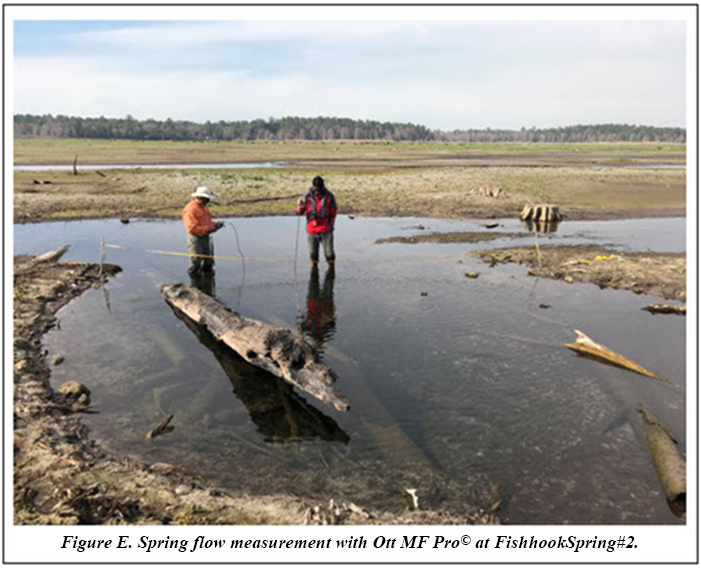
The Florida Geological Survey utilized the 2019-20 Rodman Reservoir drawdown to fulfill several of its mission’s objectives. The mission of the FGS is to collect, archive, interpret and distribute geologic information to benefit the citizens of Florida. The drawdown of the Rodman Reservoir provided a unique opportunity to collect important flow data from typically submerged springs and to document the flow of the Oklawaha River within its historical river channel. The FGS’s fieldwork also involved collecting surficial geologic hand samples from typically submerged geologic exposures along the Oklawaha River channel. The geologic hand samples provide new and additional information aiding the FGS’s mapping initiative to produce a new statewide surficial geologic map by 2026. The FGS recorded flow measurements at most of the springs previously documented by the SJRWMD and identified several previously unnamed low magnitude springs and seeps. FGS spring-flow measurements ranged from a high of approximately 14 cubic feet per second (cfs) at Marion Blue Spring, to about 9 cfs at Cannon Springs (Figure D) and a low of less than one cfs at Fishhook Spring #2 (Figure E). The spring-flow data will be further analyzed and compared to the previously noted SJRWMD drawdown investigations. In addition, 13 Oklawaha River channel flows were collected from the Eureka Dam to the western edge of the main lake pool just east of the Kenwood Boat Ramp. These segmented river-channel flow measurements will be used by the FGS to create the first documented analysis of the historical river-channel flows, which will reveal the segments of the river that “gain” water from known and unknown springs, seeps and contributing surface water inputs, and which sections of the river “lose” flow to the surficial aquifer beneath the reservoir.
 |
 |
A more detailed report of our investigation of the Rodman Reservoir drawdown of 2019-20 and analysis of the data will be forthcoming.
Contact: Scott Barrett Dyer, P.G.
Back to top
|