|
 by Steven Koczak, PhD, Research Specialist
Most people are familiar with ‘marquee’ economic indicators like GDP (overall economic growth), the Consumer Price Index (inflation rate) and the unemployment rate. While these measures are useful for providing a “30,000-foot view” of the economy, that perspective is also very aggregated, and you can miss a lot of detail.
Another important, but less-quoted, dataset — Occupational Employment and Wage Statistics (OEWS) — is featured prominently on our website. It’s also a key source of information on opportunity occupations and occupational mobility in New York State. While not quite a household name, this data series represents an important source of information about workers and their occupations.
The OEWS series provides a granular view of wages and occupational employment. Here, we use this data to provide a detailed analysis of the top 10 occupations in the Empire State by employment.
OEWS Background
OEWS data are gathered from employers. This allows for a unique cross-tabbing of occupations and industries, which yields an industry’s occupational mix, or “staffing pattern.”
As described on the U.S. Bureau of Labor Statistics (BLS) website, the OEWS program produces employment and wage estimates for over 800 occupations, based on the Standard Occupational Classification (SOC) system.
This article uses data from May 2024, which is the latest available. The current series represents three years of accumulated data. Newer data from May 2025 will be published later this year. See the table at the end of this article for a detailed list of the top 10 state occupations in New York State. For more background information about New York’s OEWS program, see the April 2025 issue of our newsletter.
Top 10 Occupations in NYS
In terms of number of jobs, the top 10 occupations in New York State were:
- Home Health & Personal Care Aides: 623,000
- Retail Salespersons: 233,740
- General and Operations Managers: 210,890
- Registered Nurses: 204,120
- Janitors and Cleaners, Except Maids and Housekeeping Cleaners: 186,370
- Fast Food and Counter Workers: 183,810
- Cashiers: 163,700
- Customer Service Representatives: 145,100
- Stockers and Order Fillers: 142,870
- Waiters and Waitresses: 140,890
Altogether, the top 10 occupations in the Empire State accounted for over 2.2 million jobs, representing just under one-quarter (23.4%) of the 9.5 million in the state’s labor market.
Which Industries Employ the Top Occupations?
Despite the importance of healthcare to New York’s labor market, only two healthcare-specific occupations — Registered Nurses (RNs) and Home Health & Personal Care Aides — made the top 10 list. Over half (52.7%) of RNs were employed by General Medical and Surgical Hospitals (NAICS 6221). Similarly, over half (52.0%) of Home Health & Personal Care Aides worked in Home Health Care Services (NAICS 6216).
In terms of the employment of RNs, Employment Services (NAICS 5613) was in a (distant) second place at 9.3%. Nonetheless, this an interesting result as it underscores the growing use of “agency nurses,” who work for an employment agency that contracts with healthcare employers, rather than for a healthcare employer directly. Nurses that work for a healthcare employer directly have come to be called “staff nurses.” In terms of Home Health & Personal Care Aides, the Individual and Family Services industry group (NAICS 6241) was in second place at 32.6%.
Retail and food‑related industries consistently show up as either the #1 or #2 ranked employer of some of the largest occupations. For example, a plurality (33.7%) of Cashiers were employed in Food and Beverage Stores, which is a combination of Grocery and Convenience Retailers (NAICS 4451) and Specialty Food Retailers (NAICS 4452). A distant, but notable, second was Restaurants (NAICS 7225) at 11.0%. Not unexpectedly, a vast majority (81.0%) of Waiters and Waitresses were employed by Restaurants. This staffing pattern result highlights how central consumer‑facing services are to statewide employment.
Insurance-related industries made a strong showing as they were both the #1 and #2 employer of Customer Service Representatives — 8.0% were employed by Insurance Agencies and Brokerages (NAICS 5242) and 6.5% were at Insurance Carriers (NAICS 5241).
General and Operations Managers were employed across a variety of industry groups, with a plurality (5.0%) in Management of Companies and Enterprises (NAICS 5511). Food-related businesses cropped up again here — 3.6% were employed in Food and Beverage Stores.
Top Educational Requirements and Median Pay
The educational requirements of the top 10 occupations tell a story about the broader labor market. In this instance, one-half (five) typically require no formal educational credential for entry, 30% (three) typically required a high school diploma or equivalent and 20% (two) typically required a bachelor’s degree.
Combined employment in the five occupations requiring no formal education was 908,510, or 40.7% of the top 10 and 9.5% of total statewide employment. The job count in the three occupations requiring only high school was 910,970, or 40.8% of the top 10 and 9.5% of total employment. Employment in the two titles requiring a bachelor’s degree totaled 415,010, or 18.6%, of the top 10 and 4.3% of total employment.
The wage range among the top 10 occupations was wide. The statewide median wage in the OEWS dataset was $59,960. Only two occupations in the top 10 paid more than the median — Registered Nurses ($108,470) and General and Operations Managers ($132,400). The lowest-paid occupation on the list was Cashiers, with a median wage of $35,820, while Customer Service Representatives had a median wage of $48,870.
Moving On: Occupational Mobility from the Top Ten
As part of our efforts to study occupational mobility, analysts at NYSDOL developed an occupational “similarity score,” which is based on a composite measure of occupational relatedness developed by researchers at U.S. Department of Labor’s Occupational Information Network (O*NET).
For this analysis, we used NYSDOL’s similarity scores to examine potential mobility from the top ten occupations in the state. Our analysis focused on job titles with the highest similarity scores (all transitions that led to a pay decrease were excluded). Here are some of the potential transitions for the top 10 occupations (presented in the same order as above) and their potential salary increases that we found:
- Home Health & Personal Care Aides to Nursing Assistants: 24.8%
- Retail Salespersons to Sales Representatives, Wholesale and Manufacturing: 106.8%
- General and Operations Managers to Chief Executives: 68.7%
- Registered Nurses to Nurse Practitioners: 37.7%
- Janitors and Cleaners (excl: Maids and Housekeeping Cleaners) to Maids and Housekeeping Cleaners: 7.5%
- Fast Food and Counter Workers to Dining Room and Cafeteria Attendants and Bartender Helpers: 4.3%
- Cashiers to Counter and Rental Clerks: 27.4%
- Customer Service Representatives to Sales Representatives of Services (excl: Advertising, Insurance, Financial Services and Travel): 78.6%
- Stockers and Order Fillers to Shipping, Receiving and Inventory Clerks: 18.4%
- Waiters and Waitresses to Bartenders: 30.7%
Conclusion
The primary theme that emerges from our analysis of the top 10 occupations in New York State is that the list encompasses a broad range of educational requirements, salaries, and industries. There is no such thing as a “typical” top 10 occupation.
While the list is dominated by lower-paying occupations that do not have extensive educational requirements for entry, we also demonstrate that there are viable pathways for workers in even the lowest paid job titles to move up into occupations that pay better and afford greater career mobility opportunities. Our top 10 list also includes two higher-paying occupations with median wages of over $100,000 — Registered Nurses and General and Operations Managers.
OEWS data are useful for jobseekers and employers alike. Moreover, the data help us to analyze labor market shifts, develop training programs, make business decisions and ensure New York’s workforce continues to thrive.
For more information, statewide and regional OEWS estimates are available on our public OEWS dashboard.
Top 10 Occupations. New York State, May 2024
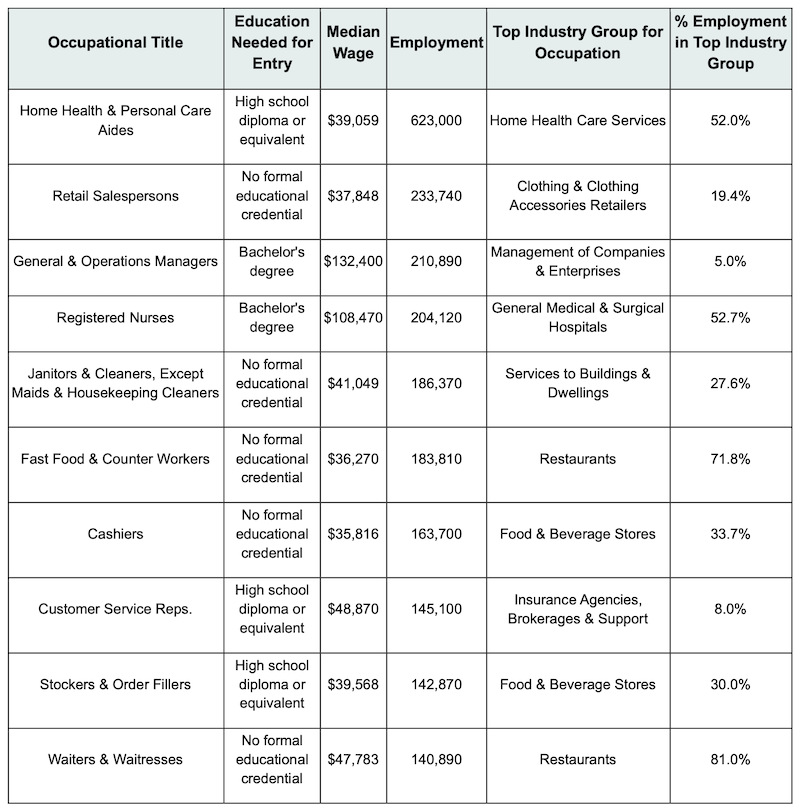 Source: OEWS
|
|
“Proposed light-rail service directly connects Brooklyn and Queens.”
by Elena Volovelsky, Labor Market Analyst, New York City region
For the last three decades, advocates have campaigned for a rapid transit connection between the historically underserved sections of Brooklyn and Queens, the city’s two most populous boroughs, without entering Manhattan. A project to do just that, called the Interborough Express (IBX), has moved into the final planning stages. Completion is expected in less than ten years.
Historically, New York City’s public infrastructure — such as tunnels and bridges — and rapid transit — such as elevated trains and subways — were designed to carry commuters from the outer boroughs to the business districts in Manhattan. Over time, demographic and economic shifts have changed traditional commuting patterns. The transition was further highlighted by the COVID-19 pandemic, as public transit ridership recovered far more quickly at stations outside of Midtown and Lower Manhattan.
However, the city's transit infrastructure has yet to adapt. Of the subway’s 22 lines, only the G train travels directly between Brooklyn and Queens without dipping into Manhattan. Consequently, residents moving between these two boroughs often face long subway journeys through Manhattan or must rely on buses that navigate heavily congested roads. If the Interborough Express (IBX) project moves forward as planned, it would represent a structural shift for the city’s public transit network.
Proposal
After several ideas were considered involving different combinations of rail and bus service, the IBX proposal emerged as a light-rail project. The unique proposition of the IBX is that it would make its 14-mile trip by utilizing an existing freight rail right-of-way known as the Bay Ridge Branch, where passenger service would operate alongside active freight trains. Originally proposed as the "Triboro Express" (or “Triboro Line”) by the Regional Plan Association in 1996, the current vision involves electric light-rail service offering subway-like frequency and hours of operation. The route would run from the Brooklyn Army Terminal in Bay Ridge, Brooklyn, to Jackson Heights, Queens, in under 40 minutes.
The IBX project would introduce 19 new stops, linking 17 subway lines, LIRR stations and dozens of bus routes. Studies conducted by the MTA estimate a daily weekday ridership of about 115,000, which would translate into more than 40 million commuters annually.
According to various feasibility studies, more than 900,000 people live within a half mile of the new transit corridor. Of those, 70% are people of color, about half live in households with no cars, and about one-third in households whose income is below 150% of the poverty line.
Beyond providing an easier commute for residents, the line would serve 260,000 existing jobs and potentially ease road congestion, as half of the current commutes in this area are made by car. It could also provide a vital rail-to-bus link at the Roosevelt Avenue hub in Jackson Heights, cutting travel times to the airport via the Q70 bus, though planners will need to manage the schedules carefully since the connecting subway station is already the fourth busiest in the city.
The MTA estimated the cost of the IBX line at about $5.5 billion, making it significantly more cost effective than tunneling-intensive subway expansions like the Second Avenue line. New York State’s FY 2026 Budget fully funds the first $2.75 billion for design and initial construction, while the MTA refines final costs and lines up federal funding needed to proceed with project.
Housing
While the project’s final completion date is still several years away, it is already attracting the attention of real estate developers. An analysis by the New York Building Congress (NYBC) proposed that between 42,000 and 100,000 new housing units could rise within half a mile of the IBX line if city officials approve specific land-use changes.
The report emphasized that a responsible approach to development would preserve the character of the area, while increasing housing stock and growing local jobs. The NYBC advocates for the threshold of 50 dwelling units per acre — similar to the threshold proposed in Governor Hochul’s 2023 Housing Impact — which could produce more than 70,000 homes over the next decade. NYBC further recommends creating an "IBX Transit-Oriented Development Special District" (IBX-TOD SD) along the route. This plan would encourage modest upzoning in residential districts and more significant conversions of commercial and manufacturing sites into mixed-use developments.
Such a surge in housing would be substantial for the NYC region, which faces an estimated shortfall of 500,000 affordable units. For comparison, the 70,000 potential units along the IBX far exceed the 14,700 apartments expected from the Long Island City rezoning in Queens, while the city builds around 25,000 new homes per year. However, the path to approval remains challenging because the route crosses a complex mix of industrial zones and low-density suburbs with varying zoning restrictions. Furthermore, some residents in lower-income neighborhoods are wary that luxury developments could lead to displacement.
Next Steps
In October 2024, the MTA launched an 18-month environmental review process to inform the final design. Although the project utilizes an already existing train line, significant infrastructure modifications will be necessary to accommodate passenger service. Currently in the preliminary engineering and design phase, the line is expected to be operational by the early 2030s. Once finished, the IBX will provide essential connectivity for New Yorkers of diverse racial, ethnic and socioeconomic backgrounds.
For the current details of the project, including a map of the line, see the official MTA project page.
|
|
 by Kevin Jack, Deputy Director
“Americans have proved adept at concocting new ways of getting work done faster, better and cheaper.”
George Anders, Wall Street Journal, November 2025
Office technology is constantly being changed and adapted. In just the past century, we’ve upgraded from such basic tools as typewriters, adding machines and telephones to increasingly sophisticated digital systems. These new tools have boosted efficiency through breakthrough innovations like personal computers, the internet, email, mobile devices and cloud computing. Moreover, these technologies have profoundly reshaped the workplace, by enabling remote access and creating expectations for instant global connectivity.
The Wall Street Journal recently looked at the origin stories for “10 Office Technologies That Changed Everything,” dating back to the mid-19th century. Interestingly, New York State companies or New Yorkers played a key part in at least five of these breakthroughs. Here, we look at these 10 technologies, with a special focus on those with a clear New York State connection.
Swivel-tilt desk chairs (1849): Office clerk Thomas E. Warren of Troy, New York, started manufacturing what he called the “centripetal spring chair” in 1849. Though the term didn’t exist yet, Warren’s invention is an early example of an ergonomic chair, which means it adapts to body contours to provide comfort. Warren presented multiple spring armchairs at the 1851 World’s Fair in London.
Otis elevator (1853): Elisha Otis was the founder of the Otis Elevator Company. Born in Vermont, he moved to Yonkers in 1852. There, he invented the safety elevator while working at the Maize & Burns bedstead factory. He then went into the elevator business for himself and installed the first safety elevator for passenger use in the E. V. Haughwout Building, a five-story department store at the corner of Broome Street and Broadway in Manhattan, in 1857.
Remington typewriters (1874): Established in 1816, gunmakers E. Remington and Sons, who were headquartered in Ilion, Herkimer County, sold the first commercial typewriters in 1874. Their early machines, which in the beginning could write only capital letters, were based on designs from inventor Christopher Latham Sholes. The Remington brand quickly became a leader in the typewriter industry. One design factor that gave Remington an advantage over other manufacturers was its early use of the now-standard arrangement of the letters on the keyboard, known as the QWERTY layout.
The telephone (1876): Inventors Alexander Graham Bell and Elisha Gray both filed patent applications on Valentine’s Day 1876 for early versions of the telephone. Bell’s paperwork was submitted two hours earlier, and his patent was ultimately granted. Before long, desktop phones in offices became common. Bell’s company, Bell Telephone Company, was soon engaged in a legal battle about patent rights with Western Union, which had purchased Gray’s patent. The Bell Company emerged victorious and had a U.S. monopoly until the 1890s.
Air conditioning (1902): In 1902, 26-year-old Willis Carrier, a Cornell University engineering graduate from Erie County, was on a mission. His goal was to control humidity that made magazine pages curl at the Sackett & Wilhelms Lithography and Printing Co. in Brooklyn. His breakthrough is considered the birth of modern air conditioning. Soon, many offices adopted Carrier’s technology, which boosted productivity and meant that office workers could stay at their desks during heat waves.
The Xerox 914 copier (1959): The Xerox 914 copier was released in 1959, when Xerox was based in Rochester. The 914 was the first commercially successful automatic office copier, and made one copy every 26 seconds. It replaced mimeographs and ditto machines, which had dominated the office landscape for the first half of the 20th century. The advent of inexpensive inkjet printers and digital files (PDFs) took over much of Xerox’s market.
Email (1971): Ray Tomlinson, a computer engineer working at BBN Technologies in Cambridge, Massachusetts, is credited with inventing modern network email in 1971. He used the "@" symbol to connect users with their host computers for person-to-person messaging. Tomlinson’s invention, which was considered the "killer app" of the early internet, has become a staple of most modern offices today.
Wang word processors (1976): Wang Laboratories in Lowell, Massachusetts, introduced the Wang 1200 WPS, an early word processor. Falling microchip prices and faster chip speeds facilitated the age of word processing. However, Wang was unable to keep pace with competitors, like Apple, and his company filed for bankruptcy protection in 1990.
VisiCalc spreadsheets (1979): VisiCalc was the first spreadsheet program for PCs. It was developed by Harvard Business School student Dan Bricklin and originally released by VisiCorp for the Apple II computer in 1979. The program helped to fuel the rapid growth of the nascent PC industry. It also automated complex financial calculations on spreadsheets that previously required manual calculations. Unfortunately for VisiCalc, competing spreadsheet products introduced just a few years later, like Lotus 1-2-3 (January 1983) and Microsoft’s Excel (September 1985), came to dominate the business software market.
Zoom teleconferencing (2020): The COVID-19 pandemic and lockdowns highlighted the need for reliable videoconferencing software to keep workers connected. Zoom, Webex and Microsoft Teams, though they’d all existed before 2020, emerged as leading technology products to fulfill the new need. Many workers seem to have mixed feelings about such software. While it allowed people from many companies to work remotely, it also meant that some felt isolated and missed real human interaction in the office.
|
|
|
Click the button below to become a subscriber to Employment in New York State

|
|
|
|
|