|
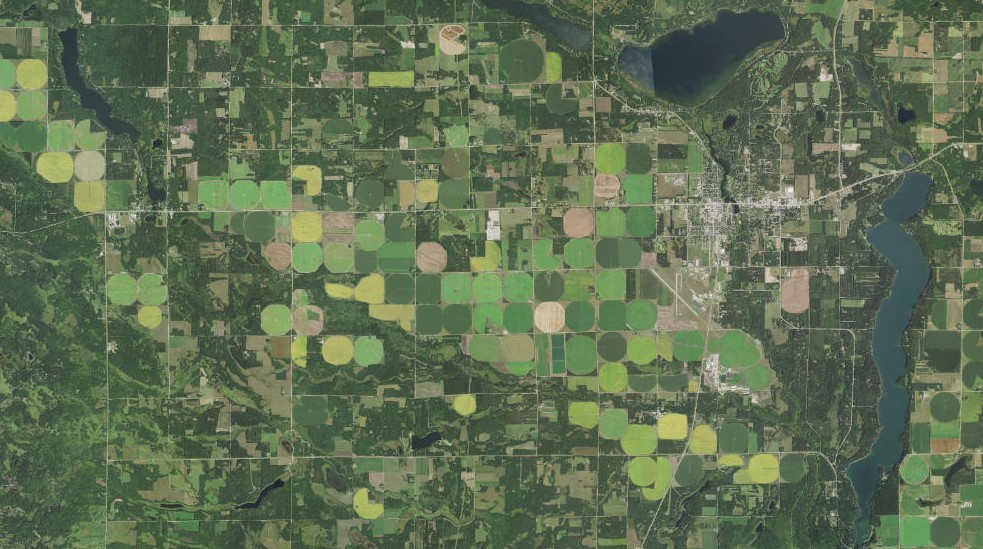
Pivot irrigation near Park Rapids, Minnesota
In our last newsletter we shared the story of land cover change from our new Land Cover application.
In this edition, we take a look at new tools that tell Minnesota's water use story.
Water Withdrawal Update
Water is fundamental to life. While we are fortunate to have an abundant water supply in Minnesota, careful management is necessary to ensure a sustainable use of the resource. Sustainable water use requires finding a balance between the ecological, social, and economic needs without compromising our ability to meet those needs in the future.
The Water Withdrawal Index helps identify areas that may experience stress to the water supply from recent use. The WHAF Team has updated this index with an additional eight years of water use data. With the update, the index map now reflects the five most recent available years (2014 - 2019).
The index is based on a comparison between stream discharge and reported water use within each watershed. Stream discharge is estimated from a predictive model that factors in rainfall, temperature, geology, and the watershed's location and size. The reported water use is calculated from the values reported by DNR Water Appropriations Permit holders. By comparing these values we see where reported water use is high relative to discharge, a scenario that causes stress to the available water supply, and to the health and resilience of the watershed.
Investigate Water Use
WHAF provides three products that can be used together to investigate patterns of water use stress at state-wide and local scales.
-
The Water Withdrawal Index map depicts the percent of discharge used by permit holders over the last 5 years (2014-2019). This map helps identify which watersheds may be experiencing stress, and target those areas for closer investigation.
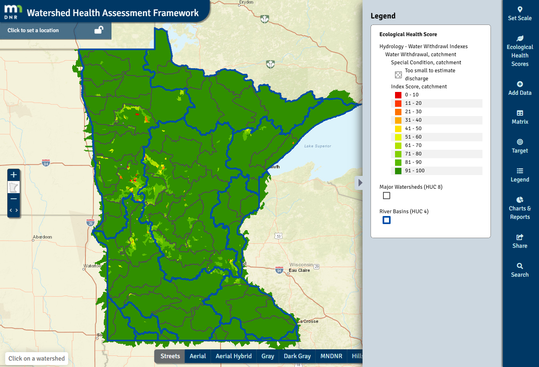 This is a statewide view of the updated Water Withdrawal Health Score. This score compares reported water use to a model of available runoff. Lower scores can flag areas that need further investigation. In some situations, water use can impact stream and lake levels, the quality of aquatic habitats or groundwater reserves. View map in browser.
-
The Water Withdrawal summary charts provide a chart and table view of the derived values that are used to calculate the index score. These products provide access to the entire record of available data, summarized for each catchment’s contributing watershed. The data includes annual values for: total precipitation, reported water use, estimated discharge, and the water withdrawal index (i.e., reported water use as a percent of estimated discharge). Here we provide a more detailed view of the data to support an investigation of a single watershed across all available data years; for example, we can use these visualizations to help determine if the current water use pattern is part of a long-term trend.
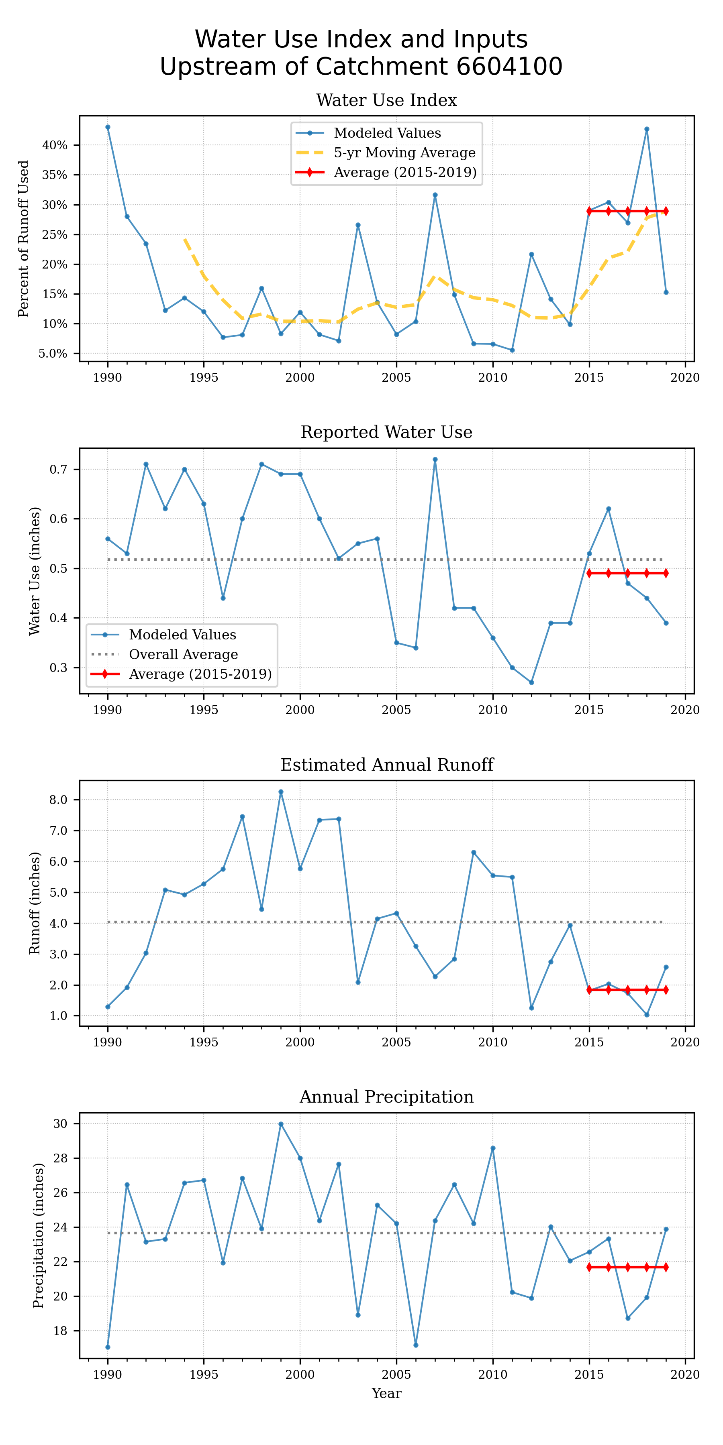 These Water Withdrawal charts display the entire expanded record (1990 – 2019). This example shows charts for Catchment 6604100 found in the Clearwater River Watershed of the Red River Basin. This catchment and its upstream watershed have seen a decrease in runoff from lower precipitation levels and an increase in the amount of water use. The model shows nearly 30 percent of available runoff is being consumed for permitted water uses in the most recent 5 years. View charts in WHAF app.
-
The Water Withdrawal Change map compares values from the most recent 5-years to the entire data record. With this approach, a positive value reflects areas with a decreasing level of stress to the water supply, and a negative value reflects areas with an increasing level of stress. This map is useful for identifying areas of emerging concern.
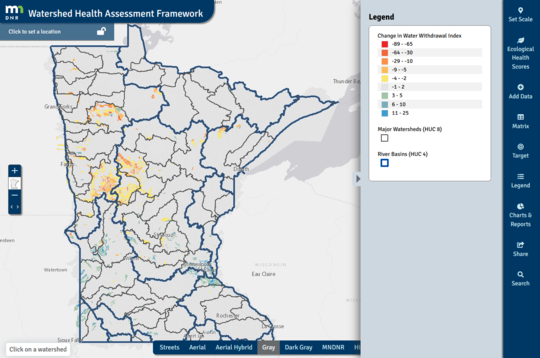 This statewide map shows a new data layer; Change in Water Withdrawal Index. These values compare the most recent 5 years (2014-2019) to the period of record (1990-2019) to indicate recent trends in water use. It is important to note that the index compares permitted water use to runoff. The runoff model incorporates increasing or decreasing precipitation and temperature, so changing climate may also play a role in where the index shows a change in water stress. View map in browser
Additional Change Layers
Check out these 'change maps' for two more WHAF health scores. Click the link to open them in your browser:
Change in Perennial Cover
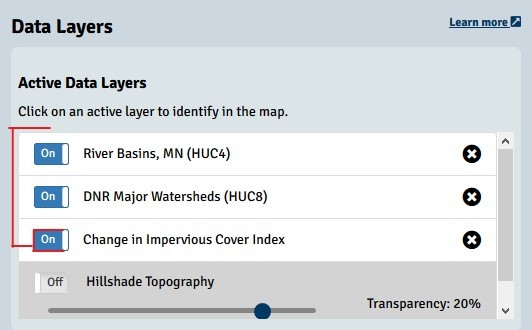
Change in Impervious Cover
WHAF MAP USE TIP: Open 'Add Data' panel; click and drag the 'Change' layer below Watersheds and Basins boundaries to help see where change is occurring.
As you explore the past and prepare for the future, stop back often to see what new tools the WHAF is bringing to the conversation.
Learning from the Past
Preparing for the future requires us to learn from the past; to re-evaluate earlier actions in light of present day outcomes. We need to apply that learning as we craft a path forward that has room to adjust, where options are available and essential resources have not been exhausted; a sustainable future that holds the promise for positive ecological and social outcomes for the next generation.
The WHAF team is working on ways to make it easier to review the way our landscape and our resource use has changed over time. Our Health Scores were designed to be repeatable, and after a decade we have enough data to look at how some indicators of health are changing.
Our next newsletter will describe how WHAF can help you investigate indicators of change.
|