|
The Mississippi River flows past St. Cloud, Minnesota. Photo Credit: MPCA Flickr, 2008
Connecting Land and Water
Have you had a chance to try out the new WHAF Land Cover application? You can explore and download charts and tables of land cover and water use at different watershed scales.
Open last month's newsletter to learn more about our new land cover visualization tool.
How has land cover changed in my watershed?
The land cover charts can be used together with other information in the WHAF to view land cover change over time. This example focuses on the North Fork Crow River Watershed in central Minnesota, on the northwest edge of the Twin Cities.
The Historic Landscape
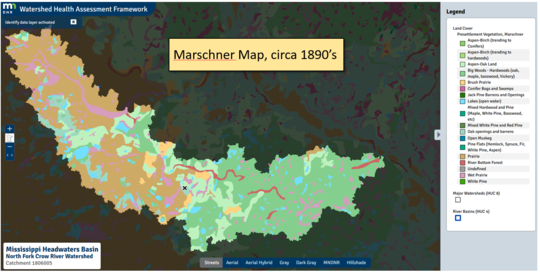
To understand land cover change, it helps to look back as far as possible. Fortunately for Minnesota, we have the 'Marschner Map', named for the cartographer that created a map from the notes and drawings of the land surveyors of the 1890's.
There are two ways to access this historic information in the WHAF:
- Add the Marschner Map data layer and view it in the WHAF Map
Description:
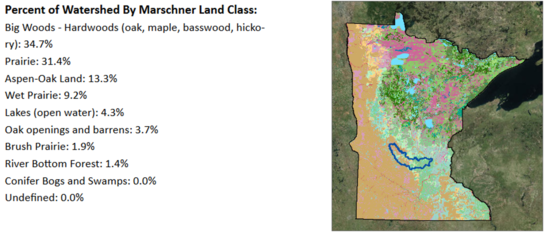
In the 1890's this landscape was predominantly Big Woods in the eastern half and prairie in the western half. Interspersed in wooded areas you would find aspen, oak, oak openings and barrens; and in wetter areas a mosaic of prairie, wet prairie and open water.
Today's Landscape (2016)
The land cover in this watershed has experienced a tremendous shift in response to human activity.
 Description:
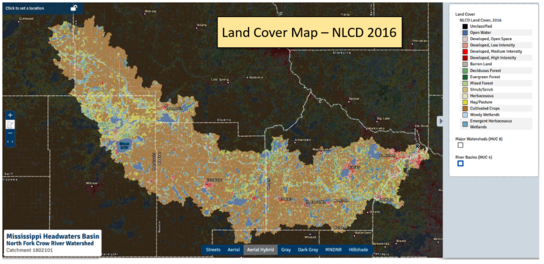
The eastern landscape of former Big Woods is now an area of mixed use. Agriculture dominates the open areas and urban infrastructure serves the growing small towns and roads connecting to the Twin Cities.
The western landscape of former dry and wet prairie is now an area of intense agricultural use. Some remnants of historic natural land cover remain, for example in the area near Green Lake in the northwest part of the watershed. Check out the Map
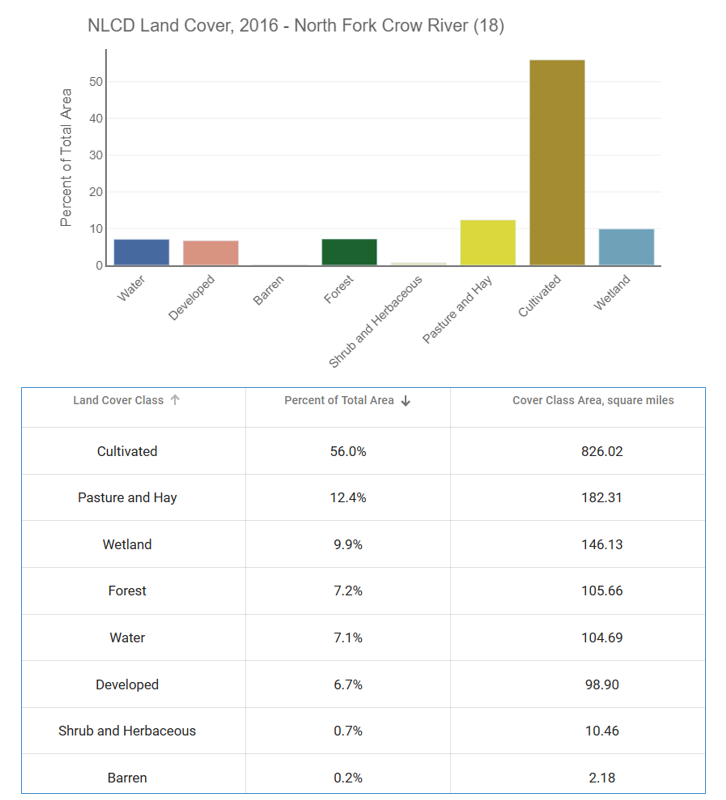
This land cover chart helps you visualize the land area for each cover type in the NLCD Data.
The table gives the values as a percent of total area and in square miles. For example, cultivated lands cover 56% of the total watershed, or 826 square miles.
Check out the Charts and Tables
|
Shift in Crop Cover
While the NLCD data shows the current amount of cultivated land, it is the detailed Crop History in the Land Cover application that reveals a more nuanced view of the agricultural story in the North Fork Crow River watershed.
Crop History - 1920's to Present
 Crop History Chart
Description:
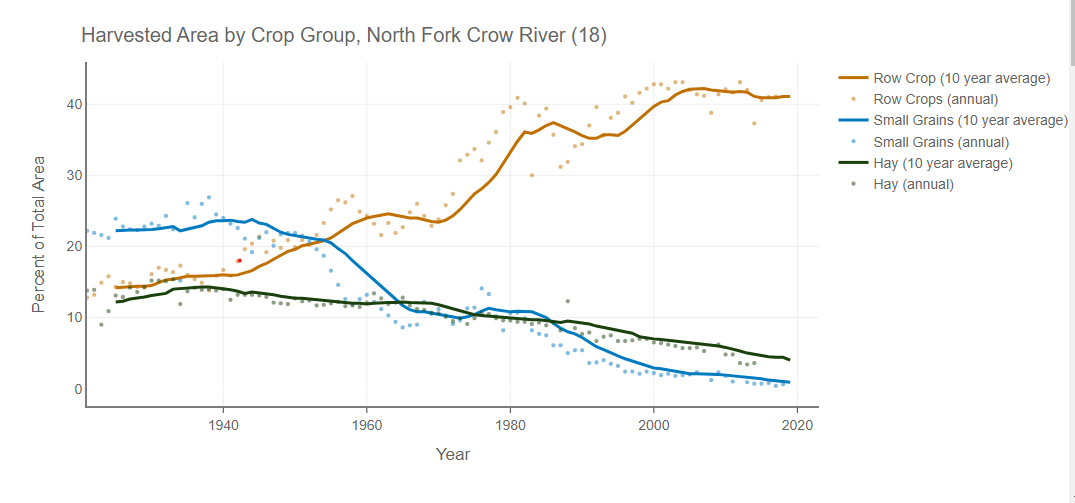
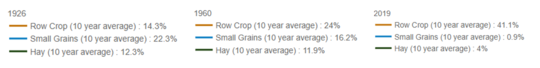
In the 1920's the cultivated lands were more diverse, with small grains, row crops and hay. By 1960, the shift was underway toward a row crop dominated agriculture. By 2019 the land area dedicated to small grains (0.9%) and hay (4%) was a very small percent of the total landscape. Row crops are now the predominate crop type and have expanded to cover more than 40% of the total land area in this major watershed. (The historic crop data values are generalized to the major watershed from the county scale.)
This century-long trend in agricultural land cover connects the historic landscape to today's resource management challenges. The loss of small grains and hay reduces the diversity of vegetation across the landscape. Row crops are often associated with expanded infrastructure such as tiling and irrigation. The timing of this land cover shift is reflected in the long term records of stream flow, further confirming the connections between our land and water resources.
Digging Deeper:
Land cover changed; why does it matter?
It matters because land cover impacts the way a watershed functions. Changes in cropping systems, new areas of development, expanding forest harvest and draining wetlands are examples of actions that change land cover and impact watershed health.
 |
|
Let's use the WHAF's 5 component framework to organize a look at connections between land cover and watershed health. |

Biology
Land cover provides habitat. As land cover changes, its value as habitat for plants and animals shifts to something different. Sometimes a change can provide better habitat, but most often it shifts to something less diverse and less desirable for Minnesota's native plants and animals. Less available quality habitat eventually leads to a decline in biodiversity and isolated populations that have reduced resilience to change or stress.
|

Connectivity
Connections occur throughout our natural systems. Picture a stream as it flows through a forest or prairie. There are important habitats within that stream, along the streambanks and across the uplands. Together this mosaic of habitats provides for the needs of the plants and animals that have adapted to living in that landscape.
When the type of vegetation changes, it affects the mosaic of habitats but also the flow of water off the land, the absorption and flow of energy, the way carbon is stored and the movement of nutrients.
|
Hydrology
Land cover and the movement of water are intimately connected. The historic landscape had a natural balance that held and released water under different seasonal and rainfall conditions.
urban and agricultural uses, the hydrologic cycle is altered. The pattern of seasonal and annual water flows shifts in response. Draining or paving over places that historically stored water further increases the amount of water sent downstream. Natural and human systems receive more surface water which can make storm events more impactful.
|
Geomorphology
From small streams to major river basins, our rivers have adjusted their shape in response to the altered inputs of water, sediment and energy. The loss of perennial vegetation forces our rivers to adjust to more water and higher sediment loads. The shift has created many stream channels that are deeply incised and less able to interact with their natural floodplain. This unbalanced system delivers more sediment and water downstream, creating a cascade of impacts.
|

Water Quality
Urban and agricultural activities have direct impacts on water quality. Higher stream flows may mobilize more sediment and other contaminants,
|
Land Cover Connections to Watershed Health
We know that the history of our land is deeply connected to the shape and health of our lakes, streams and rivers. Understanding the land cover changes that have already occurred can inform thoughtful decisions about how we choose to manage the land now and into the future.
Cumulatively, these changes in land use and resultant changes in hydrology, geomorphology, nutrient cycling, and sediment dynamics have had profound implications for aquatic ecosystems and biodiversity (Blann et al. 2009).
By creating easy access to the land cover story across Minnesota, the WHAF reveals important information about the historic relationship between land and water at different spatial scales. This understanding can help us find innovative actions that rebuild and reconnect natural systems to more sustainably cycle through our land, water, vegetation, and soil.
|