|
The new WHAF Land Cover Application delivers cropping history
NEW - WHAF Land Cover Analysis
We are pleased to announce the launch of the new WHAF Land Cover application!
Want to jump right in? You can open the application and begin exploring. Select a watershed scale and click a location on the map to view the charts and tables.
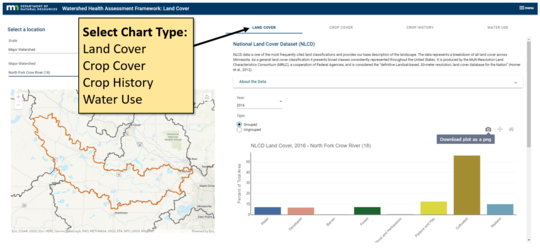
Or you can launch the application from the WHAF Map
- Click to open the 'Charts and Reports' panel
- Set a location in the map
- Select ‘watershed scale’ for the charts (default is Major Watershed)
- Select a Land Use Chart type
- Click the ‘Launch Land Cover’ button
The application Use Guide has tips that will help you navigate.
What will I find in the new Land Cover application?
When you launch the new Land Cover application, it will open a new tab in your browser. You can then select from one of the four chart types:
- Land Cover - National Land Cover Dataset (NLCD)
- Crop Cover - National Agricultural Statistics Service (CDL)
- Crop History - NASS Crop Survey data (NASS)
- Water Use - Reported Water Use, Modeled Runoff and Precipitation
Land Cover / Crop Cover
The Land Cover and Crop Cover summary charts are provided for several different years. The results can be downloaded as charts and tables.
For more detail, hover over the chart to display the values. Select the 'ungrouped' chart option to see all of the different land cover types.
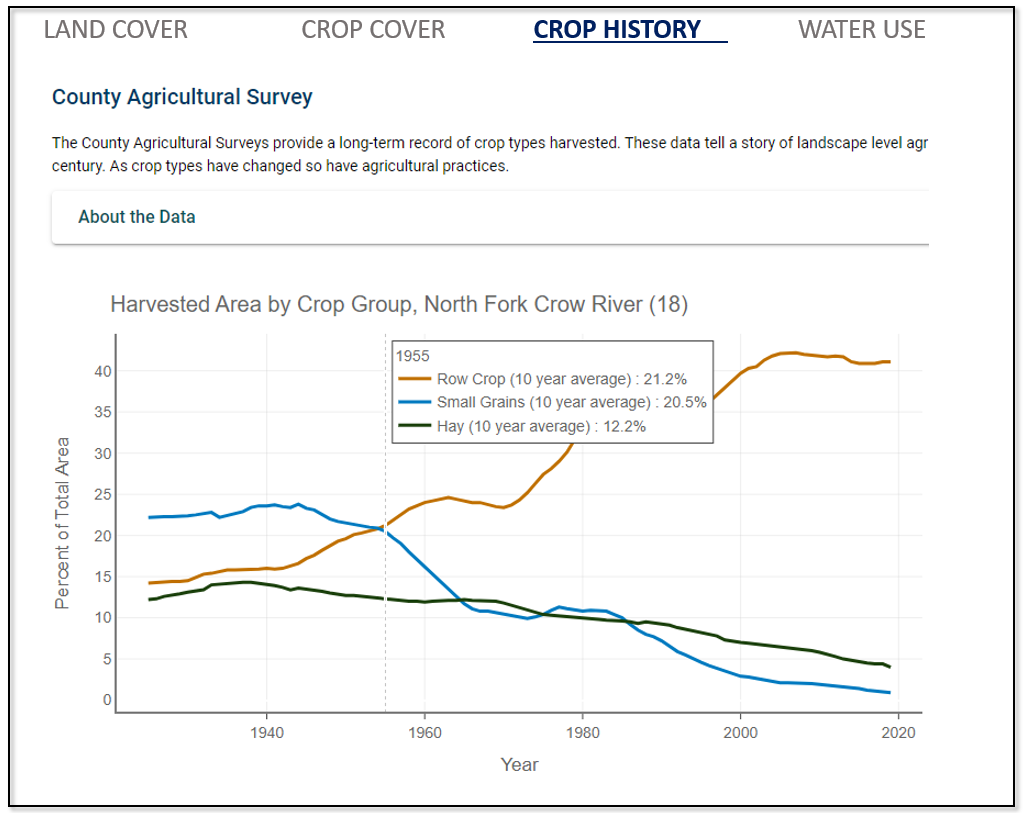
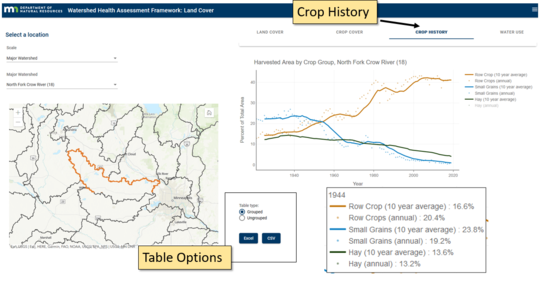
Crop History
The tab for Crop History displays trends in cropping systems from the late 1920’s through 2019. This new WHAF data product has been compiled to help watershed managers understand the timing of the shift from hay and small grains to predominately row crop systems. The impact of this shift is of interest to resource managers that are studying the connections between land cover and long-term changes in stream flow and groundwater systems.
The data summaries are available as both charts and tables.
Water Use
The water use charts compare the volume of reported water use to an estimate of runoff. The data can help to evaluate where water use runs the risk of exceeding water availability.
These charts only display when the ‘Upstream’ scale is selected. The upstream boundary is required to calculate the values delivered in the charts. These charts provide access to the data that is used to calculate the WHAF Water Withdrawal health score.
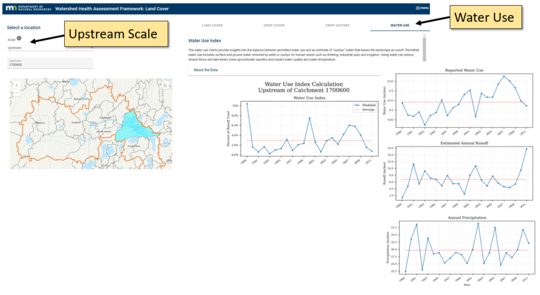 The charts include:
-
Water Use Index: The percent of estimated annual runoff (available water) consumed by permitted water appropriation (reported water use) for a catchment and its upstream contributing catchments.
-
Reported Water Use: The total annual volume of water appropriated (surface water and groundwater) reported by water appropriation permit holders, adjusted by consumptive use coefficient for the permit type.
-
Estimated Annual Runoff: Mean annual discharge for a catchment and its upstream catchments estimated using observed annual precipitation, mean annual temperature, drainage area, and geographic location. Calibrated by data from 54 stream gages with a continuous period of record from 1988 to 2007.
-
Annual Precipitation: Annual precipitation in inches for the upstream area (Prism Climate data, downloaded April 5, 2013, www.prism.oregonstate.edu).
|
Other Questions?
Each Land Cover chart includes additional information about the data being displayed. Expand 'About the Data' section to learn more.
The Land Cover application also has a help menu in the upper right. Click to expand and link to additional resources.
|
|
 |
The Land Cover application brings new flexibility to how data is viewed and delivered in the WHAF. Let us know what you think of this new interface! WHAF.DNR@state.mn.us
The Importance of Land Use Connections
The history of our land is deeply connected to the shape and health of our lakes, streams and rivers. Understanding the changes that have already occurred to land cover in Minnesota can inform thoughtful decisions about how we choose to manage the land now and into the future.
|