|
Nov. 17, 2020
This year’s MNAFPM virtual conference will occur in the mornings, over three days - Nov. 18-20, 2020.
Recognizing that a typical in-person event doesn’t always cater to those who aren’t in a floodplain-intensive role, this year’s webinar-style event will allow participants to come and go based on the sessions that interest them.
Registration for the 3-day conference is $50, and is still open.
Scholarships Available - Particularly for Local Officials
Scholarships are widely available for those who may need one. Budgets for training opportunities may be tight this year, but registration costs are not a reason to miss out!
For more information, including conference brochure, registration form, and scholarship application, please visit the MNAFPM website at www.mnafpm.org.
|
By Stacy Harwell, DNR, Floodplain Mapping Hydrologist
Need for updated floodplain maps in Minnesota
FEMA regularly evaluates the quality of floodplain studies and maps to determine if the maps in flood prone areas need updating. The objective is to provide communities, homeowners and local government officials with the most accurate tools for land use decisions.
The DNR and FEMA currently have a significant effort in progress to update floodplain maps in many areas around the state. Many counties in Minnesota have old paper maps, and some counties/cities have no FEMA mapping. In addition, some digital map counties have floodplain boundaries that are "digitally captured" from old paper maps.
In addition to the lack of data noted above, many maps are in need of updating due to a combination of better available data and changes in hydrology, including updates due to rainfall events becoming more intense and frequent than before.
Additional data in newer floodplain map updates
With the newest flood map updates and studies, all mapped flood zones have supporting data, and more flood frequencies are being calculated. In addition to the traditional one-percent (1%) annual chance flood, the 10%, 4%, 2% and 0.2% annual chance floods (i.e., the 10-year, 25-year, 50-year and 500-year) are calculated. One of the newest features in the updated studies is the 1%+ (plus) analysis. |
|
 |
How hydrology (the volume of water) is calculated
One of the first steps in floodplain mapping is estimating peak flows for a given flood event. To do this, FEMA has developed a process called Automated Engineering. Automated Engineering uses the best available data in an automated process that produces estimates of flood hazard boundaries.
The most common type of hydrology used in FEMA's Guidance for Flood Risk Analysis and Mapping: Automated Engineering is U.S. Geological Survey (USGS) regression equations. These equations are based on USGS gage analysis of flow data along with basin characteristics for individual regions across the state of Minnesota. The regression equations are graphed and used to determine discharge rates, that are then used as model input for specific flood events.
What is the 1%+ (plus)?
Because the regression equations are statistical in nature, and the end-products (e.g., Flood Insurance Rate Maps, or FIRMs) are used for important land use decisions, FEMA now requires that a standard error be factored in to the 1% flood event. Regression reports provide an “average standard error of prediction” that can be used to determine a 1%+ (plus) and 1%- (minus) flood event. |
|
 |
The 1%+ (plus) defines the upper confidence limit of the one percent annual chance discharge while the 1%- (minus) defines the lower. The concept is that the 1% annual chance flood will fall within these two curves, as shown in the regression graph. The standard error is associated with the regression equations developed for different regions in the state, so the standard error varies from region to region, just like the regression equations do.
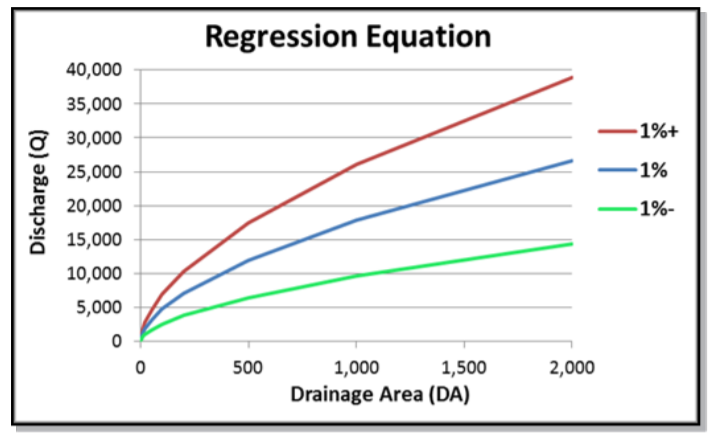 This regression equation graph shows the concept that there is some variability in the discharges (flow volumes) determined with the statistical analysis used. The discharge used to determine the regulatory 1% annual chance flood elevations is actually in the middle of the statistical range calculated. The upper range within the statistical standard deviation could represent the possibility of a significantly higher flood elevation.
How can decision makers use the 1%+ flood estimates?
While the 1%+ is not an actual “flood event,” local government officials and developers across the state can choose to use the 1%+ flood estimates if they want to factor in the statistical standard of error for a higher standard than the 1% flood.

Some possible uses of the 1%+ (plus) data:
- Map the 1%+ (plus) flood to reveal areas that are more sensitive to somewhat minor flow changes (i.e. flat topography).
- Map the 1%+ (plus) to help citizens and decision makers visualize the impacts while communicating flood risk.
- Add higher regulatory standards to your community's floodplain regulations. Use the 1%+ (plus) data rather than the 1% for determining Regulatory Flood Protection Elevations (RFPEs), or use it to determine whether a larger freeboard should be considered in your community's floodplain regulations. For example, if the 1%+ (plus) is one-half foot to a foot higher than the 1% in most of the community, consider an additional foot of freeboard for all new structures, or at least for new critical facilities.
As Minnesota continues with the updated FEMA mapping process, other uses for 1%+ (plus) may be discovered.
|
By Jeff Weiss, DNR, Clean Water Specialist
 |
|
The Coon Creek Watershed District (CCWD) and the City of Coon Rapids have partnered with DNR Ecological and Water Resources staff to address aquatic recreation and aquatic life impairments on Sand Creek in the City of Coon Rapids. |
Project goals
In 2018, a stream corridor restoration of Lower Sand Creek was implemented to reduce bank erosion and improve habitat. The partnership was awarded a second set of Clean Water Fund and US-EPA Section 319 grants for continuing stream corridor restoration in Middle Sand Creek. The project goals are to:
- Reduce sediment and phosphorous loading from bank erosion.
- Enhance habitat for native species.
- Reduce the impacts of altered hydrology while accommodating floods.
Why the projects were needed
There are multiple causes for the poor condition of Sand Creek. Much of the stream channel was ditched and straightened years ago causing the channel to cut downward and lose connection to its floodplain. Urban development within Lower Sand Creek occurred before stormwater regulations were enacted. There were many direct pipes to the stream which speeds up water delivery and causes stream flows to be “flashy.”
Upper Sand Creek is in better condition than Lower Sand Creek because stormwater regulations were in place prior to development and there are wetlands and stormwater ponds that help retain water and filter pollutants.
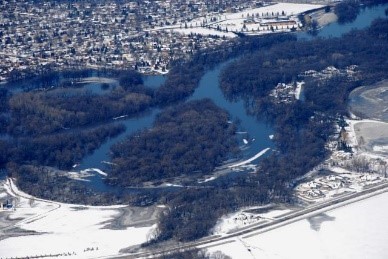
 The aerial image above is from a drone flight of Middle Sand Creek between construction phases showing the newly constructed “off-line” meanders that will form the new channel. Once the work is completed, the filled-in portions of the old channel will connect the flow.
Proposed Middle Sand Creek project
The Middle Sand Creek project area is divided into two reaches where differing techniques will be used to address problems.
- Upstream reach: Eroding banks will be stabilized using a variety of methods and instream habitat will be improved.
- Downstream reach: A newly remeandered channel and floodplain, designed by DNR Clean Water Specialist Nick Proulx and Wenck Associates, will be constructed that improve connection to the floodplain and accommodates flood flows.
The new channel will be constructed following the natural channel design principles instead of using traditional hard armoring techniques such as riprap. According to CCWD staff, there was initially public resistance due to the amount of disturbance the project would create and the number of trees that would need removal to accommodate a meandered channel. However, CCWD and DNR staff explained that the disturbance would be temporary and that tree removal was necessary to create space for the channel and the wider connected floodplain. The public has gained acceptance of the project through discussion and education.
Previous Lower Sand Creek work
Replacing invasive tree species with a variety of native vegetation in the Lower Sand Creek project area provided a glimpse of what the new project will eventually look like. Residents were also concerned about impacts to wildlife that use the stream corridor. After completion of the Lower Sand Creek project in 2019, residents believed they were seeing more wildlife use of the corridor and this helped alleviate concerns about tree removal and disturbance in the new project area.
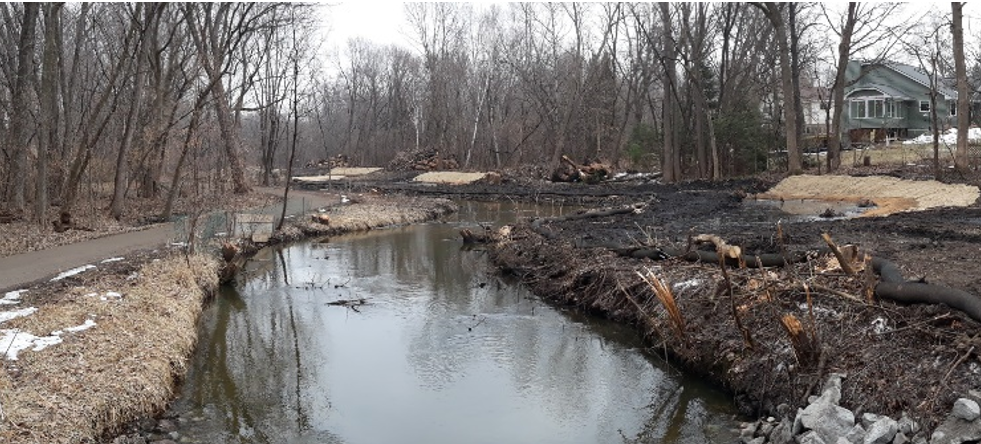 Before: Lower Sand Creek
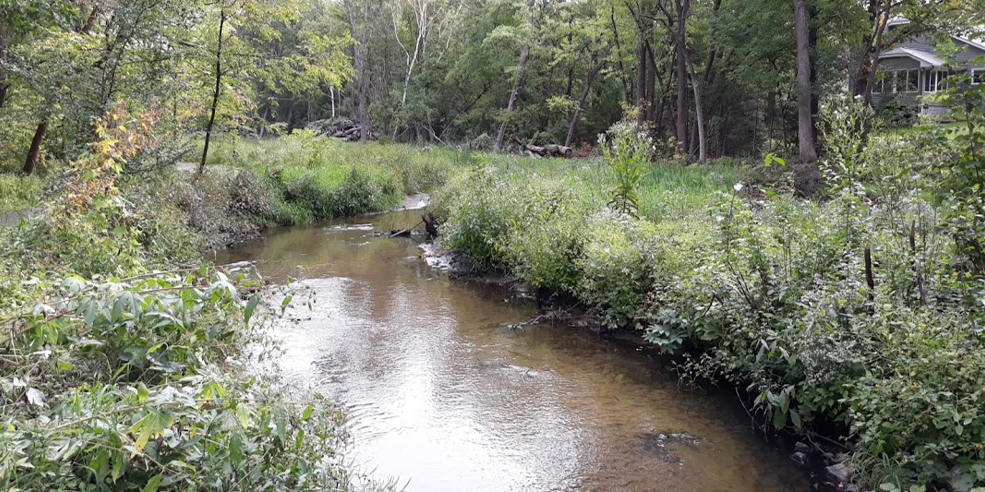 After: Same Lower Sand Creek site after vegetation has grown in.
The Lower Sand Creek project was completed in 2018-19. Half of the new channel and most of the floodplain of Middle Sand Creek were excavated in the winter of 2019-20. Excavation work of the channel was completed “off-line” with stream flow remaining in the old channel. This re-meandered section of the stream was left dry during 2020 to allow vegetation to grow and establish root structure. During this winter, 2020-2021, the other side of the floodplain and the new channel will be constructed while the old channel will be filled, thus completing the project.
Additional educational elements, including tours
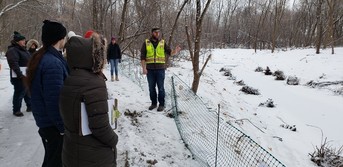
Additional project elements to be added include interpretive signing along a popular walking path next to the stream, hosting interactive “Watershed Walks” with CCWD staff, and continued monitoring and project maintenance. The photo on the right shows Jon Janke, of Coon Creek Watershed District, giving a site tour to Anoka Ramsey Community College biology students.
The Sand Creek corridor restoration will be completed soon. The partnership is now setting its sights on restoring the stream corridor of Coon Creek by applying what they have learned from the Sand Creek projects.
|
For more information contact Justine Dauphinais or Jon Janke at the Coon Creek Watershed District.
Editor’s note: We have two DNR staff named Jeff Weiss. One Jeff Weiss is an engineer leading the floodplain mapping program in our St. Paul office, and the author of this article is a Clean Water Specialist in our Rochester office.

The National Flood Insurance Program (NFIP) has had many short extensions since the last five-year extension that expired Sept. 30, 2017. The latest extension had been set to expire Sept. 30, 2020.
A one-year extension of the NFIP to Sept. 30, 2021 passed on Sept. 30, 2020 as part of the Federal budget continuing extension to Dec. 11, 2020.
Watch for the latest updates in the media and at the Association of State Floodplain Managers (ASFPM) site.
|
By Ceil Strauss, DNR, State Floodplain Manager
Editor's note: This is the second in a series on water infrastructure basics (see more at bottom of article).
In a September 2020 Water Talk article, Where Does Rainwater Go? (Part 1), we discussed:
- Findings from a recent nationwide survey in Water + Us: How We Think, Feel, and Take Action on Water that half of American adults do not know where stormwater ends up.
- Basics of stormwater infrastructure, including how runoff flows into storm drains, enters a network of underground storm sewer pipes, and ends up in our lakes and rivers.
Stormwater management views change over time
Historically, the focus on stormwater management was getting water to rivers and lakes as fast as possible to prevent flooding of homes, business and streets. However, while flooding may have been addressed upstream, the problems were pushed onto those living downstream. Many Minnesota communities recognized they needed to work together and started proactive flood modeling and planning many decades ago.
|
New development regulations often require stormwater runoff detention or storage
Many cities and watershed districts now require that new development projects infiltrate or temporarily store runoff to prevent flooding on site and in other parts of the community. Common examples of regulations for new development include:
-
Requiring the peak flow rate from the development be no greater than the pre-project rate. Since added impervious surface and changes in land use causes more of the rainwater to runoff, a portion of the runoff must be at least temporarily stored and allowed to drain from the site over longer time periods.
-
Requiring the first inch of runoff (or some other given amount) to be infiltrated. An option may be to drain water to "rain gardens" or depressions designed for infiltration or long-term ponding areas.
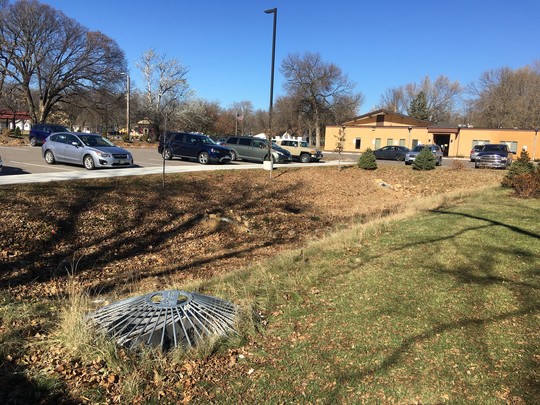 Stormwater retention area adjacent new parking lot expansion at a church
Stormwater ponding areas can have multiple uses
Many communities and watershed management organizations do flood modeling and planning at the city or watershed level. This planning includes regional ponding basins which are designed, and constructed, as development occurs. The ponds typically store at least the one-percent annual chance flood, also called the "100-year flood."
Most of the time, when there has not been a recent rain storm, a ponding basin can be used as part of the community's park system. In the example below, the lower portion of the ponding basin has been designed to hold runoff from the more frequent rains of up to several inches. A bit higher area is open space that can be used for baseball, soccer, or other recreational games - as well as other open space events - most of the time, but also provides ample storage for bigger rain events. In this example, a playground, hockey rink and a shed are all on land above the trail, and are uses which would have minimal damage with an even larger rain event.
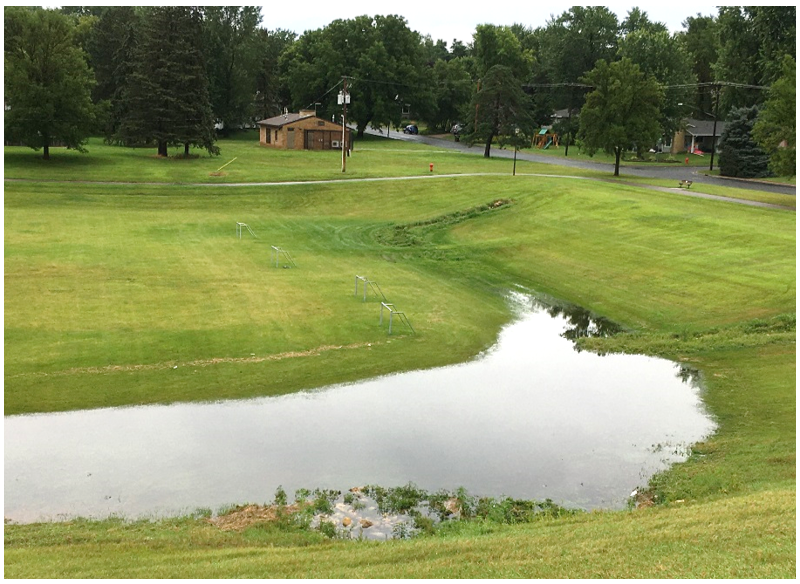 Community ponding area after several inches of rain.
People often do not realize the area is a ponding basin, complain about soggy areas on the field, and ask to have them filled. Some communities use signage to educate neighbors and park users about the importance of saving the potential area for storage of rainwater, and provide additional outreach explaining that if the area is filled it could increase the risk of flooding for nearby homes and businesses.
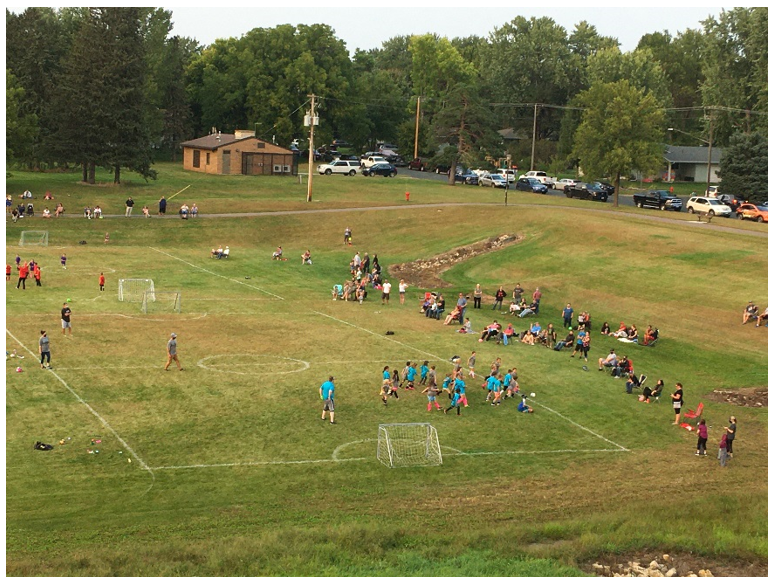 Same community ponding area dried out after the rain, being used by young soccer players.
Options for areas with limited space
In urban downtown settings, or areas with limited space, communities and watershed management organizations may require or encourage other options. Examples of techniques used successfully in many Twin Cities locations include stormwater re-use and underground storage.
Climate change means greater need for stormwater storage
With climate change, Minnesota is seeing gradual increases in total annual precipitation, but more of that precipitation is coming in bigger, more intense storms. Since 2000, widespread rains of more than six inches are four times more common than during the previous three decades, and we have seen a 65-percent increase in the number of three-inch rains.
Communities are seeing the need for even more storage and infiltration areas as they see the shift to more frequent larger storms. The 24-hour, one percent annual chance storms used for stormwater management design (based on the 1960 Technical Paper 40) have increased by about 30-percent in many parts of Minnesota (based on the updated 2013 technical document, Atlas 14).
Anticipated Water Infrastructure Basics Series:
- Where does rainwater go? Part 1: The main infrastructure. (See in September 2020 Water Talk.)
- Where does rainwater go? Part 2: Flood control features. (This issue)
- Where does rainwater go? Part 3: Water quality improvement features.
- Where does our drinking water come from? Part 1: The main infrastructure.
- Where does our drinking water come from? Part 2: Water source and quality challenges.
- Where does sanitary sewage (wastewater) go?
If you would like to see additional related topics in the newsletter, please send suggestions to Ceil Strauss.
This is the training that many of you have been waiting for! This course was originally designed to be a series of field training sessions over the past summer, but now is re-formatted to an online course. The total time commitment for this course is approximately eight hours, including four to five hours of self-paced instruction plus 2.5 hours of live instruction.
Course content:
- This course is intended to provide a wide variety of culvert designer's consistent knowledge for developing public waters culvert projects with respect to aquatic organism passage (fish passage) and stream connectivity.
- Attendees will learn how to apply best practices and appropriate calculations, starting from the basis of field-identified stream metrics.
- The training will use and expand on content from the 2019 Minnesota Guide for Stream Connectivity and Aquatic Organism Passage Through Culverts (PDF).
Course Registration:
The workshop is FREE.
For registration details: Go to the Minnesota LTAP site.
- Once registered, it begins with a self-paced learning component, available to participants for two weeks, followed by an instructor-led interactive online session.
- The self-paced learning will feature a series of short video presentations totaling approximately four hours, including virtual field data collection.
- The instructor-led session will provide an opportunity for discussion, questions, and review of work completed in the self-paced training.
|
Dates
Six sessions of the workshop will be offered; each session includes identical content.
Self-paced Available Live Session
Nov. 5-17, 2020 Nov. 18, 2020 - 1:00-3:30 pm
Jan. 7-19, 2021 Jan. 20, 2021 - 1:00-3:30 pm
Feb. 11-23, 2021 Feb. 24, 2021 - 1:00-3:30 pm
March 18-30, 2021 March 31, 2021 - 1:00-3:30 pm
May 6-18, 2021 May 19, 2021 - 1:00-3:30 pm
June 3-15, 2021 June 16, 2021 - 1:00-3:30 pm
Limited spots are available in each session, so register early to secure your preferred dates!
This workshop is sponsored by the Minnesota Department of Transportation and facilitated by Minnesota LTAP at the University of Minnesota.
By Ceil Strauss, DNR, State Floodplain Manager
State and federal regulations limit increases in flood elevations due to filling and development
State and federal regulations balance development in floodplains with potential for increased damage due to that development. When floodplain areas are filled, there is less room for the floodwaters. If that filling blocks part of the area where floodwaters flow during the one-percent annual chance flood, it can increase the flood elevation levels.
Maximum flood elevation increase allowed in Minnesota
While federal regulations allow the one-percent annual chance flood elevation to be increased up to one foot when designating the floodway - i.e., identifying the flood fringe areas where filling will be allowed - Minnesota regulations limit the increase to 0.5 foot, and specifies that the increase cannot increase flood damage potential (i.e., no existing buildings are in or touching the existing or proposed floodplain).
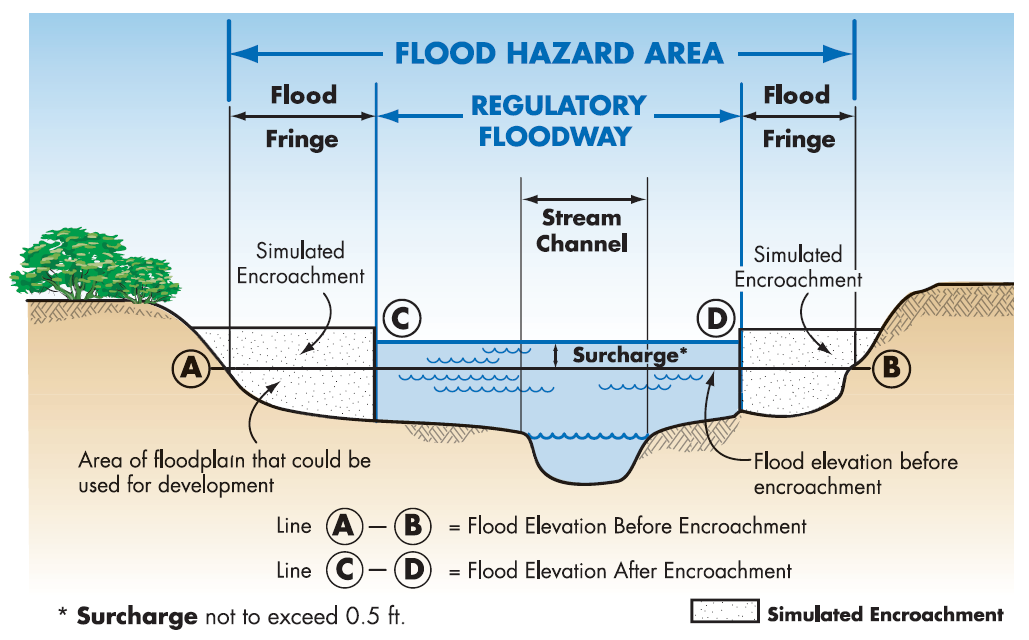 Graphic from 2020 Minnesota Floodplain Management Quick Guide (page 17) showing the modeling done with simulated filling in the flood fringe.
Allowable increases depend on whether the "floodway" has been designated (officially mapped)
In designated floodway:
- No development can be permitted that causes ANY increase (0.00 feet) in flood elevations.
- This requirement is based on federal and state regulations. Communities cannot give a variance.
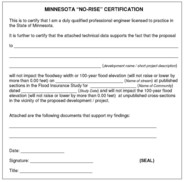
- The applicant must have a qualified professional engineer complete "No Rise Certification" (see sample Minnesota No Rise Certification form), and include supporting data.
- Communities must verify any proposed development in a floodway is one of the limited uses allowed in their ordinance.
|
|
 |
In Zone A, or Zone AE without a designated floodway:
- Development can be permitted for increases in flood elevation levels of up to 0.5 feet, as long as there is no increased flood damage potential (i.e., no existing buildings are in or touching the current or proposed floodplain). No flood level increase can be permitted if existing buildings would be impacted.
- Note: The cumulative impact of development cannot exceed the 0.5 feet increase limit. The local floodplain administrator is responsible for tracking cumulative impacts.
- If a building is proposed, the area must be shown to be flood fringe. The allowable increase in flood levels cannot be exceeded based on an analysis of the proposed area of development, and the area landward within the floodplain (i.e., the development cannot be an island of flood fringe).
- Communities must require supporting analysis demonstrating the proposed development will not exceed the allowable flood elevation increase be submitted before a permit is issued.
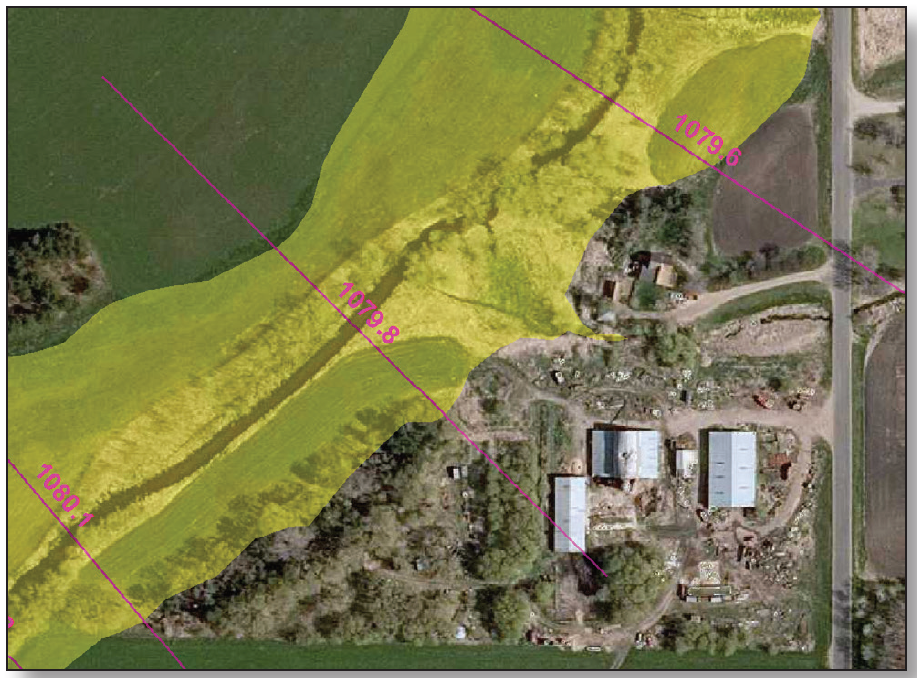 Sample map with "pink lines" showing cross sections with one-percent annual chance flood elevations from A Zone modeling.
Conditional Letter of Map Revisions (CLOMRs)
In limited cases, FEMA has the Conditional Letter of Map Revision (CLOMR) process to allow increases that exceed what is allowed by local floodplain ordinances. Additional engineering analysis, modeling, evaluation of impact, and community support are required.
A CLOMR is required for ANY proposed development:
- In a floodway that would cause a 0.01 foot or greater increase in the one-percent annual chance flood elevation
- In an A Zone, or AE Zone where the floodway has not been designated, where the increase would be greater than one foot. Note: Minnesota regulations limit the cumulative increase allowed by a community permit to 0.5 feet, as long as there is no increased flood damage potential (i.e., no existing buildings are in or touching the current or proposed floodplain).
- In rare situations, the DNR commissioner can approve increases between 0.5 and 1.0 foot if the impacted area is confined to land owned (or where flowage easements have been obtained) by the applicant and other strict state standards are met.
See more details about CLOMR requirements in the Minnesota DNR's LOMR/CLOMR Guide
Resources:
- For more guidance on A Zones versus AE Zones, establishing floodways and allowable flood elevation increases, and other floodplain management and mapping topics, please see the 2020 Minnesota Floodplain Management Quick Guide: available on DNR Floodplain ftp site.
- For more details about when Letters of Map Revisions (LOMRs) and CLOMRs are required see: Minnesota DNR's LOMR/CLOMR Guide
Past, scheduled, and anticipated dates since September 2020 Water Talk:
Preliminary Maps
- Lyon County (panels with levees) - 9/30/2020
- Itasca County - 11/20/2020 (anticipated)
- Anticipated Jan - March 2021: Carlton, Dodge, Le Sueur, Lincoln, Morrison, Pipestone, Rock, Wabasha and Winona Counties
Local Officials Meetings & Open Houses*
- Blue Earth County (revised prelim panels): Local Official Meeting - 1/5/2021 (tentative)
- Chippewa County: Flood Risk Review Meeting for Local Officials - Dec. 2020
- Koochiching County: Local Official Meeting - 10/22/2020; Open House - TBD 2021
- Olmsted County (panels): Local Official Meeting 11/10/2020; Open House - Jan. 2021
- Lake of the Woods County: Local Official Meeting - 10/23/2020; Open House - TBD 2021
- Lyon County (panels with changed levee designations in Minneota and Marshall): Local Official Meeting - 12/7/2020; Open House - 1/7/2021 (tentative)
- Murray County: Kick-off Meeting - Jan. 2021
- Pennington County: Open House - 12/2/2020
- Pope County: Local Official Meeting - Open House - 1/6/2021
- Stevens County: Local Official Meeting - Open House - 10/19/2020
- Waseca County: Flood Risk Review Meeting for Local Officials - Jan. 2021
- Watonwan County: Local Official Meeting 11/12/2020; Open House - Jan. 2021
*All meetings and open houses expected to be virtual until further notice.
90-Day Appeal Periods
- Cottonwood County - July 15 to Oct. 13, 2020
Letters of Final Determination (LFDs)
- Cottonwood County - March 2021
Effective (6 months after LFD date)
- Scott County - Feb. 12, 2021
- Red Lake County - March 9, 2021
- Marshall County - March 23, 2021
Additional Map Update Information:
|