 New Equity Analysis Dashboard
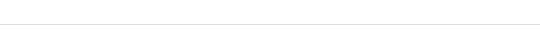
We have published a brand new data dashboard for your viewing pleasure. The Washington Balance of State Equity Analysis Dashboard has been launched on the Housing Assistance Unit’s Tableau Public page. This new dashboard will enable communities to identify disparities within their homeless services system and begin closing the gaps that exist among demographic groups.
While the dashboard's focus is on racial and ethnic disparity, there is also lots of information on the intersectional identities of gender and household type. If you missed the webinar we hosted back in October, then click here to register and view the recording. We hope everyone finds this tool useful in improving the services they deliver to those disproportionately impacted by homelessness. You can find the new dashboard here.
|
Calling All Users: HMIS Community Spotlight!

One of the things that make data great is the ability it has to impact decision making and improve processes. We want to hear from all of you about times when data saved the day. Have you been able to enhance your services thanks to identifying a trend? Did having clean numbers help you or your organization land a big grant? Did good data help you confront an organizational bias or correct an error? Let us know about it! People learn well from the experiences of others, and we want to highlight your experiences to facilitate that learning.
If you have a data success story, please send it to kyle.gitchell@commerce.wa.gov. Let’s show off some of that hard work.
|
Commerce has submitted the LSA (Longitudinal Systems Analysis) for the Balance of State to HUD and will be working on resolving data quality issues through the end of the calendar year. We are also in the process of submitting the Sys PM (System Performance Measures) for the Balance of State to HUD, the final report will be completed by March 1, 2021.
These reports are crucial to analyzing our system's effectiveness and for future HUD funding allocations for our communities. In working on all of this, we must be double-checking our data quality to ensure the most accurate system representations are being submitted. You can access tools like the Data Quality Report in Clarity or the Data Quality Dashboard to assess any data clean up you may need to do.
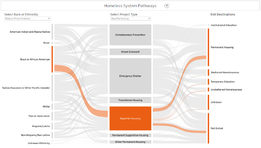
The quarterly dashboards have been updated for SFY Q1 2021 (July 1 - Sept. 30, 2020). This update includes the CHG Performance Tracker and the Data Quality Dashboard. The program-level performance dashboards have been discontinued as of SFY Q4 2020, but we are working on building a comprehensive dashboard to capture all of that information. The old dashboards are still available to review with data before SFY 2021.
You can access the Commerce Housing Assistance Unit dashboards here.
|

For this quarter’s newsletter, we have a great tip for getting more from your HMIS Clarity reports. Did you know that if you run reports as the “webpage” output format, they will allow you to drill down into the details and even link directly to client profiles?
When running a report in Clarity select “webpage” as your output format. Any of the numbers in the report will let you click on them to see which clients are being counted in those numbers. This also often shows the data points that caused the client to be counted there in the first place. For example, in the [HUD-225] HMIS Data Quality Report, you can click on the number in the “Name (3.1)/Information Missing” column to see which clients it is referring to. From there, it will provide the pertinent data points, and you can click on the Unique Identifier to go directly to the client’s profile.
This can be handy for determining why certain people are showing up in your reports and diagnosing any potential errors you may have.
You can find out more about report parameters here in a previous article we wrote or here on the Bitfocus website. Happy reporting!
|
Want to impress your coworkers with your charting skills or gain deeper insights into your data? The quick access tool in Excel allows for lightning-fast charts, tables, and formatting of all sorts.
Check out this article on how to build charts quickly without any fuss.
Falling out of love with your data and need to rekindle the romance? Alicia has your back.
One of our readers writes:
Dear Alicia,
My data and I are still working great together. However, some of my records would like to be made anonymous again. I totally understand and respect the decision, but I am worried I’ll have to start all over again. There is a lot of history there. I used to be able to just fax in the appropriate forms and we were good to go, now I’m not so sure. What should I do?
Revocations of consent are a totally normal thing to happen with individual records from time to time. Circumstances change and the information needs to be anonymized. Good for you for allowing that to happen and not trying to impede this process! Luckily we just published instructions for the new revocation of consent process during these extended teleworking times. You can access the instructions online at this link.
Thank you for writing and we wish you the best.
|