Changes are Coming to the Quarterly Dashboards
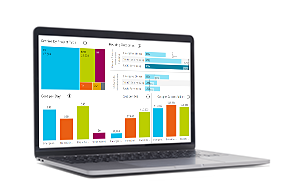
The quarterly dashboards have been updated for quarters 3 and 4 of State Fiscal Year 2020 (Jan. 1 - July 31). If you haven’t had the opportunity to view the array of visualizations that the analysts in the Housing Assistance Unit have developed, take a look at them on our Tableau Public page.
We are currently working on consolidating some of these down into one comprehensive system performance dashboard. This would take the Temporary Housing, Rapid Rehousing and Homelessness Prevention dashboards and put them into one set of visualizations. The hope is to have an easier-to-navigate one stop shop for all of your system performance data needs.
If you need the information in the current visualizations, don’t worry, they will still be available. We will simply be discontinuing updates as we move forward with this project. The rest of the dashboards are staying the same and will continue to be updated on their normal schedule.
|
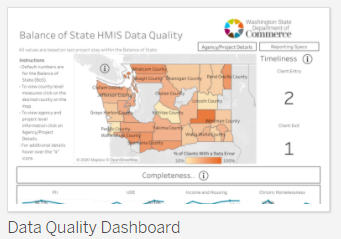
Data Quality Dashboard Spotlight
Have you ever wondered how your county is doing on HMIS data quality? How about trends in your agency or a specific project? The data quality dashboard on the Commerce Housing Assistance Unit Tableau page has you covered.
This dashboard is designed to replicate the measures from the HUD Data Quality Report available in HMIS, but presented to you in a visual format. This allows you to quickly identify trends in data quality measures to make adjustments to your processes.
The front page of the dashboard is all about the Balance of State. Here you can find error rates, timeliness measures, and accuracy measures county by county. Click on “Agency/Project Details” and you can view the same data by county, agency, project, and state fiscal quarter. If you are ever curious about how these measures are calculated or what counts as an error, the dashboard has several “i” icons that contain a wealth of information. You can also click on “Reporting Specs” to get detailed instructions on what constitutes an error in each field.
The data quality dashboard can be accessed here and is updated quarterly. We definitely think it is worth a look if you have not used this resource before.
|

Reports Corner
Every quarter we will examine a report or two to help you take ownership of your data.
HUD Data Quality Report
Maintaining good data quality is important to understanding your programs and accurately seeing your clients’ journeys through services. The [HUDX-225] HMIS Data Quality Report is a great way to evaluate the data in your agency and make corrections to errors. The Bitfocus Helpdesk has a great article detailing the report and the wealth of information contained within. You can access the article here to read more.
Don’t forget, any reports run in Clarity as the “web page” output format can be drilled down by clicking on the number of clients in each category. Then just click on the client ID to jump directly to their profile.
|
Excel at Excel Basics
Want to look like a spreadsheet wizard to impress your friends? Here we will explore the power of spreadsheets from the basics to advanced tips.
Conditional Formatting
Want to quickly identify key data in your spreadsheets? Conditional formatting can help quickly highlight specific data, highlight duplicates, create color scales, and much more. Check out this useful article on how to use conditional formatting in your spreadsheets.
Click here to read more.
Dear Alicia
Falling out of love with your data and need to rekindle the romance? Alicia has your back.
One of our readers writes:
“Dear Alicia,
I think my data just ghosted me. We just started seeing each other and I couldn’t remember their address so I Googled it and ended up somewhere I definitely didn’t recognize. Then when I finally found the site I was looking for the login they told me to use was all wrong. Is my data trying to avoid me deliberately? Am I misunderstanding something? Please help!”
Have no fear this is way more common than you think, even for people who have been accessing data for a long time. The first thing to check is the URL that you are visiting. The Washington Balance of State HMIS Site is located at https://wa.clarityhs.com. It is easy to confuse this from a Google search when there are so many different states with HMIS pages out there. The next thing to look out for is making sure you are entering the correct username (and hopefully remembering the password you set up). Remember that your username is some combination of your agency’s abbreviation, first name, last name. It may look something like “ABCFirstLast.” Often people try to use their emails when connecting with their data but that won’t be recognized.
I hope this helps you reconnect with your data!
|