|
Welcome to the Department of Rail and Public Transportation’s Data Stories! Data Stories is a monthly newsletter that uses the data collected or used by DRPT to find the narrative in the numbers. Data Stories promotes Virginia’s rail and transit community, and this month, the highlight is public transit ridership in Virginia. In Fiscal Year 2025 (July 2024 to June 2025), Virginia’s 40 public transit agencies combined to provide over 144 million trips – 14% more than in Fiscal Year 2024!
DRPT collects ridership figures for all 40 public transit providers in Virginia on a quarterly basis. These ridership numbers (among other performance measures) are collected not only to evaluate the performance of public transit in Virginia, but also to determine the formula funding DRPT provides for public transit.
Some notes on transit ridership before diving into the numbers:
Ridership: This Data Story uses the metric of unlinked passenger trips as the metric for ridership. The American Public Transit Association defines unlinked passenger trips (UPT) as the number of times passengers board a public transportation vehicle. Passengers are counted individually each time they board a vehicle, so if one trip requires a transfer from one bus to another, that counts as two unlinked passenger trips.
Fiscal year: This Data Story uses the State’s fiscal year (July 1st to June 30th) for this analysis. DRPT operates on the State fiscal year cycle and distributes funding to support public transit fiscal year by fiscal year.
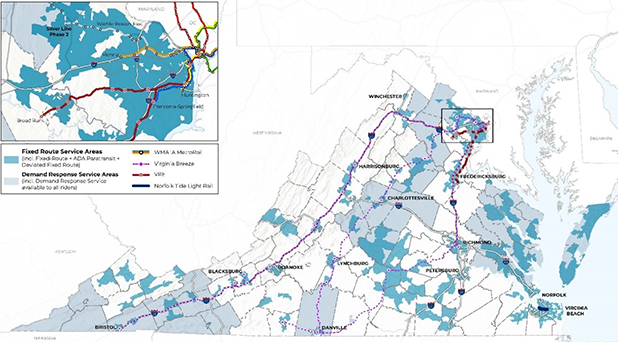
Public transit provider: The United States Code defines public transit as “…regular, continuing shared-ride surface transportation services that are open to the general public…” and excludes intercity passenger rail, vanpool programs, intercity or charter bus services, or other bus services not open to the public such as school buses or courtesy shuttles. Virginia has 40 public transit providers across the Commonwealth, covering all regions and geographies of Virginia. Not counted as public transit providers (and therefore not contributing to the total ridership numbers) include Amtrak, intercity buses like Greyhound, Flixbus, or the Virginia Breeze, commuter programs, and human service transportation providers. See the map below or the areas served by transit in Virginia.
Now, onto the ridership…
Transit ridership in Virginia has steadily increased over the past five fiscal years, demonstrating the demand for public transit. In FY 2025, Virginia’s 40 public transit services provided over 144 million trips, 18 million more than in FY 2024. Ridership growth in FY 2025 can be attributed to many factors, including more workers returning to the office after the COVID-19 pandemic, service expansions and enhancements, and ridership incentives such as zero-fare programs. The chart below shows Virginia transit ridership over the past five fiscal years:
 Notes:
- DRPT breaks out transit ridership between “Virginia Agencies”, WMATA, and VRE due to WMATA and VRE’s unique modes of transportation and operation, and their related separate funding sources from DRPT.
- Virginia Agencies refers to 38 of the 40 transit agencies that are primarily bus operators (though several have different modes).
- WMATA, or Metro, is the interstate transit authority in the Washington DC region that operates Metrorail, Metrobus, and Metroaccess. DRPT only collects ridership figures for WMATA trips that either began or ended in Virginia and do not include ones that were solely within DC or Maryland, or trips that passed-through Virginia without beginning or ending there. WMATA is funded separately from the Virginia Agencies or VRE and is the only subway rapid transit system in Virginia.
- VRE, or the Virginia Railway Express, is the commuter rail service operating along the I-95 and I-66 corridors into Washington DC. VRE is funded separately from Virginia Agencies and WMATA, and is the only commuter rail in Virginia.
Ridership fluctuates month to month, and by different transit providers. For example, transit operators in localities with a large university presence will provide more trips during the fall and spring and far fewer during summer. Transit providers that heavily cater towards commuters may experience fluctuations based on holidays, vacation seasons, and weather closures. Other transit providers that offer crucial day-to-day mobility options for their riders often have consistent ridership throughout the year. This next chart shows the statewide fluctuation in ridership by month in FY 2025:
 Although hard to see on this chart, the Virginia Railway Express earns a particular shout out, as its monthly ridership double between January and April 2025, increasing from 117,000 in January to almost 260,000 in April. That is a 121% increase in just a few months!
|