|
Welcome to the Department of Rail and Public Transportation’s Data Stories, and thank you for signing up! This monthly series aims to find the narrative in data DRPT collects and uses, highlighting Virginia’s rail and transit community. This month, DRPT dives into the cost of transportation and the distribution of households in Virginia without a car, and how public transit can save you money and get you where you need to go!
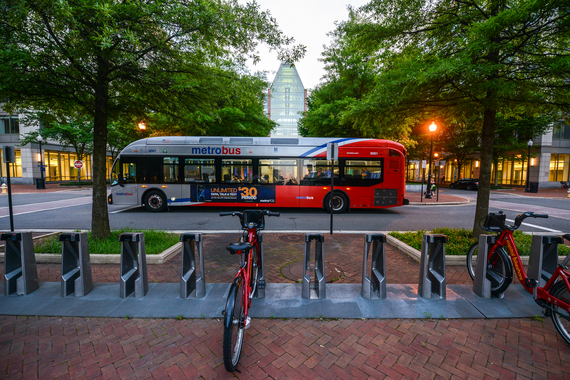
Driven by Costs, Choosing Transit
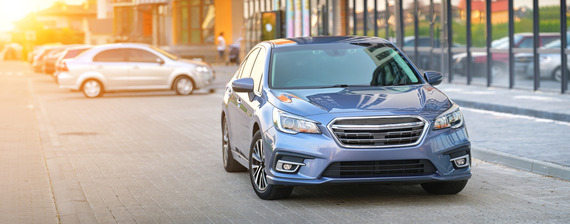 Transportation and transportation-related expenses are one of the largest expenses for the average American (and Virginian) household. According to data from the Bureau of Labor Statistics, transportation expenses are the second largest category of expenses for a household after paying for housing itself, costing over an estimated $13,000 per household per year. The lion’s share of those expenses goes towards personal vehicle costs (including payments, maintenance, and fuel) totaling to over $12,000 per year!
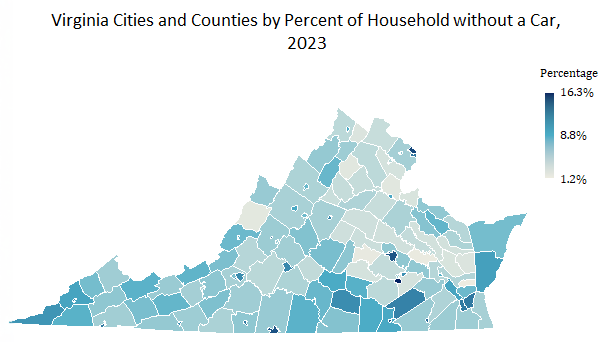
At the same time, an estimated 6% of households in Virginia have no access to a personal vehicle at all, per data from the American Community Survey. Those households come from across Virginia, from urban localities in Northern Virginia, to small towns in Southside.
What unites these two statistics is how public transit fits in. Riders taking public transit can save a lot of money compared to driving. Additionally, public transit provides an essential service for those households without a car.
Household Spending on Transportation
The Bureau of Labor Statistics produces annual Consumer Expenditure Surveys, which tracks the average expenses of an American household. The goal of this survey is to track consumer trends and identify where Americans are putting their money. The Consumer Expenditure Surveys tracks expenses at an extremely detailed level and for all kinds of purchases (ie: how much does a household, on average, spend on cereal?). Household spending on transportation is what this Data Story will analyze.
The average American household spends approximately 15% of its after-tax income on transportation in 2023, the vast majority of which goes towards personal vehicles. With the vast majority of American households having at least one car and nearly one in four households owning three or more cars, it is no surprise that paying for a vehicle makes up a large portion of those expenses. In addition to fuel, maintenance, and other expenses, the average American household spends over $12,000 annually on personal vehicles.
Public transportation of all kinds, comparatively, only make up a small portion of the average American household’s expenses. The table below, while not specific to Virginia, breaks down average household spending on transportation by category and percentage of after-tax income:
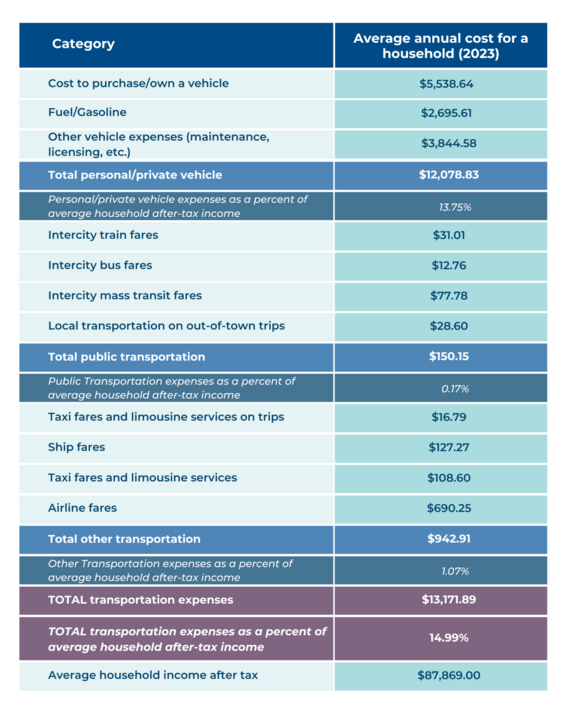 The low proportion of a household’s average income spent on public transportation suggests two things: First, many households spend little on public transportation because it is either not available or they do not use it frequently. Second, that the cost to use public transportation is a significantly less than to own, maintain, and use a car. (A note: These data use the mean average, so households that spend little or no money on public transportation bring down the average. Still, that spending on public transportation fares saves significant amount of money in the United States.)
Regardless, the cost of owning and maintaining a personal vehicle is the major driver of household spending on transportation. As the second largest household expense after housing itself, ways to reduce transportation costs can make a major difference to your wallet.
|