|
|
Welcome to the Department of Rail and Public Transportation’s Data Stories, and thank you for signing up! This monthly series aims to find the narrative in data DRPT collects and uses, highlighting Virginia’s rail and transit community. Data Stories is expanding from using DRPT-collected data to a new source: the United States Census Bureau. Using Census Bureau data, this month’s Data Story delves into the commutes of Virginia’s workers.
 Over 4.3 million Virginians commute to work most days of the week, with the average trip to work time being around 27.5 minutes (in one direction)! In a state with such varying geography as Virginia, and with so many changes to working habits in recent years, there are bound to be major differences in commuting patterns depending on where you live or work. This Data Story will look at how Virginians commuting patterns have changed in recent years, and how commuting patterns vary from locality to locality.
Before diving into this month’s topic, some quick notes about the data. This Data Story uses reports from the American Community Survey (ACS) – an annual survey conducted by the US Census Bureau. It is important to note that the ACS is a survey, not a census. That means only a fraction of Americans (around 3.5 million per year) are surveyed for the ACS, as opposed to the entire population with the Census. Consequently, the ACS has a margin of error for all data, but it can collect more specific data. The ACS is regarded as one of the most reliable and useful surveys out there. The ACS supplements the decennial census with data gathered on more specific topics – such as commuting patterns – and is available to anyone for use.
(Fun fact – the US Census Bureau has its own Data Stories series! This was not known to the author of DRPT Data Stories until this time and they bear no relation. Great minds think alike?)
|
|
Statewide Trends
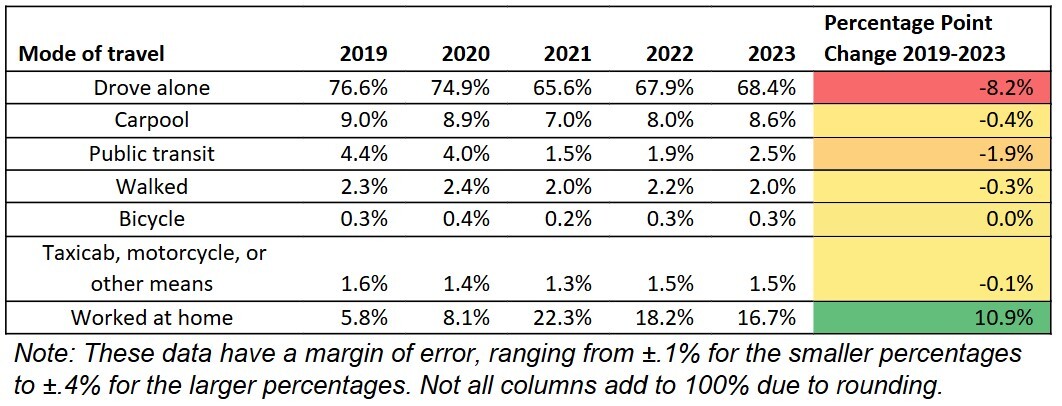
 Many Virginians' commuting habits have changed significantly over the five years between 2019 and 2023 (the most recent year ACS commuting data were available at the time of writing). In 2019, the majority of commuters drove to work alone, constituting over 76% of how all commuters got to work. Carpoolers made up 9% of trips, while teleworkers just under 6%. Around 4.4% of commuters took public transportation to work.
The impact of the pandemic caused a sudden shift in commuting patterns – largely driven by a sudden increase in telework. Driving alone remained the predominant means of driving to work – but teleworking became the second largest means of “commuting to work”. All forms of commuting – except for teleworking and biking – decreased between 2019 and 2023.
The table below visualizes the estimated percentage of commuters by mode of travel from 2019 to 2023, and the percentage point change over that period.
|
|
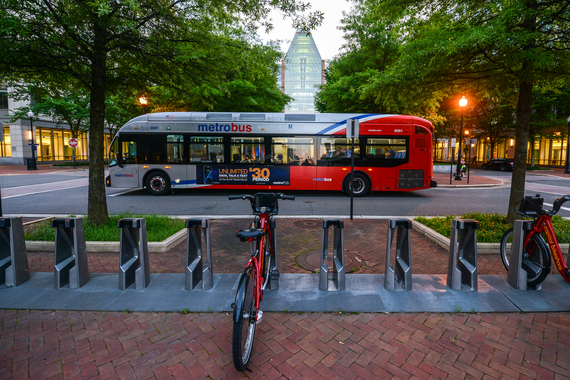
The ACS’s commuting report lags by a year due to the timing of its surveys and the time needed to analyze data. Fortunately, DRPT’s performance measures do not (our data are updated every three months!) and it can offer a hint into how taking public transit for commuting is changing. Though not all trips on public transit are commutes, the 21% year-over-year increase from fiscal year 2023 to fiscal year 2024 may suggest that more individuals are commuting via public transit. |
|
|
Localities Commuting Patterns
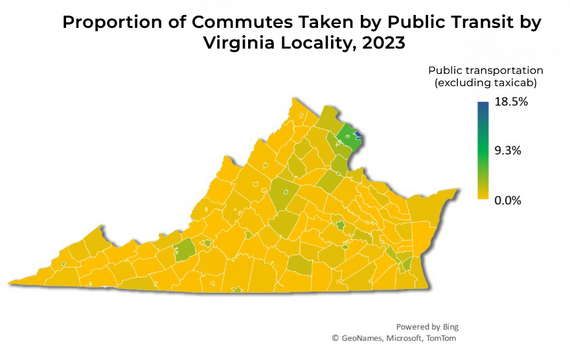
How Virginians commute also varies by where they live. The same data above provides estimates for how Virginians commute to work by the locality they live in. Naturally, there is significant variation by locality, ranging from an estimated 18.5% of commuters taking public transit to work to an estimated 0% taking public transit to work. The variation can largely be explained by access to public transit – localities with high-capacity transit systems will have more riders, and localities with no public transit will have no riders.
The map below shows what percentage of commuters from each city or county in Virginia take public transportation to work:
|
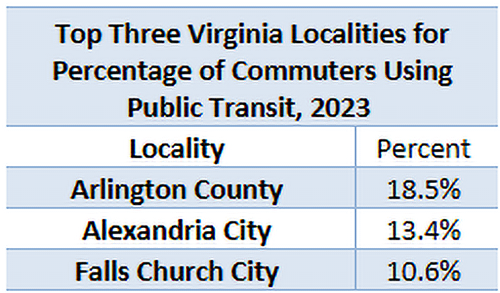
This table shows the top three localities for commuting to work by public transit.
|
|
 |
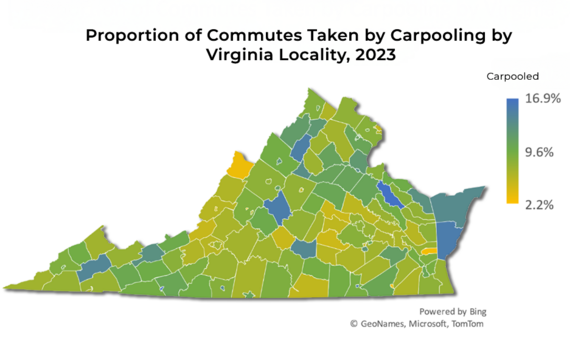
Carpooling has much greater regional variability than public transit, presumably because many carpools are casually arranged, unlike public transportation (Though DRPT does support carpooling or vanpooling to decrease congestion on Virginia’s roads and highways). Additionally, carpools are not restricted to areas where a commuter program service operates. The map below shows the estimated percentage of commuters that carpool to work by locality:
 |
|
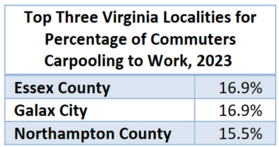
This table show the top three localities for commuting to work by carpooling
|
Virginians' commuting patterns vary greatly. Recent years have seen commuting habits upended, with all types of commuting decreasing since 2019 except for teleworking, which has seen a massive increase. Despite the decrease in the percentage of Virginians who commute to work via public transportation, ridership on public transit continues to increase. Similarly, the number of Virginians vanpooling to work continues to rise. DRPT’s programs to support public transportation, carpooling, and vanpooling, make these increases possible.
|
|
 DRPT’s mission is to connect and improve the quality of life for all Virginians with innovative transportation solutions. The SYIP turns that mission into action, by funding rail and public transportation priorities. With funding from the SYIP, transit agencies across Virginia provide over 10 million trips per month on buses, light rails, and subways. Freight rail programs divert around 14 million trucks from Virginia’s roads and attract hundreds of new jobs. Having trouble viewing this email? View it as a Web page.
Follow Us
|
|
|
|