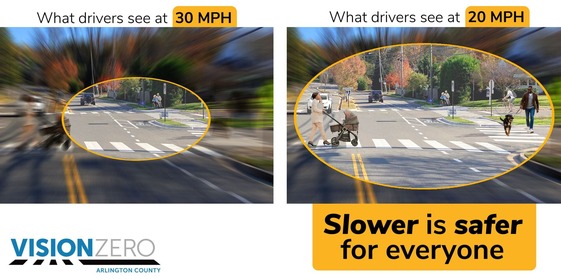
 Speed impacts your visibility. Slower is safer for everyone. As a driver, your speed matters. A person driving at 20 mph has double the field of vision and can stop twice as quickly compared to a person driving at 30 mph. Slower is safer for everyone.
Learn more about why speed matters.
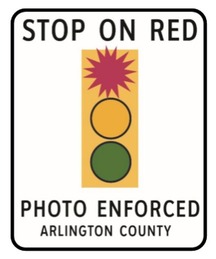
Arlington is expanding the Red-Light Safety Camera program (PhotoRED) in Summer 2024 to six (6) new intersections identified through red-light running-related crash data analysis.
Red light safety cameras are a safety tool found to reduce all injury crashes up to 25%, as they decrease red-light running and reduce serious injury crashes at intersections.
The new PhotoRED locations include:
-
EB and WB Columbia Pike at S Washington Blvd – Ticketing begins Sept 1, 2024
-
WB Langston Blvd at N Spout Run Pkwy and SB N Spout Run Pkwy at Langston Blvd – Ticketing begins Sept 1, 2024
-
EB and WB 10th St N at N Barton St – Ticketing begins Sept 1, 2024
-
WB Langston Blvd at N Lynn St – Ticketing begins Sept 1, 2024
-
WB Wilson Blvd at N Lynn St and NB N Lynn St at Wilson Blvd – Anticipated Go-Live Fall/Winter 2024
-
WB Langston Blvd at EB I-66 Exit 72 Offramp – Anticipated Go-Live Fall/Winter 2024
Arlington’s 2023 Annual Crash Report is available here! The report provides an overview of transportation and safety patterns throughout Arlington in 2023. In 2023, there were six fatal crashes, five of which involved alcohol and three involved speeding. There were 64 severe injury crashes, 111 pedestrian-involved crashes, and 52 bicycle-involved crashes. Studying these crash trends in depth helps Vision Zero staff to strategically target safety improvements and outreach to get closer to our goal of zero serious crashes in Arlington.

Transparency & Accountability is one of the six core Vision Zero program goals in Arlington. We are happy to provide this crash data dashboard tool (along with the new Vision Zero Program Dashboard) so the community can understand data trends, safety needs, and progress towards our Vision Zero mission.

Ever get confused navigating the Vision Zero website? There is now a handy side panel on our web page to help you find what you are looking for quicker!
Use the Quick Links side panel to get to pages concerning Vision Zero safety projects, audits and studies, dashboards, reports, and much more.

The first of three tactical speed hump pilot expansion corridors were installed two weekends ago on S Dinwiddie St in the Wakefield High School / Claremont Elementary School school zone.
These additional pilot installations were initiated following positive community feedback and significant reductions in speeding recorded along the three pilot corridors that currently have tactical speed hump installations. We identified pilot expansion locations using before / after speed data collection across all school slow zones installed prior to 2024.
The remaining two corridors (S Irving St and 22nd St S) are planned for installation before the start of the school year.
For more information, check out the Tactical Speed Hump Safety Pilot Project infosheet.

Red light cameras increase road safety and reduce serious injuries and fatalities caused by red light running. The footage collected by these cameras is reviewed by law enforcement, who issues the citations.
-
Reduce red light running
-
Reduce illegal right turns on red
-
Reduce serious angle crashes at intersections
-
Operates 24/7
Red Light Cameras are best used at signalized intersections with a history of red light running, red light running related crashes, right-angle crashes, or crashes between a vehicle going straight and a pedestrian or bicyclist.
Click here to find more information on Red Light Cameras as well as many of the other important road safety tools.
High-Injury Network Safety Audits:
Recently Completed Quick-builds:
Check out the updated Quick Build Safety Projects webpage that includes a map of the County's completed and proposed quick builds.
Visit the Vision Zero Safety Projects page to learn more about safety-driven quick build projects, capital projects, pilot projects, High-Injury Network safety audits, and more.
Also, check out our New Dashboard that shows crash data over the last 10 years, how and where we implement safety tools from the multimodal safety toolbox, our various safety initiatives, speed reduction corridors, and where we are doing outreach/engagement.
|