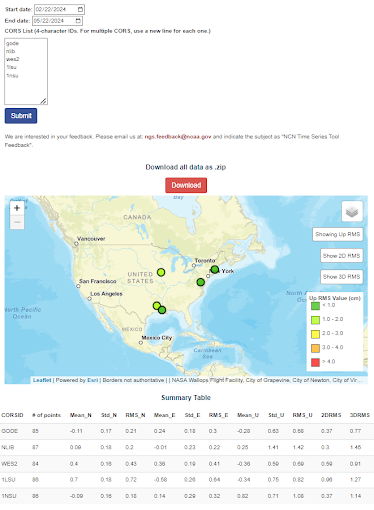
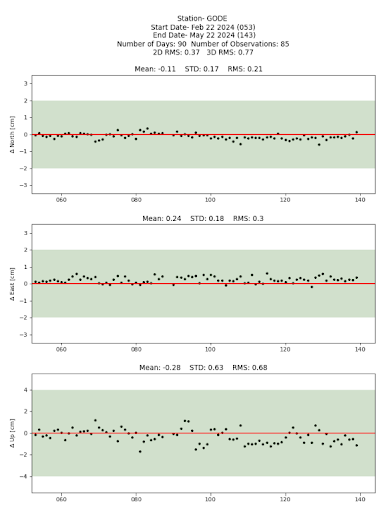
The NOAA CORS Network (NCN) Residual Time Series Comparison Tool (NCN PloTS) is now publicly available as an official NGS product on the geodesy.noaa.gov website. Previously called the CORS Time Series Tool, it computes and displays the daily residuals for up to 50 stations within the NCN as both individual time series and collectively on an interactive map. The mean, standard deviation, and root-mean-square (RMS) error of the residuals are also provided in a summary table that is available for download. This tool is optimized for plotting 30 to 90 days of data, but can be customized for other time frames. The earliest start date currently available is October 27, 2018, which is the completion date of the Mult-Year CORS Solution 2 (MYCS2) and the first date coordinates from that solution are available. The end date can be as recent as 3 days before the present day. This 3 day time lag is so that the final orbits can be used in the network adjustment to create the daily solutions.
|