The CORS Time-Series Tool allows users to evaluate the performance of a CORS in the NOAA CORS Network over any period of time from October 27th, 2018, to the present (the former date coinciding with the completion of the Multi-Year CORS Solution II, or MYCS2). Currently, NGS only offers time-series plots for either the entire data record of a station, or for the past 90 days.
The new tool, currently on our Beta site, allows the user to enter a list of station names and a date range, and the output are:
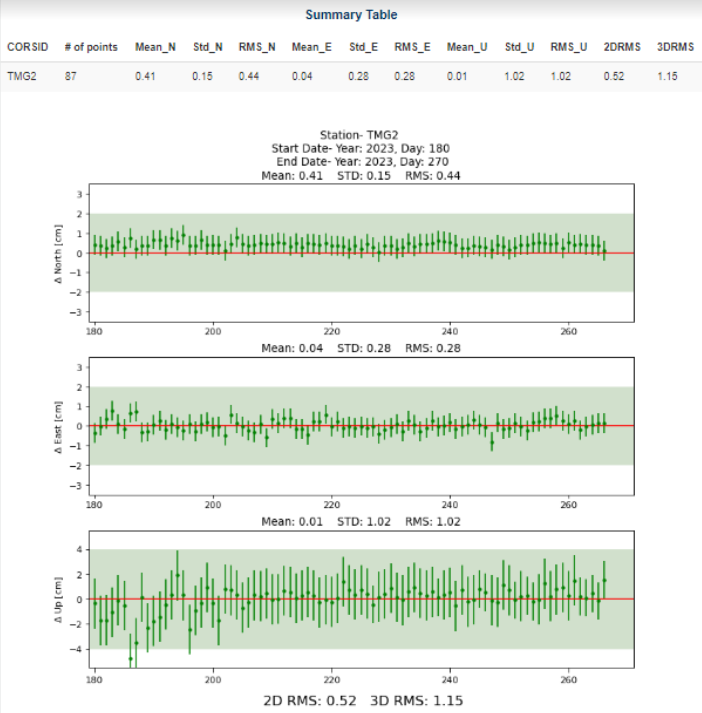
- time-series graphs showing the residuals or deviations from the published coordinates, and
- a table showing the mean, standard deviation, and root mean square error of these residuals.
The data can also be downloaded.
The tool also plots time-series graphs for multiple stations on the same page, which is helpful for quickly comparing stations. For processing projects older than 90 days, this new tool will provide users with helpful data when choosing stations for controlling their GPS projects.
NGS Welcomes Your Feedback

To help ensure that we are meeting your needs, NGS provides users with an opportunity to beta test our tools before their development is finalized. Please give this new tool a try and let us know what you think.
Email ngs.feedback@noaa.gov with your your comments and suggestions at any time.
|
|