New Bedford Top Port by Value for 19th Year in a Row
In 2018, U.S. fishermen landed 9.4 billion pounds of fish valued at $5.6 billion at ports around the nation—consistently high figures on par with recent years, which bring economic benefits up and down the seafood supply chain.
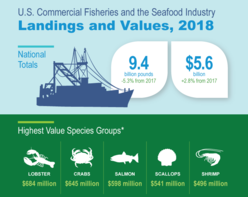
According to the Fisheries of the United States report, which is compiled by NOAA using data and analysis not immediately available at the same end of a fishing year, U.S. highest value species groups in 2018 included lobster ($684 million), crabs ($645 million), salmon ($598 million), scallops ($541 million), and shrimp ($496 million).
Dutch Harbor in Alaska, and New Bedford in Massachusetts, continue to dominate the list of top ports driven by landings of pollock for Alaska (the nation’s largest commercial fishery) and top-valued sea scallops in Massachusetts.
New Bedford brought in $431 million in 2018, up from $390 million in 2017, making it the top port by value in the country for the 19th straight year. Other top ports by value in the New England/Mid-Atlantic region include Cape May/Wildwood, NJ ($66 million), Point Judith, RI ($64 million), Stonington, ME ($60 million), Hampton Roads Area, VA ($55 million), and Gloucester, MA ($53 million).
|
Top ports by landings in the New England/Mid-Atlantic region are Reedville, VA (353 million pounds), New Bedford, MA (114 million pounds), Cape May/Wildwood, NJ (102 million pounds), Gloucester, MA (59 million pounds), Point Judith, RI (48 million pounds), and Portland, ME (46 million pounds).
Recreational Fishing
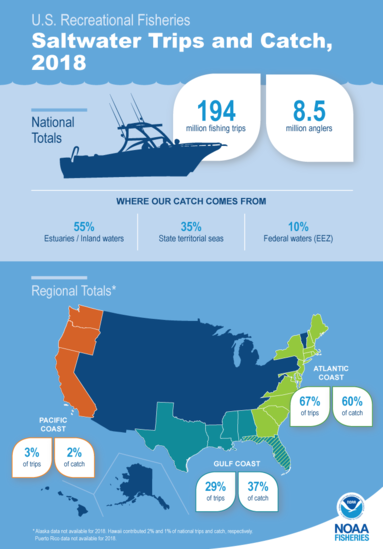
Recreational anglers also had a banner year, with 8.5 million anglers taking 194 million saltwater fishing trips that reeled in top species like striped bass, dolphinfish, red snapper, yellowfin tuna, red drum, and spotted seatrout.
More than 62 million of those trips were in the New England/Mid-Atlantic region.
|
Aquaculture
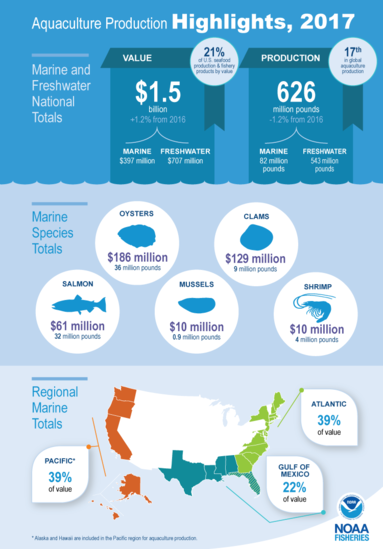
Although figures for U.S. marine and freshwater aquaculture production lag by a year, the report found that in 2017 these industries remained strong at $1.5 billion, with farmed oysters, clams, and salmon generating the highest values for marine aquaculture.
Atlantic salmon is the leading species for marine finfish aquaculture (32.4 million pounds), while oysters have the highest volume (36.5 million pounds) for marine shellfish production. Thriving shellfish industries can be found in all coastal regions
of the United States, however the Atlantic and Pacific Coast states produce more oysters, clams, and mussels by value ($117.8 and $120.3 million, respectively), while the Gulf states produce more by volume (24.9 million pounds).
Seafood Consumption
Seafood consumption was slightly higher in 2018 at 16.1 pounds (up 0.1 pounds from 2017), the result of consumption increases in fresh and frozen seafood products. The USDA’s Dietary Guidelines for Americans recommend that people eat two 4-ounce servings of seafood each week, totaling 26 pounds per year per individual.
Seafood Trade
The report also outlines U.S. seafood trade statistics. Overall the United States imported $22.4 billion worth of edible seafood products and exported $5.6 billion for a trade deficit of $16.8 billion.
View more statistics from the report, including detailed information about specific fish stocks and industry sectors.
|
|