|
Household saving increased sharply during the COVID-19 crisis in many countries. Lower consumption, both as a result of lockdowns or precaution, combined with an increase in disposable income from government transfers allowed households to put more money into their bank accounts, buy shares, a house, or pay back their debt. Along with saving, surging equity and housing prices also made certain households a lot wealthier.
In our latest chart of the week, an analysis of US data as part of our recent External Sector Report found the bulk of the increase in saving and wealth occurred at the top of the wealth distribution. Indeed, while recent research has documented that household saving has historically been very unevenly distributed in the United States, very little is known of how the increase in saving or wealth since the beginning of the pandemic was distributed.
Our chart, based on data published by the Federal Reserve, tries to answer this by plotting the changes in household net wealth by percentile (expressed as a ratio of total nationwide personal disposable income) during the pandemic and during a period of time before the pandemic we refer to as “normal times.”
What we found is the net wealth of the top 1 percent richest households rose by nearly 35 percentage points of the economy’s disposable income compared to a modest 5-percentage-point increase for households in the bottom 50 percent.
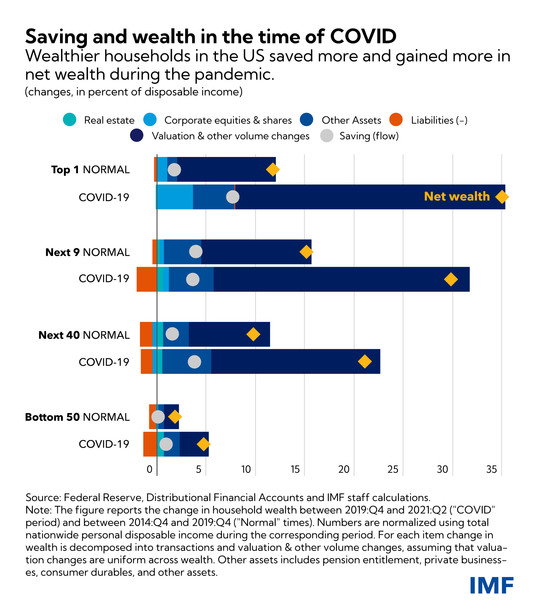 The chart unveils four key points:
- The overall increase in net wealth, in percent of disposable income, was considerably larger during the pandemic (between the end of 2019 and the second quarter of 2021) than during normal times (between the end of 2014 and end of 2019).
- It was driven mainly by valuation changes (due to booming equity and housing prices) as well as, to some extent, by the “COVID saving surge” (with a jump in “other assets,” including bank deposits).
- This overall increase in net wealth was also unevenly distributed, with much of it accruing to people at the top of the distribution. Indeed, the equity price boom mostly benefitted the rich, while lockdowns more heavily affected spending on dining and travel, which make a larger part of wealthier households’ consumption habits. Additionally, government support, in the form of direct stimulus or support to firms, also benefitted the saving of wealthier households compared to poorer households that were more likely to spend the extra cash.
- At the same time, the distribution of wealth across groups did not change much, as the increases in net wealth were relatively in line with the pre-pandemic shares in the wealth distribution.
*****
Related links:
|