
TransBorder Freight Annual Report 2024
U.S. Department of Transportation sent this bulletin at 03/20/2025 11:30 AM EDT |
|
Having trouble viewing this email? View it as a Web page. |
TransBorder Freight Annual Report 2024
The Bureau of Transportation Statistics (BTS) compiled the dollar value of commodities that moved across the United States’ land borders with Canada and Mexico by mode of transportation in 2024. Manufacturing and logistics sectors across North America are linked and interdependent. America’s land borders with Canada and Mexico are economically vital conduits for North American supply chains, with nearly $3.5 billion in daily cross-border freight shipments. Besides oil and energy products, automobiles, and electronics, Canada and Mexico are also America’s largest trade partners in agricultural goods.
U.S. land borders with Canada and Mexico consistently facilitate over $1 trillion in cross-border trade annually. To put things in perspective, in 2024 the value of total U.S.-international trade was $5.3 trillion, of which U.S. trade with Canada and Mexico comprised 30.0 percent. In 2024, U.S. freight flows with Canada and Mexico equaled $1.6 trillion dollars, a 1.8% increase over 2023.
Surface modes of transportation (truck + rail) lead North American commerce, together accounting for 77.1% of all freight flows by dollar value in 2024. Trucking continues to be the dominant form of freight transportation in North America, accounting for 55.5% of total flows with Canada and 72.5% with Mexico. Rail was second place with 13.8% with Canada and 11.7% with Mexico.
Table 1a. Value of Monthly U.S.-North American Freight Flows
(USD Millions)
| Month | 2021 | 2022 | 2023 | 2024 | Percent Change 2021-2024 |
| January | 94,284 | 113,707 | 125,783 | 124,177 | 31.7 |
| February | 95,860 | 112,459 | 119,919 | 128,916 | 34.5 |
| March | 114,587 | 141,850 | 141,472 | 133,540 | 16.5 |
| April | 107,369 | 135,255 | 126,573 | 137,996 | 28.5 |
| May | 108,646 | 139,439 | 136,241 | 138,924 | 27.9 |
| June | 115,955 | 141,238 | 134,795 | 134,229 | 15.8 |
| July | 111,270 | 132,559 | 127,052 | 134,156 | 20.6 |
| August | 113,075 | 140,339 | 138,015 | 136,726 | 20.9 |
| September | 109,220 | 133,934 | 131,816 | 136,271 | 24.8 |
| October | 117,417 | 133,756 | 138,501 | 138,889 | 18.3 |
| November | 120,094 | 125,826 | 131,020 | 130,976 | 9.1 |
| December | 117,548 | 121,668 | 121,586 | 126,292 | 7.4 |
| Annual | 1,325,325 | 1,572,031 | 1,572,774 | 1,601,091 | 20.8 |
Note: Totals includes mail and other.
Source: Bureau of Transportation Statistics, Transborder Freight Data, available at https://data.bts.gov/stories/s/kijm-95mr
Table 1b. Modal Percent Value of U.S. Merchandise Trade with Canada and Mexico: 2024
USD Actual
| Mode | U.S.-Canada Freight | Modal percent | U.S.-Mexico Freight | Modal percent | U.S.-Canada/Mexico Combined Freight | Total freight modal percent |
| Total | 761,199,136,085 | 100.0% | 839,891,957,628 | 100.0% | 1,601,091,093,713 | 100.0% |
| Truck | 422,798,198,587 | 55.5% | 609,009,458,647 | 72.5% | 1,031,807,657,234 | 64.4% |
| Rail | 104,842,208,703 | 13.8% | 98,251,163,890 | 11.7% | 203,093,372,593 | 12.7% |
| Vessel | 38,366,978,459 | 5.0% | 81,730,021,474 | 9.7% | 120,096,999,933 | 7.5% |
| Pipeline | 100,862,007,475 | 13.3% | 5,742,347,610 | 0.7% | 106,604,355,085 | 6.7% |
| Other (including unknown) | 55,221,818,747 | 7.3% | 17,028,588,740 | 2.0% | 72,250,407,487 | 4.5% |
| Air | 34,615,154,875 | 4.5% | 21,530,855,386 | 2.6% | 56,146,010,261 | 3.5% |
| Imports into Foreign Trade Zones | 4,465,611,416 | 0.6% | 6,597,038,822 | 0.8% | 11,062,650,238 | 0.7% |
| 27,157,823 | 0.0% | 2,483,059 | 0.0% | 29,640,882 | 0.0% |
Source: Bureau of Transportation Statistics, Transborder Freight Data, available at https://data.bts.gov/stories/s/kijm-95mr
Table 2: Value of U.S. Freight with Canada and Mexico as a Percentage of Total U.S. Trade: 2019 - 2024
USD Actual
| Year | U.S.-Canada Freight | U.S.-Mexico Freight | U.S.-North America Combined | U.S.-Int'l Freight | Percent of Total | Year-over-year change |
| 2019 | 612,117,585,003 | 614,500,090,695 | 1,226,617,675,698 | 4,137,639,906,375 | 29.6 | |
| 2020 | 525,531,097,628 | 538,066,059,696 | 1,063,597,157,324 | 3,761,472,584,841 | 28.3 | -13.3 |
| 2021 | 664,160,506,749 | 661,164,319,325 | 1,325,324,826,074 | 4,586,259,225,321 | 28.9 | 24.6 |
| 2022 | 792,722,458,974 | 779,307,814,494 | 1,572,030,273,468 | 5,306,326,672,111 | 29.6 | 18.6 |
| 2023 | 773,938,974,684 | 798,834,655,096 | 1,572,773,629,780 | 5,098,229,579,346 | 30.8 | 0.0 |
| 2024 | 761,199,136,085 | 839,891,957,628 | 1,601,091,093,713 | 5,331,905,478,186 | 30.0 | 1.8 |
Sources: Bureau of Transportation Statistics, TransBorder Freight Data, https://data.bts.gov/stories/s/kijm-95mr
Figure 1. U.S. Freight with Canada and Mexico as Percent of Total U.S. Trade (USD): 2019 - 2024
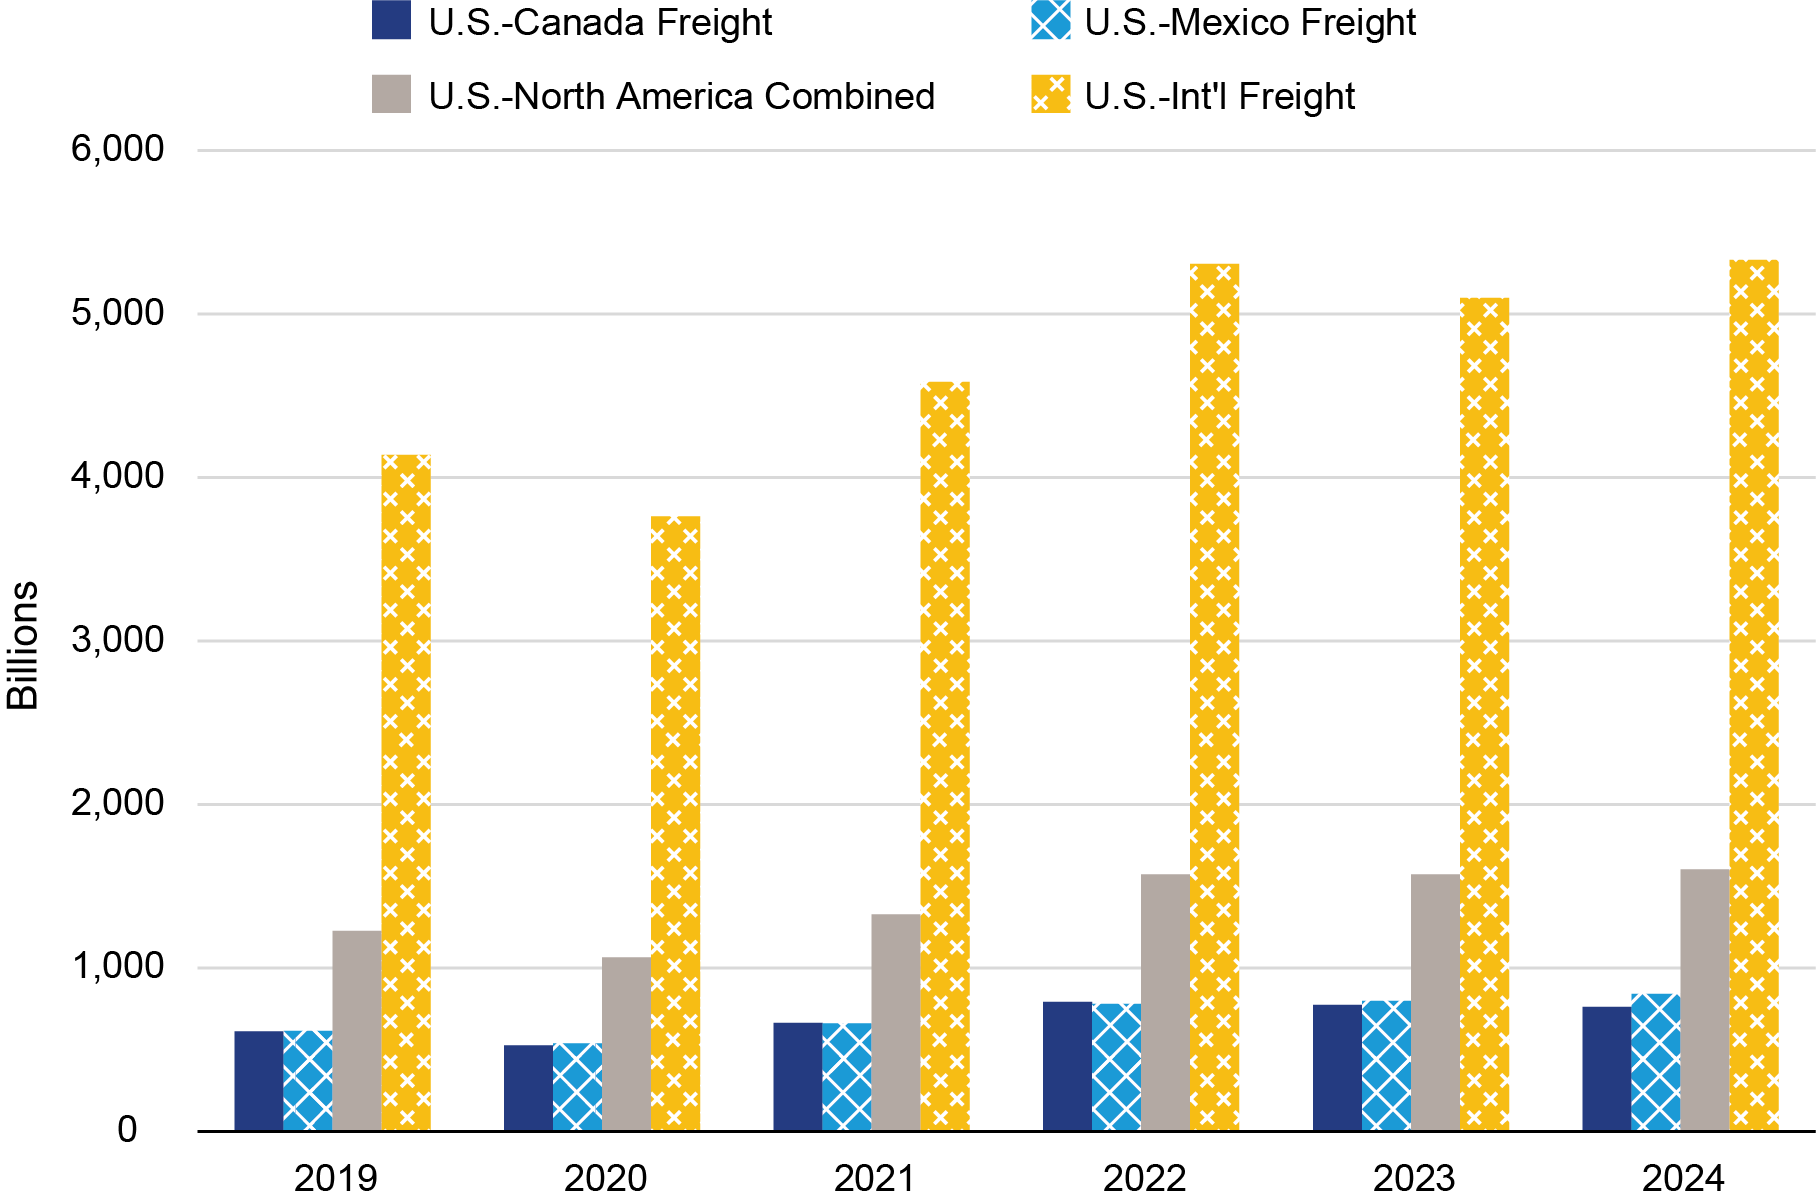
Source: Bureau of Transportation Statistics, Transborder Freight Data, available at https://data.bts.gov/stories/s/kijm-95mr
U.S.-North American Freight Points
- Total transborder freight: $1.6 trillion of transborder freight moved by all modes of transportation, 1.8% change compared to 2023
- Freight between the U.S. and Canada: $761.2 billion, down 1.6% from 2023
- Freight between the U.S. and Mexico: $839.9 billion, up 5.1% from 2023
- Trucks moved $1.0 trillion of freight, up 3.6% compared to 2023
- Railways moved $203.1 billion of freight, down 2.9% compared to 2023
- Vessels moved $120.1 billion of freight, down 4.9% compared to 2023
- Pipelines moved $106.6 billion of freight, down 5.3% compared to 2023
- Air moved $56.1 billion of freight, down 1.7% compared to 2023
- Vessel and pipeline freight decreased due to the lower dollar value of mineral fuels
Figure 2. Value of U.S. Trade with Canada and Mexico by Mode (USD): 2019 – 2024
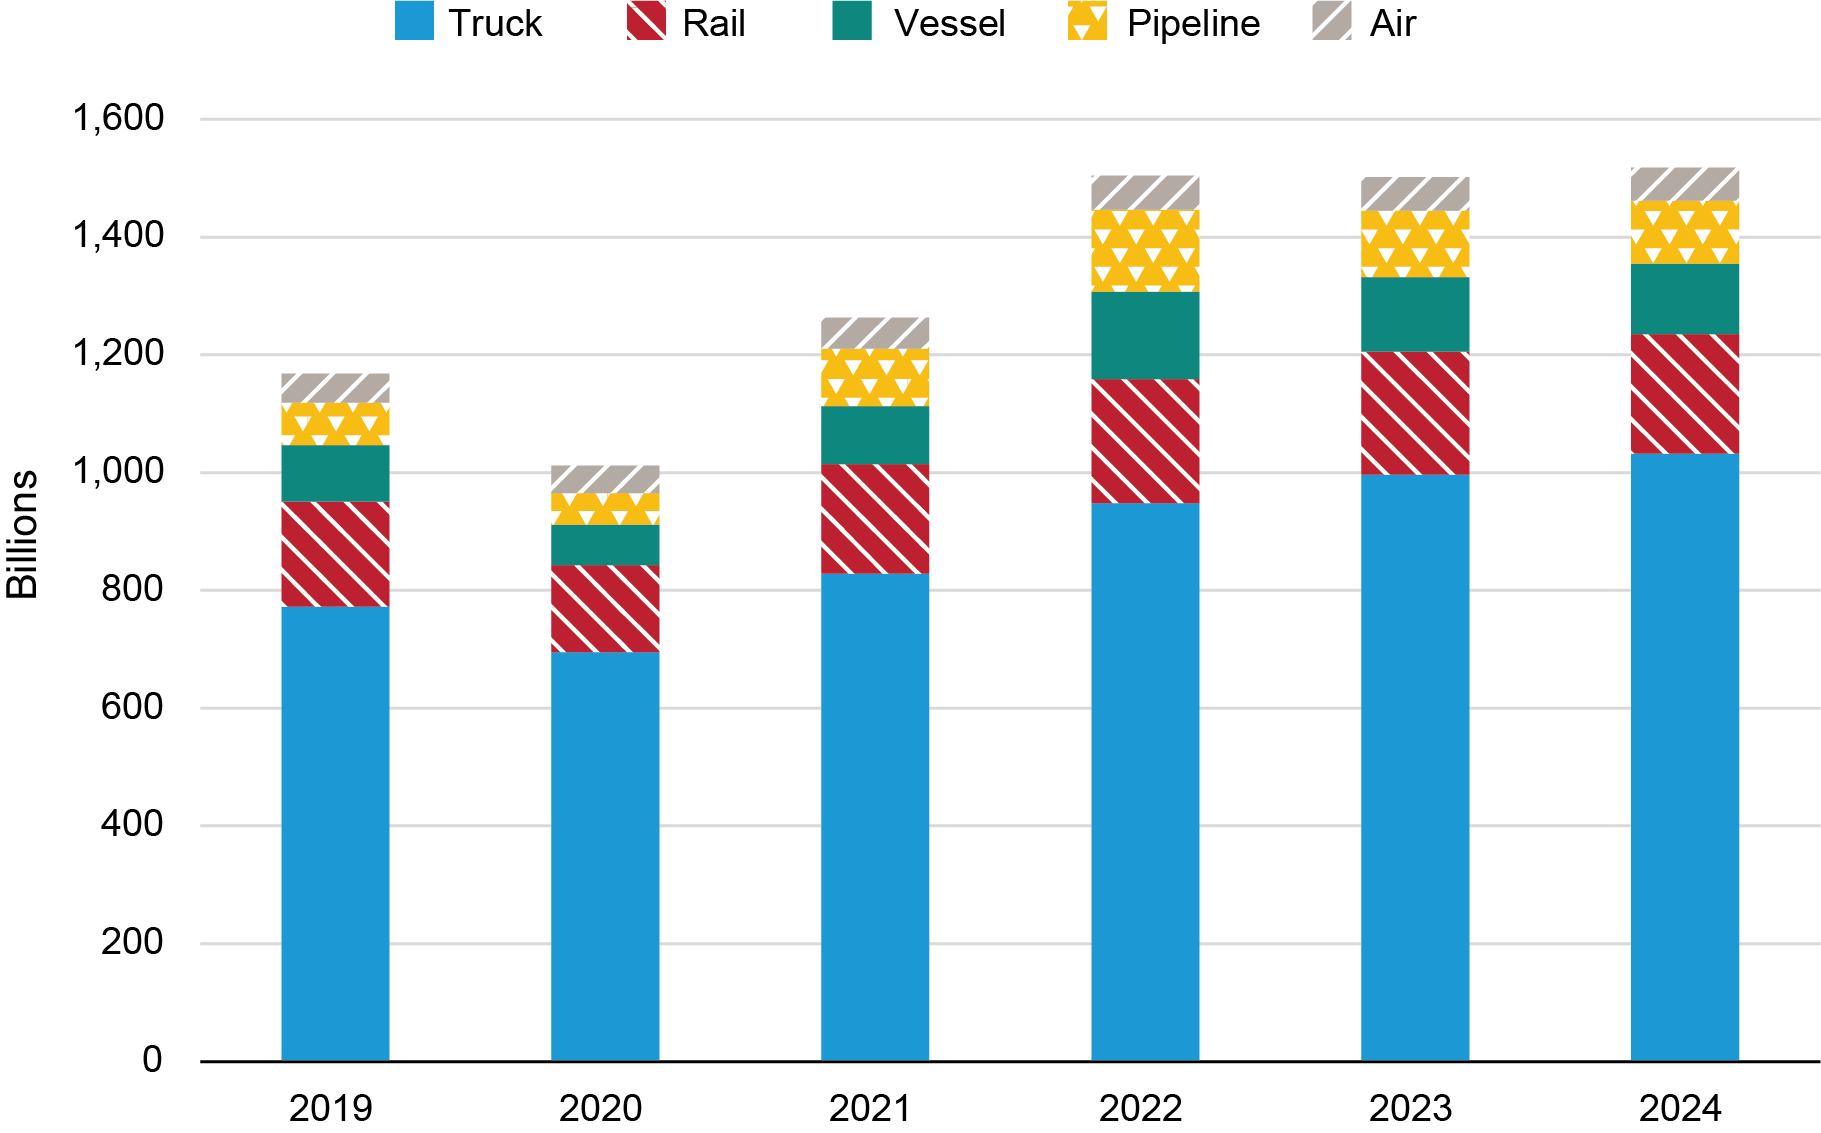
Source: Bureau of Transportation Statistics, Transborder Freight Data, available at https://data.bts.gov/stories/s/kijm-95mr
Table 3a: U.S.-Canada Freight by Truck: 2024
| Top 10 Ports | % Export | % Import | % of Total | Value ($M) | YOY Change |
| Detroit - Michigan | 57.2 | 42.8 | 27.0% | 114,145,716,114 | -10.1% |
| Port Huron - Michigan | 50.4 | 49.6 | 18.6% | 78,473,543,263 | 10.0% |
| Buffalo-Niagara Falls - New York | 54.5 | 45.5 | 17.1% | 72,330,312,875 | -2.7% |
| Pembina - North Dakota | 59.5 | 40.5 | 5.7% | 24,103,142,985 | -4.3% |
| Champlain-Rouses Point - New York | 42.1 | 57.9 | 5.3% | 22,284,678,573 | -4.1% |
| Blaine - Washington | 56.2 | 43.8 | 4.7% | 19,961,713,363 | -4.9% |
| Alexandria Bay - New York | 44.3 | 55.7 | 4.2% | 17,572,613,174 | -9.8% |
| Sweetgrass - Montana | 48.7 | 51.3 | 3.6% | 15,108,167,202 | -4.5% |
| Portal - North Dakota | 67.8 | 32.2 | 3.1% | 13,256,177,004 | 5.5% |
| Low-Valued Imports And Exports | 100.0 | 0.0 | 1.5% | 6,405,757,736 | -21.9% |
| Top 10 Truck Commodities | % Export | % Import | % of Total | Value ($M) | YOY Change |
| Computer-Related Machinery and Parts | 62.7 | 37.3 | 16.5% | 69,813,320,144 | -3.9% |
| Vehicles Other than Railway | 52.3 | 47.7 | 13.9% | 58,845,733,823 | -9.7% |
| Electrical Machinery; Equipment and Parts | 69.7 | 30.3 | 7.1% | 29,965,652,066 | 1.3% |
| Plastics and Articles | 51.3 | 48.7 | 4.9% | 20,705,094,881 | 0.2% |
| Special Classification Provisions | 33.7 | 66.3 | 4.7% | 19,967,674,729 | -11.8% |
| Pearls; Stones; Metals and Imitation Jewelry | 47.1 | 52.9 | 3.1% | 13,117,650,694 | -13.0% |
| Pharmaceutical Products | 54.1 | 45.9 | 2.6% | 10,967,114,379 | 5.1% |
| Paper and Paperboard | 46.0 | 54.0 | 2.5% | 10,487,675,978 | 3.6% |
| Articles of Iron and Steel | 49.7 | 50.3 | 2.3% | 9,932,998,781 | -9.0% |
| Preparations of Cereals and Flour | 31.1 | 68.9 | 2.3% | 9,801,430,480 | 4.5% |
Source: Bureau of Transportation Statistics, Transborder Freight Data, available at https://data.bts.gov/stories/s/kijm-95mr
Table 3b: U.S.-Mexico Freight by Truck: 2024
| Top 10 Ports | % Export | % Import | % of Total | Value ($M) | YOY Change |
| Laredo - Texas | 38.1 | 61.9 | 46.3% | 281,973,460,240 | 8.2% |
| Ysleta Port of Entry | 34.8 | 65.2 | 13.7% | 83,383,147,095 | 13.6% |
| Otay Mesa - California | 38.7 | 61.3 | 10.0% | 60,938,705,561 | 2.8% |
| Hidalgo - Texas | 30.9 | 69.1 | 7.0% | 42,579,251,859 | 1.5% |
| Santa Teresa - New Mexico | 41.4 | 58.6 | 6.4% | 38,809,651,186 | 44.9% |
| Nogales - Arizona | 35.7 | 64.3 | 4.1% | 25,040,661,426 | 10.2% |
| Calexico-East - California | 39.5 | 60.5 | 3.6% | 21,899,361,724 | 1.6% |
| Brownsville - Texas | 49.3 | 50.7 | 2.6% | 15,988,979,267 | -10.3% |
| Eagle Pass - Texas | 45.1 | 54.9 | 1.8% | 10,999,497,676 | 6.2% |
| El Paso - Texas | 78.6 | 21.4 | 1.7% | 10,394,584,344 | 2.0% |
| Top 10 Truck Commodities | % Export | % Import | % of Total | Value ($M) | YOY Change |
| Computer-Related Machinery and Parts | 32.4 | 67.6 | 23.7% | 144,166,007,146 | 29.3% |
| Electrical Machinery; Equipment and Parts | 38.4 | 61.6 | 21.9% | 133,308,402,511 | 5.8% |
| Vehicles Other than Railway | 23.9 | 76.1 | 14.0% | 85,179,576,388 | 2.3% |
| Measuring and Testing Instruments | 32.7 | 67.3 | 5.2% | 31,646,775,140 | 5.6% |
| Plastics and Articles | 71.9 | 28.1 | 4.2% | 25,361,799,700 | 2.4% |
| Furniture; Lamps and Prefabricated Buildings | 12.3 | 87.7 | 2.3% | 14,167,231,799 | -4.2% |
| Articles of Iron and Steel | 54.4 | 45.6 | 2.3% | 13,942,522,542 | 1.7% |
| Edible Fruit and Nuts | 11.1 | 88.9 | 2.0% | 12,008,970,897 | 4.0% |
| Edible Vegetables and Roots | 5.5 | 94.5 | 1.7% | 10,464,870,133 | 8.6% |
| Special Classification Provisions | 2.7 | 97.3 | 1.2% | 7,575,082,676 | 16.7% |
Source: Bureau of Transportation Statistics, Transborder Freight Data, available at https://data.bts.gov/stories/s/kijm-95mr
U.S.-Canada Data Points
- Detroit, Port Huron, and Buffalo are the top truck ports for U.S. freight flows with Canada
- Detroit, Port Huron, and International Falls are the top rail connection ports for U.S. freight flows with Canada
- Chicago, Port Huron, and Minneapolis are the top pipeline connection regions for U.S. energy freight flows with Canada
- Port of Boston, Arthur, and Portland are the top water port connections for U.S. energy flows with Canada
U.S.-Mexico Data Points
- Laredo, Ysleta, and Otay Mesa are the top truck ports with Mexico
- Laredo, Eagle Pass, and El Paso are the top rail connection ports with Mexico
- El Paso, Hidalgo, and Laredo are the top pipeline connection regions with Mexico
- Port of Houston, Arthur, and Texas City are the top water port connections for U.S. energy flows on the Southern border
- Energy flows by vessel with Mexico are more expansive than pipeline flows with Canada
Since earlier than 2006, U.S. freight flows with Canada by value had commonly exceeded that with Mexico. However, starting in 2015, there have been several instances where U.S. freight with Mexico by value has surpassed that of Canada. This trend first appeared in October 2015 and has continued and extended through the COVID-19 pandemic. Interestingly, during this same period, the weight of freight flows with Canada has continued to exceed that of Mexico. U.S. freight flows with Canada by weight continue to be greater than Mexico due to petroleum and mineral fuels transported by pipeline. In 2024, the dollar value of mineral fuel flows with Canada and Mexico decreased 6.6% from 2023.
Figure 3. Value of U.S. Freight with Canada and Mexico (USD): 2010 - 2024
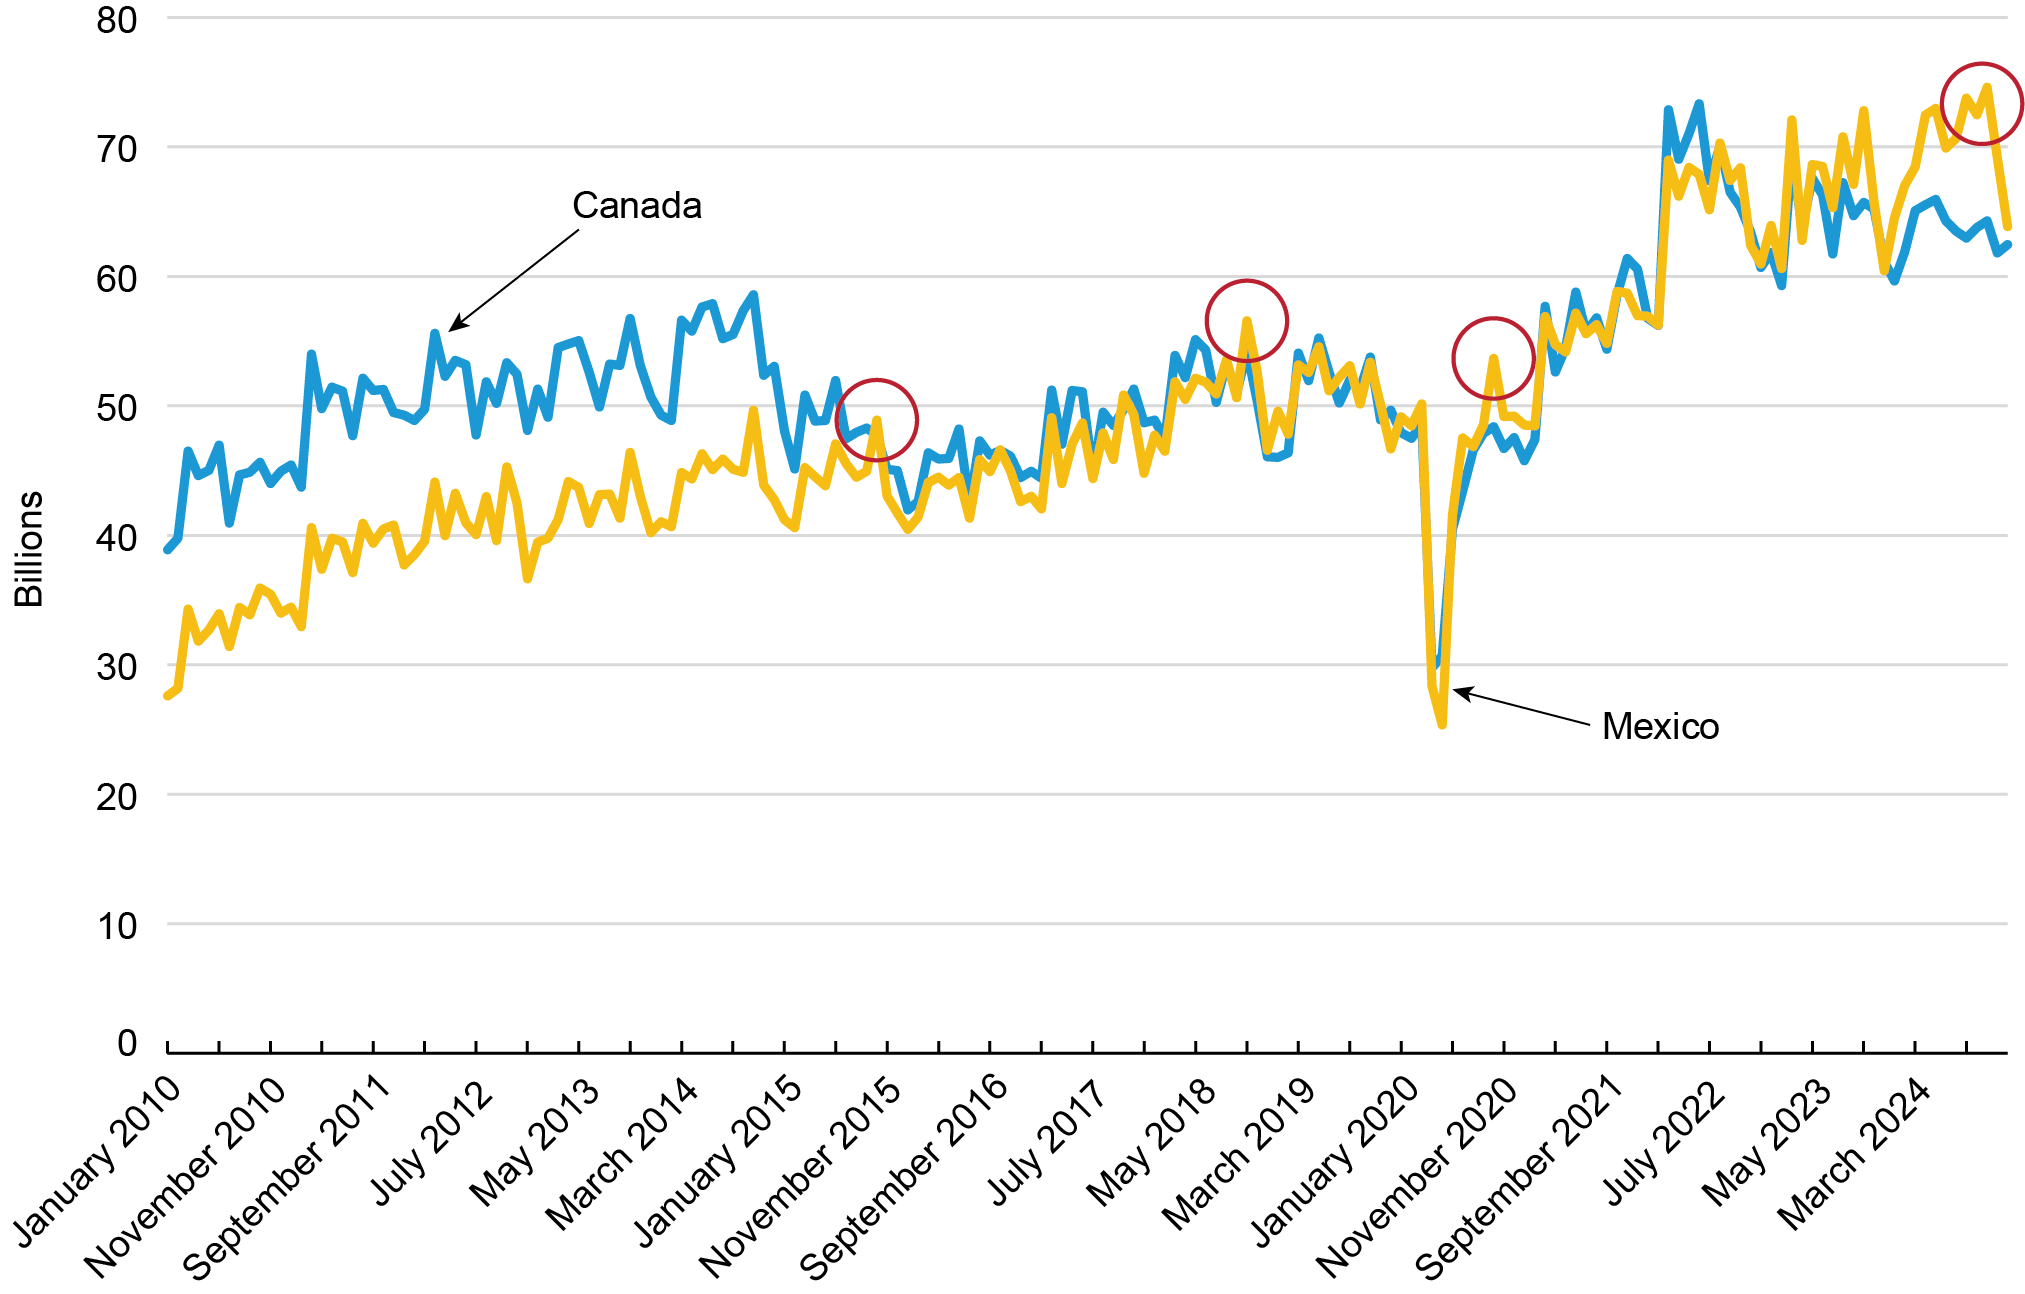
Source: Bureau of Transportation Statistics, Transborder Freight Data, available at https://data.bts.gov/stories/s/kijm-95mr
Since the pandemic in 2020, truck freight has grown faster than rail freight for U.S. trade with Canada and Mexico combined. In 2024, trucks shipped $1.0 trillion worth of goods from and to Canada and Mexico, while rail accounted for $ 203.1 billion. From 2023 to 2024, the value of truck freight increased by 3.6% while rail decreased by 2.9 percent.
Figure 4. Value of U.S. Freight by Truck and Rail with Canada and Mexico (USD): 2014 -2024
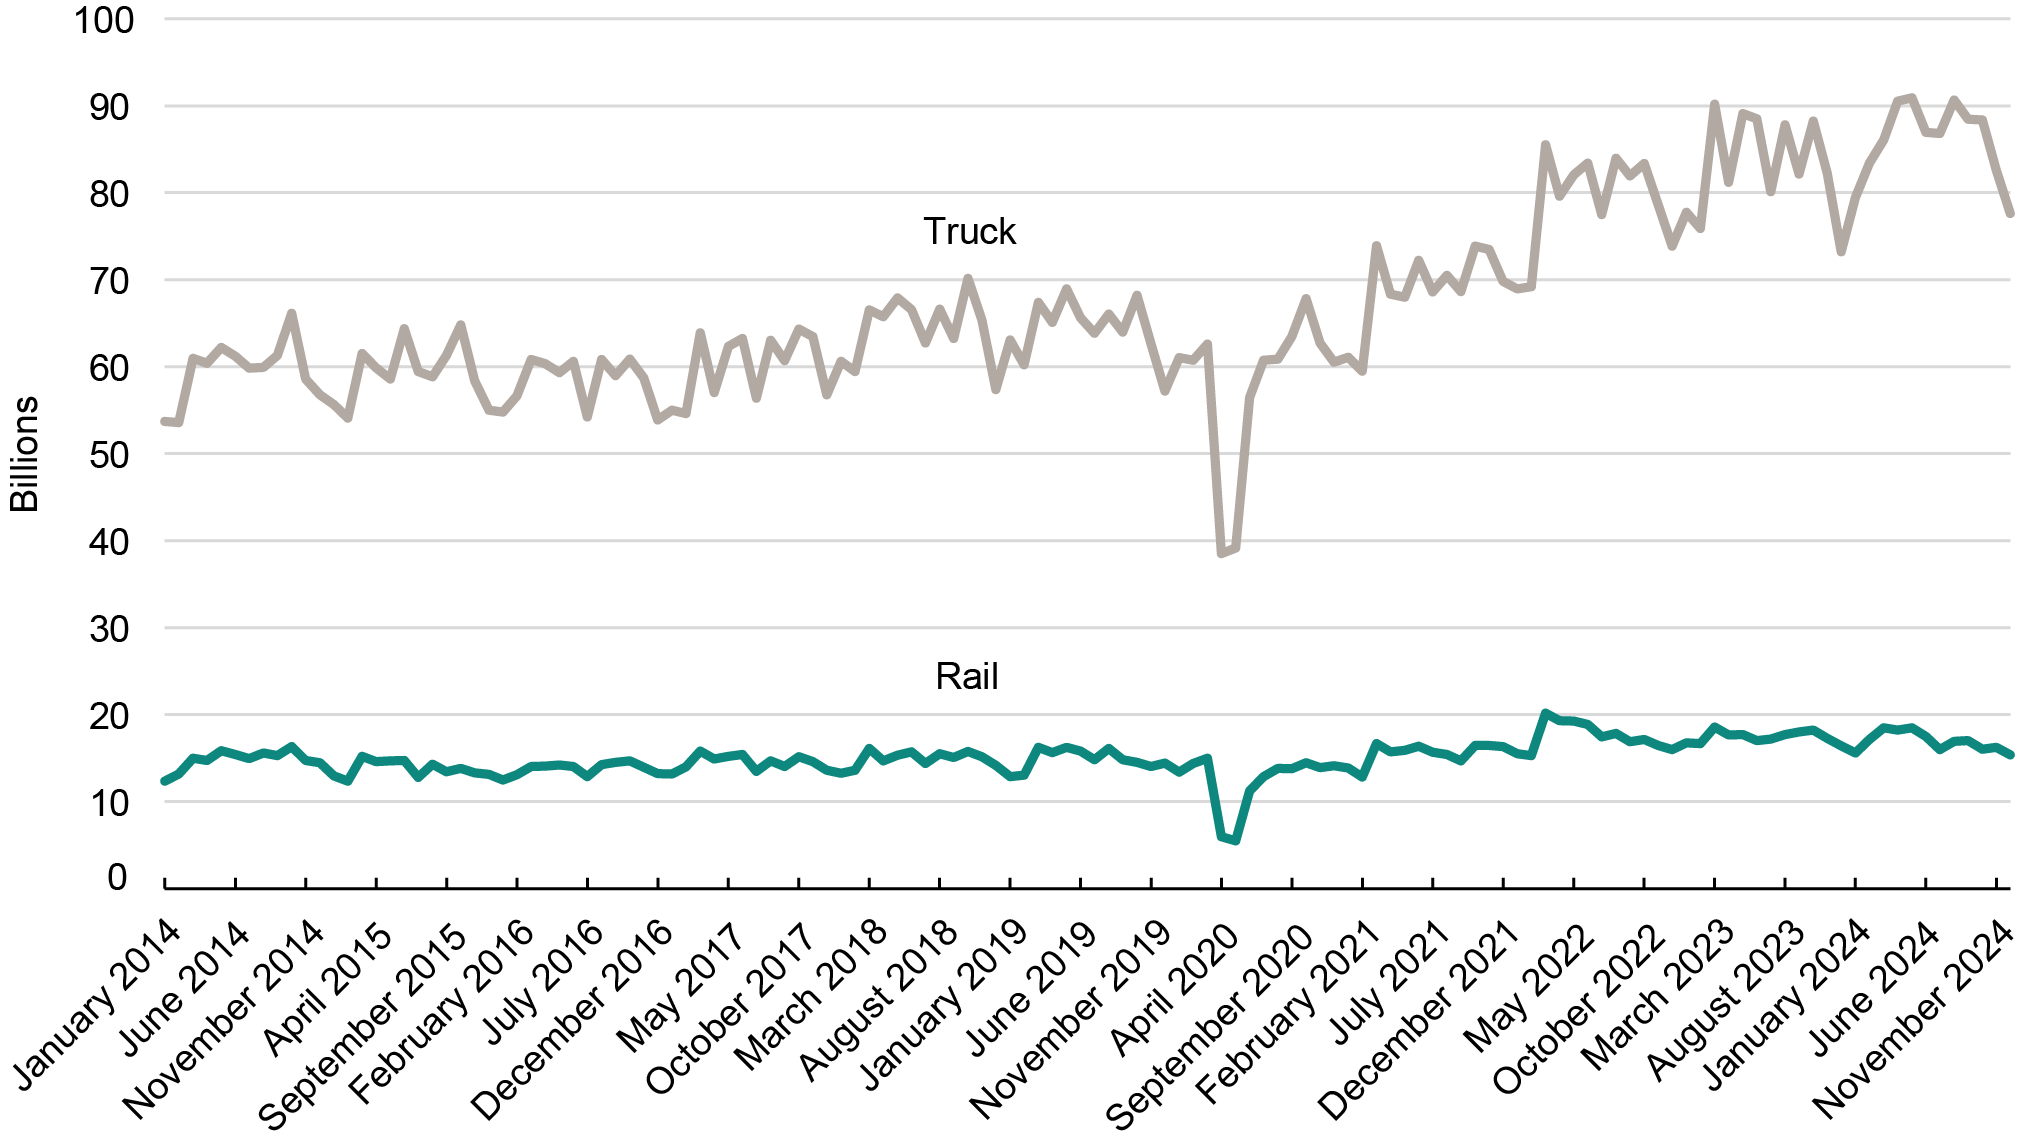
Source: Bureau of Transportation Statistics, Transborder Freight Data, available at https://data.bts.gov/stories/s/kijm-95mr
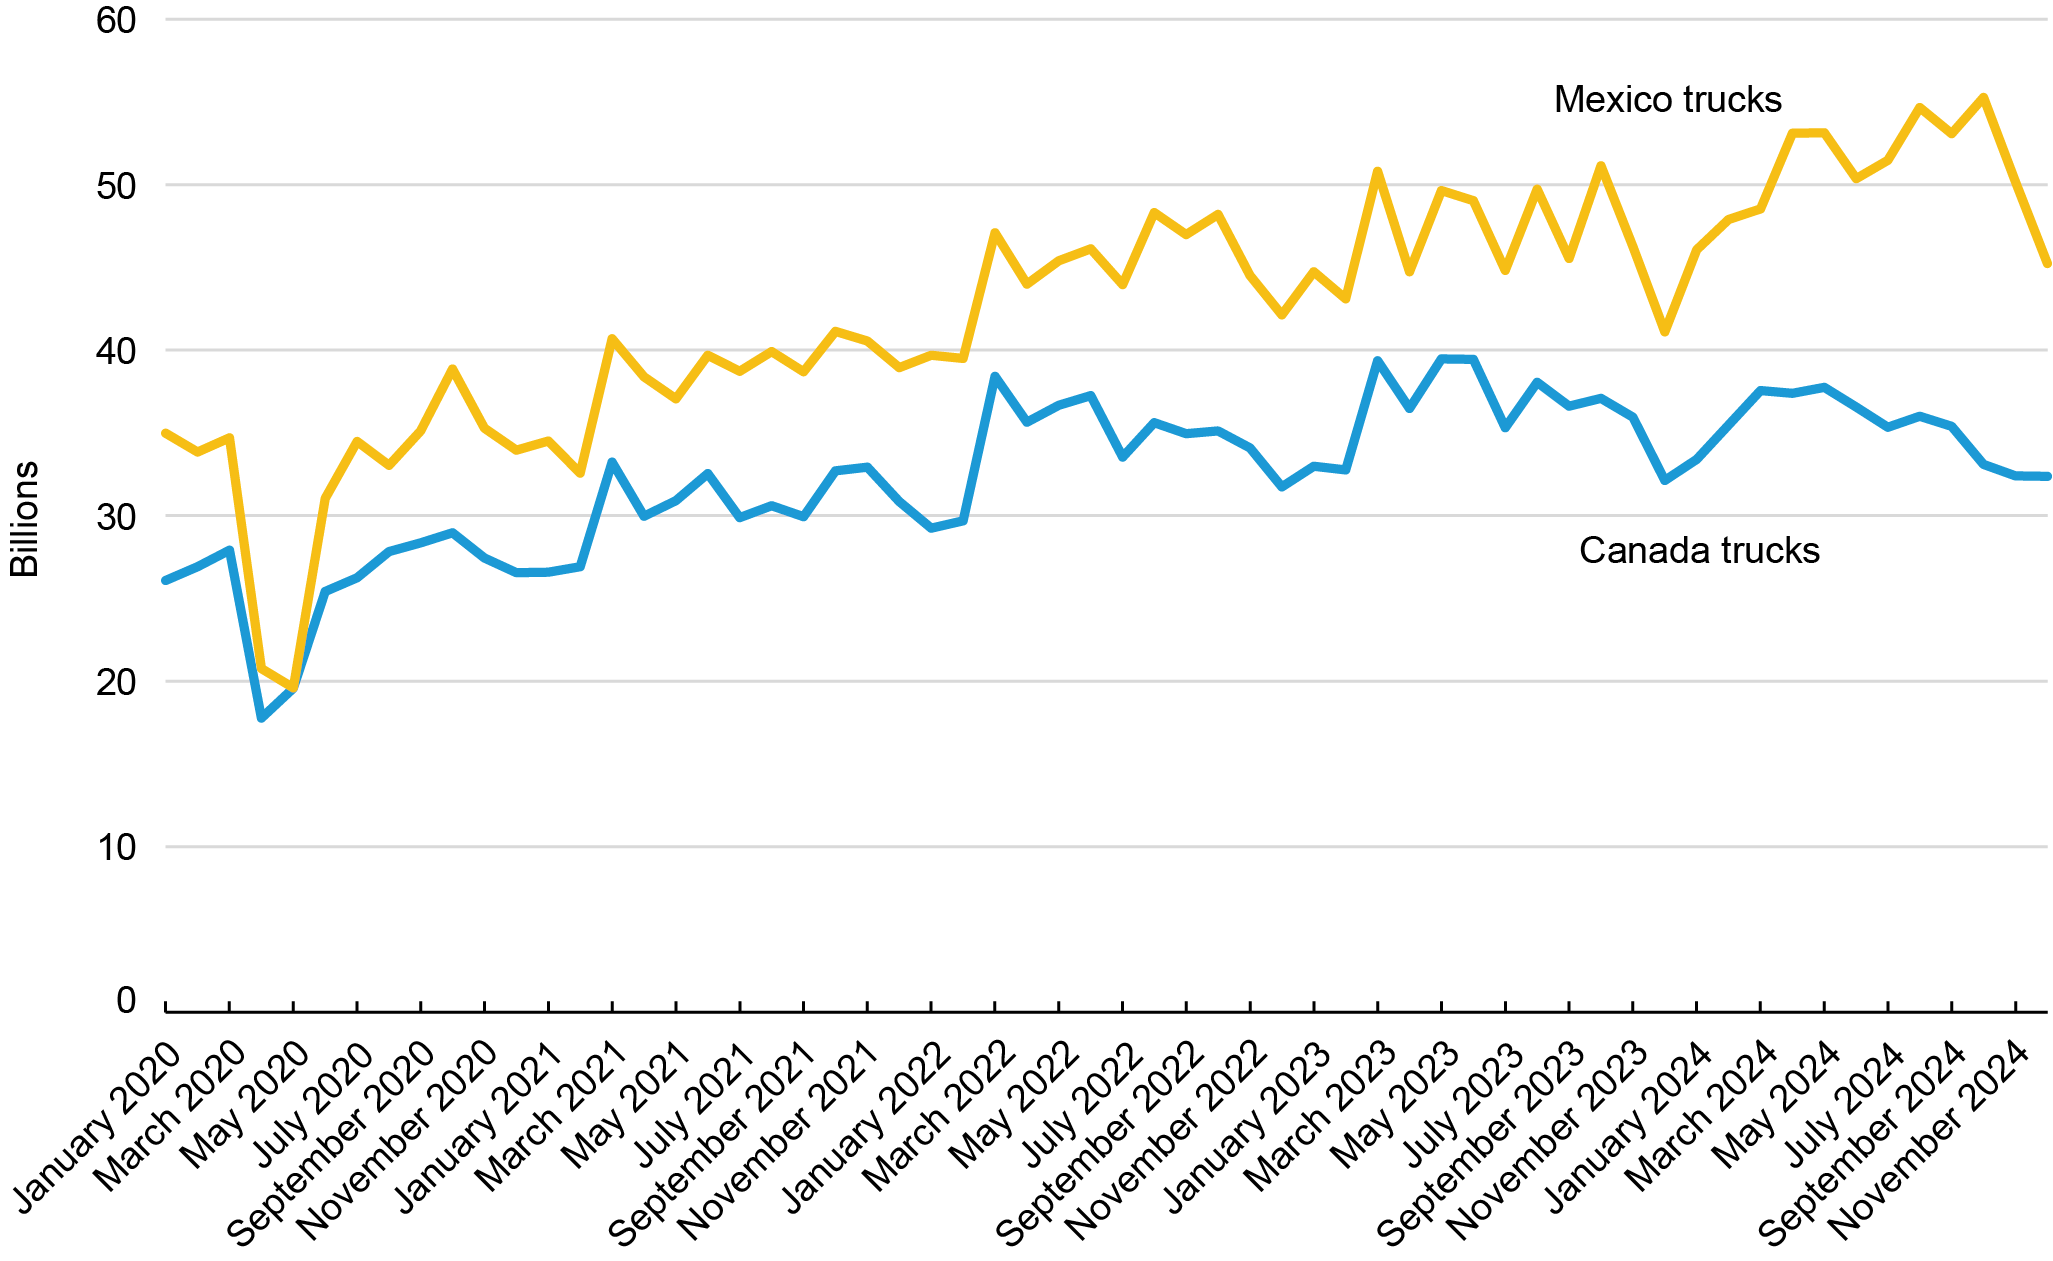
Zooming in further, the total value of freight shipments by truck with Canada and Mexico reveals another emerging long-term trend. U.S. freight transportation by truck with Mexico has been increasing at a faster pace than Canada since 2020. From the pandemic lows in April 2020 to December 2024, freight by truck with Canada has increased from $17.8 billion to $32.4 billion while freight by truck with Mexico has grown from $20.8 billion to $45.2 billion.
Figure 5. Value of U.S. Freight by Truck with Canada and Mexico (USD): 2020 - 2024
Source: Bureau of Transportation Statistics, Transborder Freight Data, available at https://data.bts.gov/stories/s/kijm-95mr
To receive updates from BTS directly to your email, please consider subscribing to our GovDelivery service.
|
You are subscribed to email updates from the USDOT Bureau of Transportation Statistics. Subscriber Services: Manage Preferences |
|
||||||||||||