Transportation Cost Burden Falls Significantly for Second-Lowest, but No Other, Income Group
U.S. Department of Transportation sent this bulletin at 12/06/2024 02:58 PM EST |
|
Having trouble viewing this email? View it as a Web page. |
Transportation Cost Burden Falls Significantly for Second-Lowest, but No Other, Income Group
In 2023, U.S. households paid on average $13,174 for transportation, making it the second-largest per annum household expenditure after housing.1 As in previous years, households in the lowest income group spent the least on transportation in 2023 ($4,917), although they spent proportionately more of their before-tax income (32%) on transportation compared to higher income groups (figure 1).
Transportation cost burden is the share of before-tax income spent on transportation. Only the second-lowest income group experienced a statistically significant change in their transportation cost burden in 2023, seeing it fall to 19% from 22% in 2022.2 This decline resulted from a 9% increase in before-tax income and a 4% decline in total annual transportation spending, which was due to a drop in expenditures on new and used vehicles.3 Because households purchase vehicles infrequently, vehicle purchase data tend to be volatile. This volatility may explain the observed decline in expenditures on new and used vehicles by the second-lowest income quintile in 2023. Excluding vehicle purchases, the second-lowest income quintile’s transportation cost burden fell marginally (1 percentage point).
While households in the second-lowest income group spent less on new and used vehicles in 2023 than in 2022, all other income groups spent more (figure 2). Further, in 2023, annual household spending on vehicles was the primary driver of increases in total transportation spending by the middle, second-highest, and highest income groups (figure 2). Reduced spending on fuel, motor oil, and vehicle operation offset increased vehicle purchases by the lowest income quintile, resulting in a marginal but not statistically significant decline in transportation spending by this group in 2023 (figure 2).
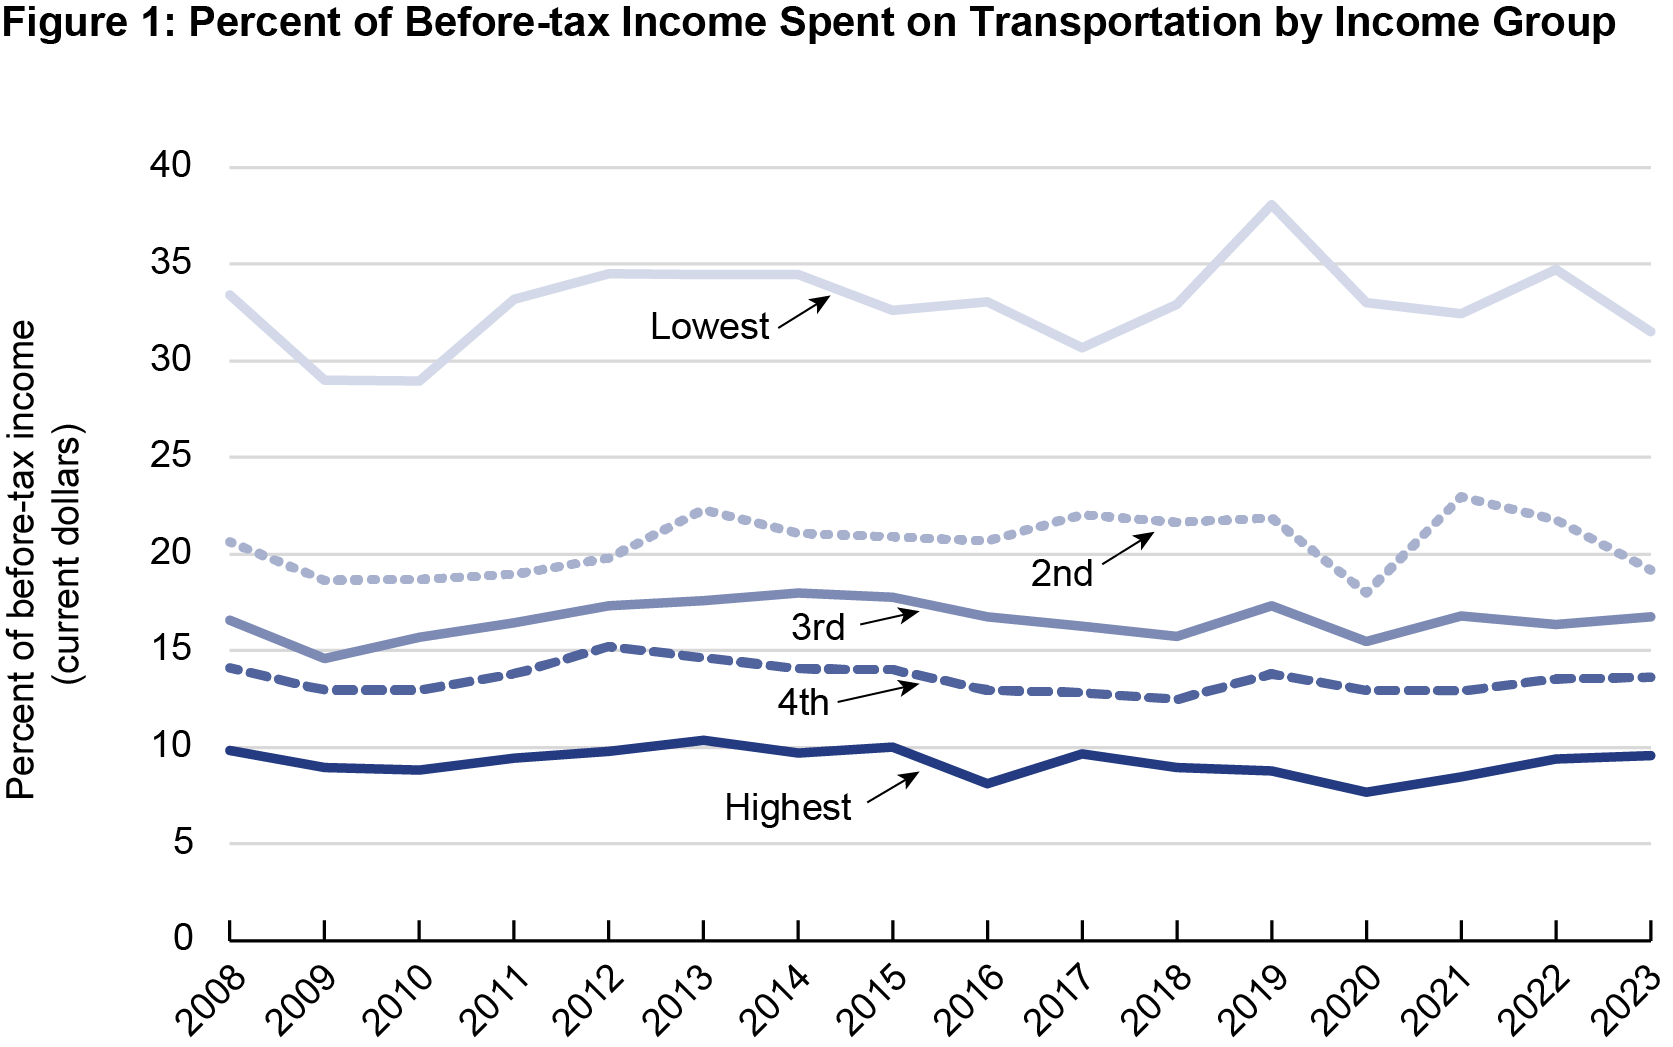
NOTE: Income groups are before-tax income quintiles. Quintiles divide total consumer units into approximately the same size groups.
SOURCE: Calculations by U.S. Department of Transportation, Bureau of Transportation Statistics, from U.S. Department of Labor, Bureau of Labor Statistics, Consumer Expenditure Survey calendar year means, available at www.bls.gov/cex as of November 2024.
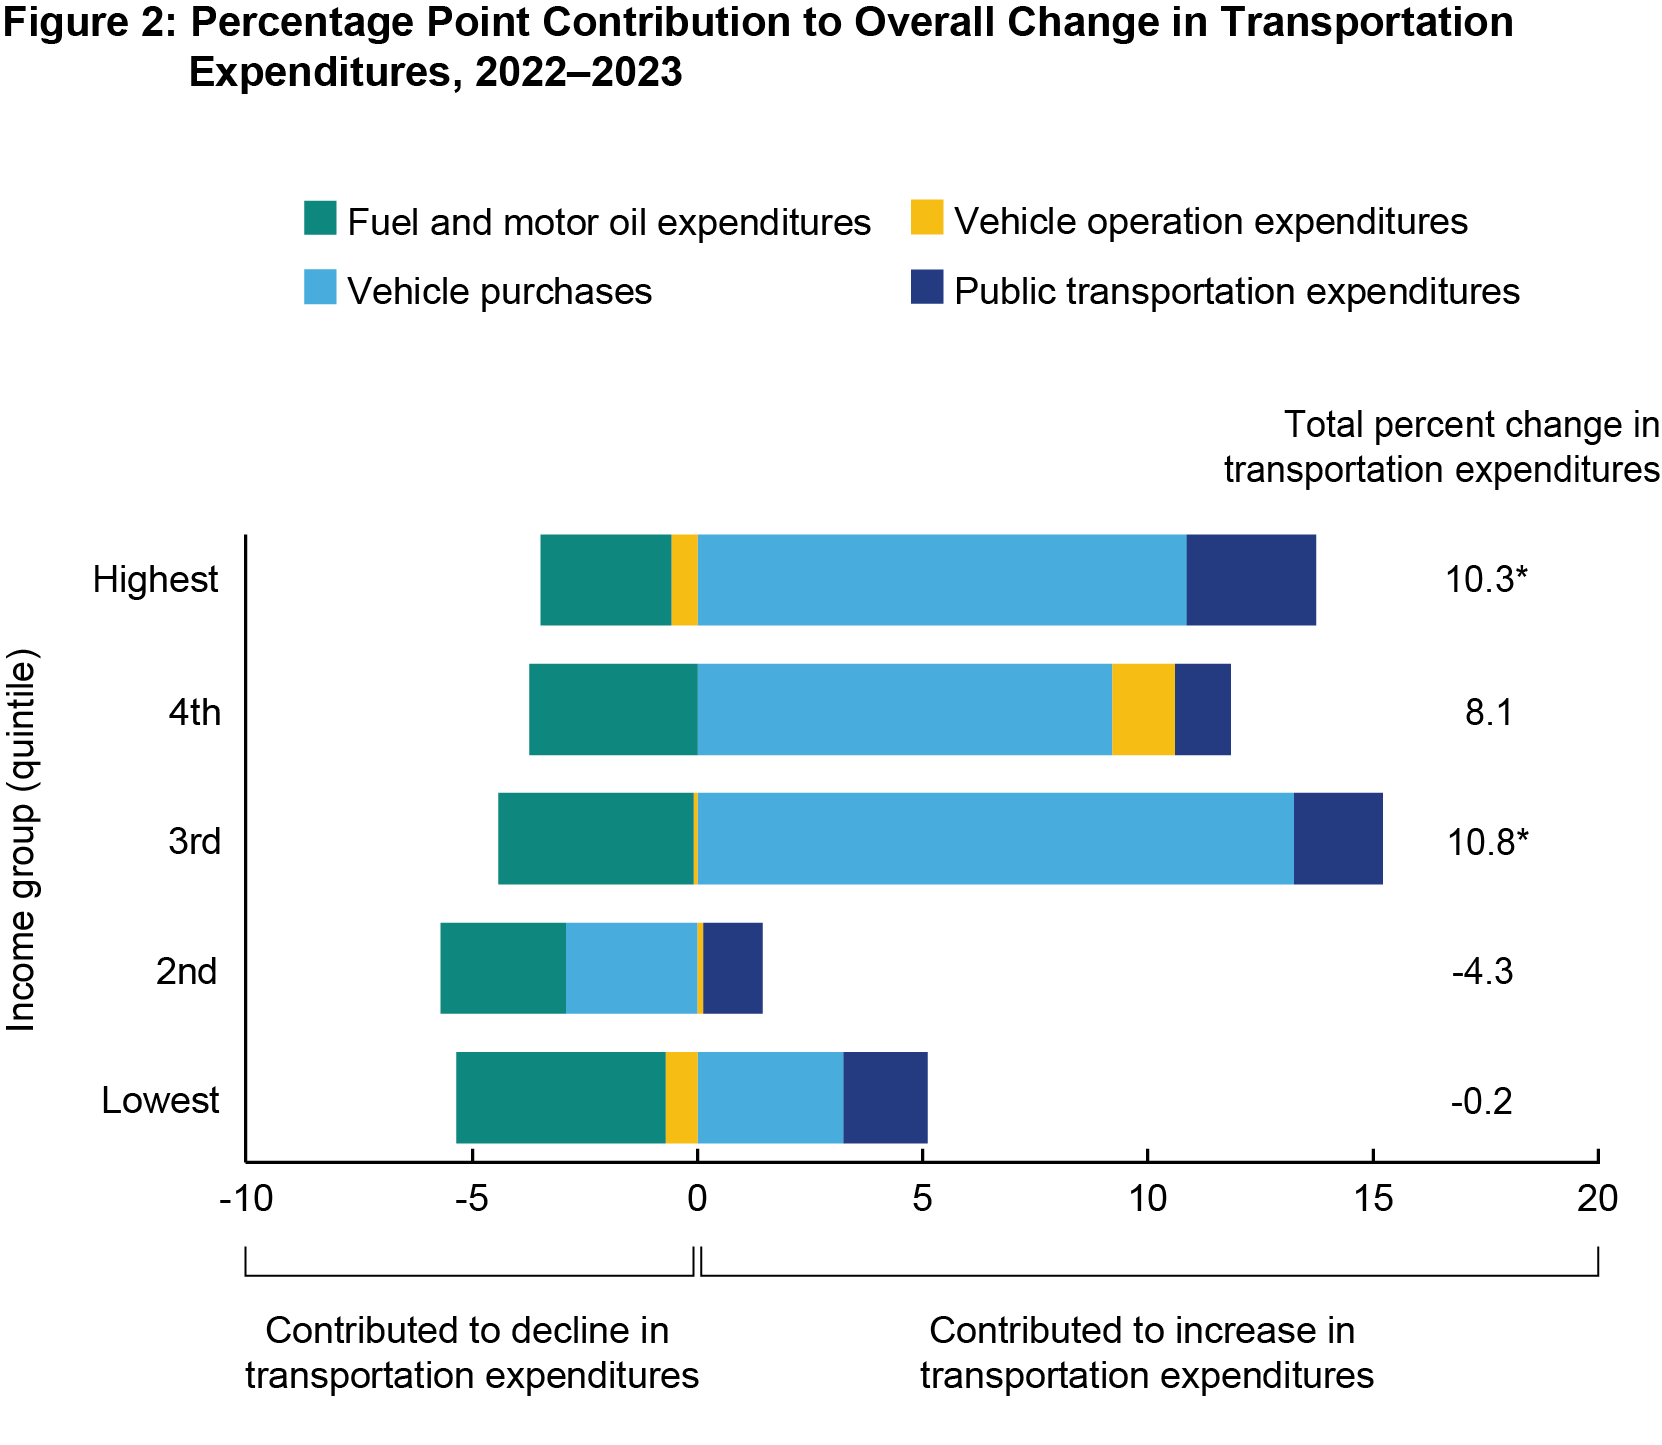
* = statistically significant change at p<0.1
NOTE: Data are in current dollars; percent change calculated from current dollars. Figure draws data from the calendar year means tables. The data values may differ from those in other Bureau of Transportation Statistics publications that draw from the public use microdata, in which data suppression may prevent the value from equaling the value in the calendar year means tables.
SOURCE: Calculations by U.S. Department of Transportation, Bureau of Transportation Statistics from U.S. Department of Labor, Bureau of Labor Statistics, Consumer Expenditure Survey calendar year means, available at www.bls.gov/cex as of November 2024.
Higher income households generally spend more on transportation as these groups usually have both more members and more vehicles per member. For example, in 2023, there was, on average, 1.6 persons and 1.0 vehicles per household in the lowest income quintile, compared to 3.2 and 2.6 in the highest income quintile4. Per vehicle, the lowest spent about $200 less on fuel compared to the highest income group ($1,324 versus $1,514 respectively) and about $450 less per vehicle on financing, insurance, and repairs ($1,411 versus $1,863) in 2023 (figure 4). Per person, higher income groups spent more on transportation overall than all other income groups, due to higher income groups spending more on vehicle purchases (figure 3). The lowest income group spent $985 per person (32% of all transportation expenditures) on new and used vehicles, whereas the highest income group spent $3,817 per person (48% of all transportation expenditures) in 2023 (figures 3 and 5). Across all income quintiles, vehicle purchases and vehicle operation expenses accounted for roughly 90% of all transportation expenditures.
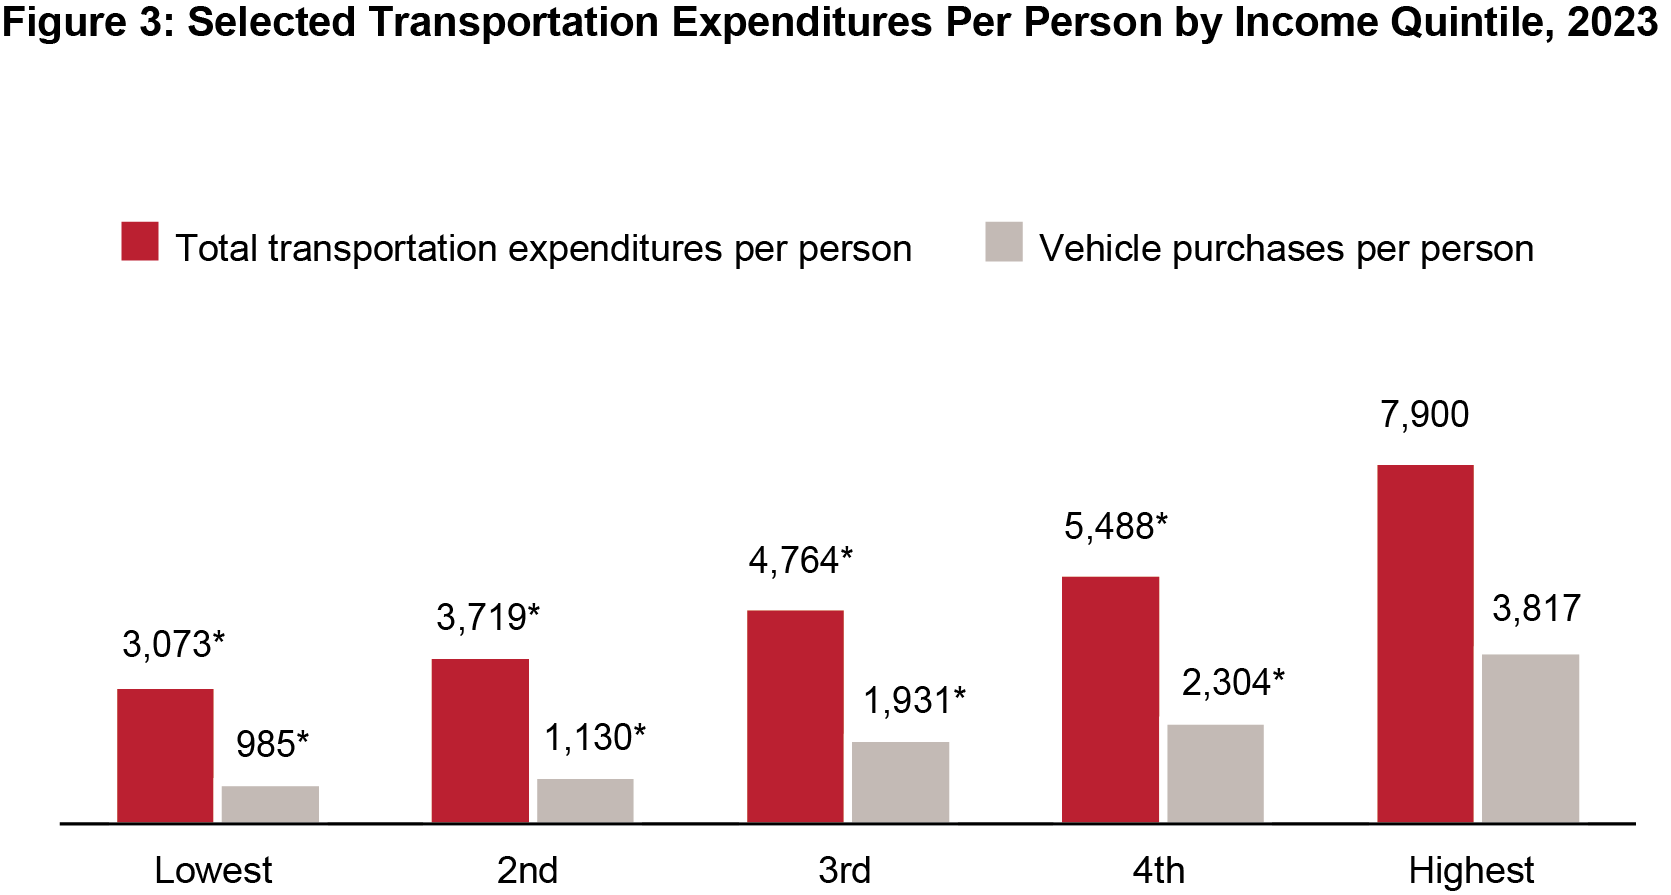
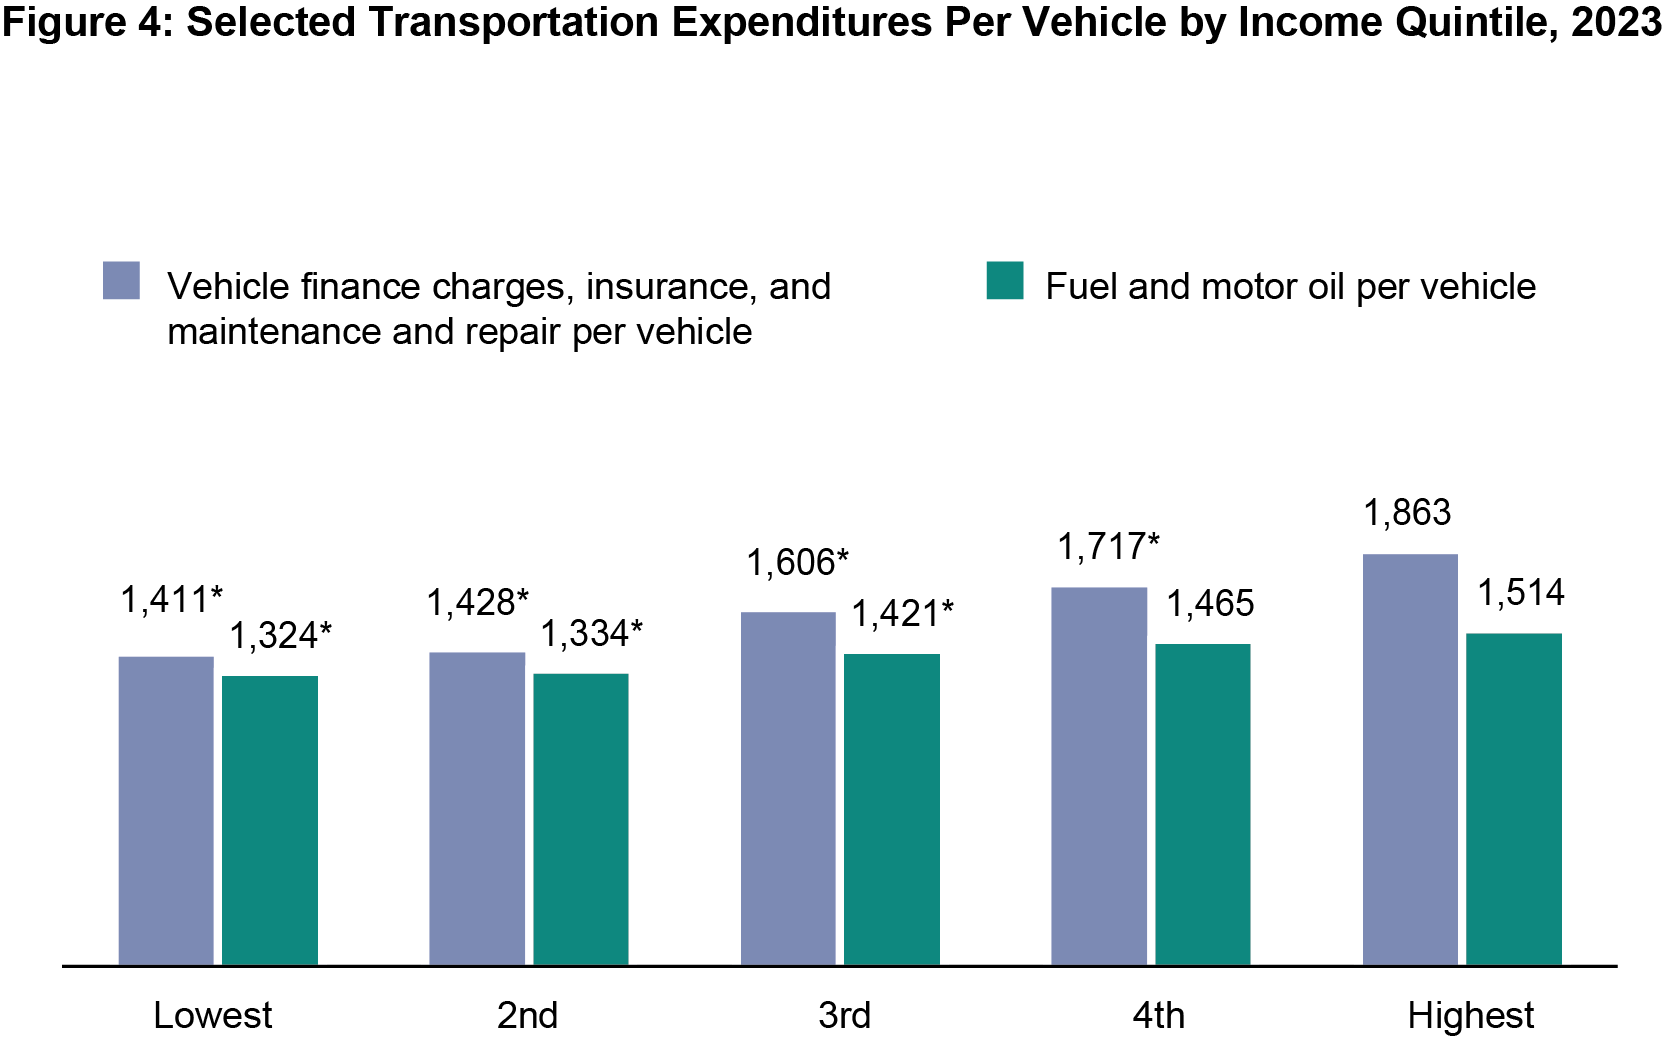
* = statistically different from highest income group at p<0.1
NOTES: Figures 3 and 4 draw data from the calendar year means tables. The data values may differ from those in other Bureau of Transportation Statistics publications that draw from the public use microdata, in which data suppression may prevent the value from equaling the value in the calendar year means tables.
SOURCE: Calculations by U.S. Department of Transportation, Bureau of Transportation Statistics from U.S. Department of Labor, Bureau of Labor Statistics, Consumer Expenditure Survey calendar year means, available at www.bls.gov/cex as of November 2024.
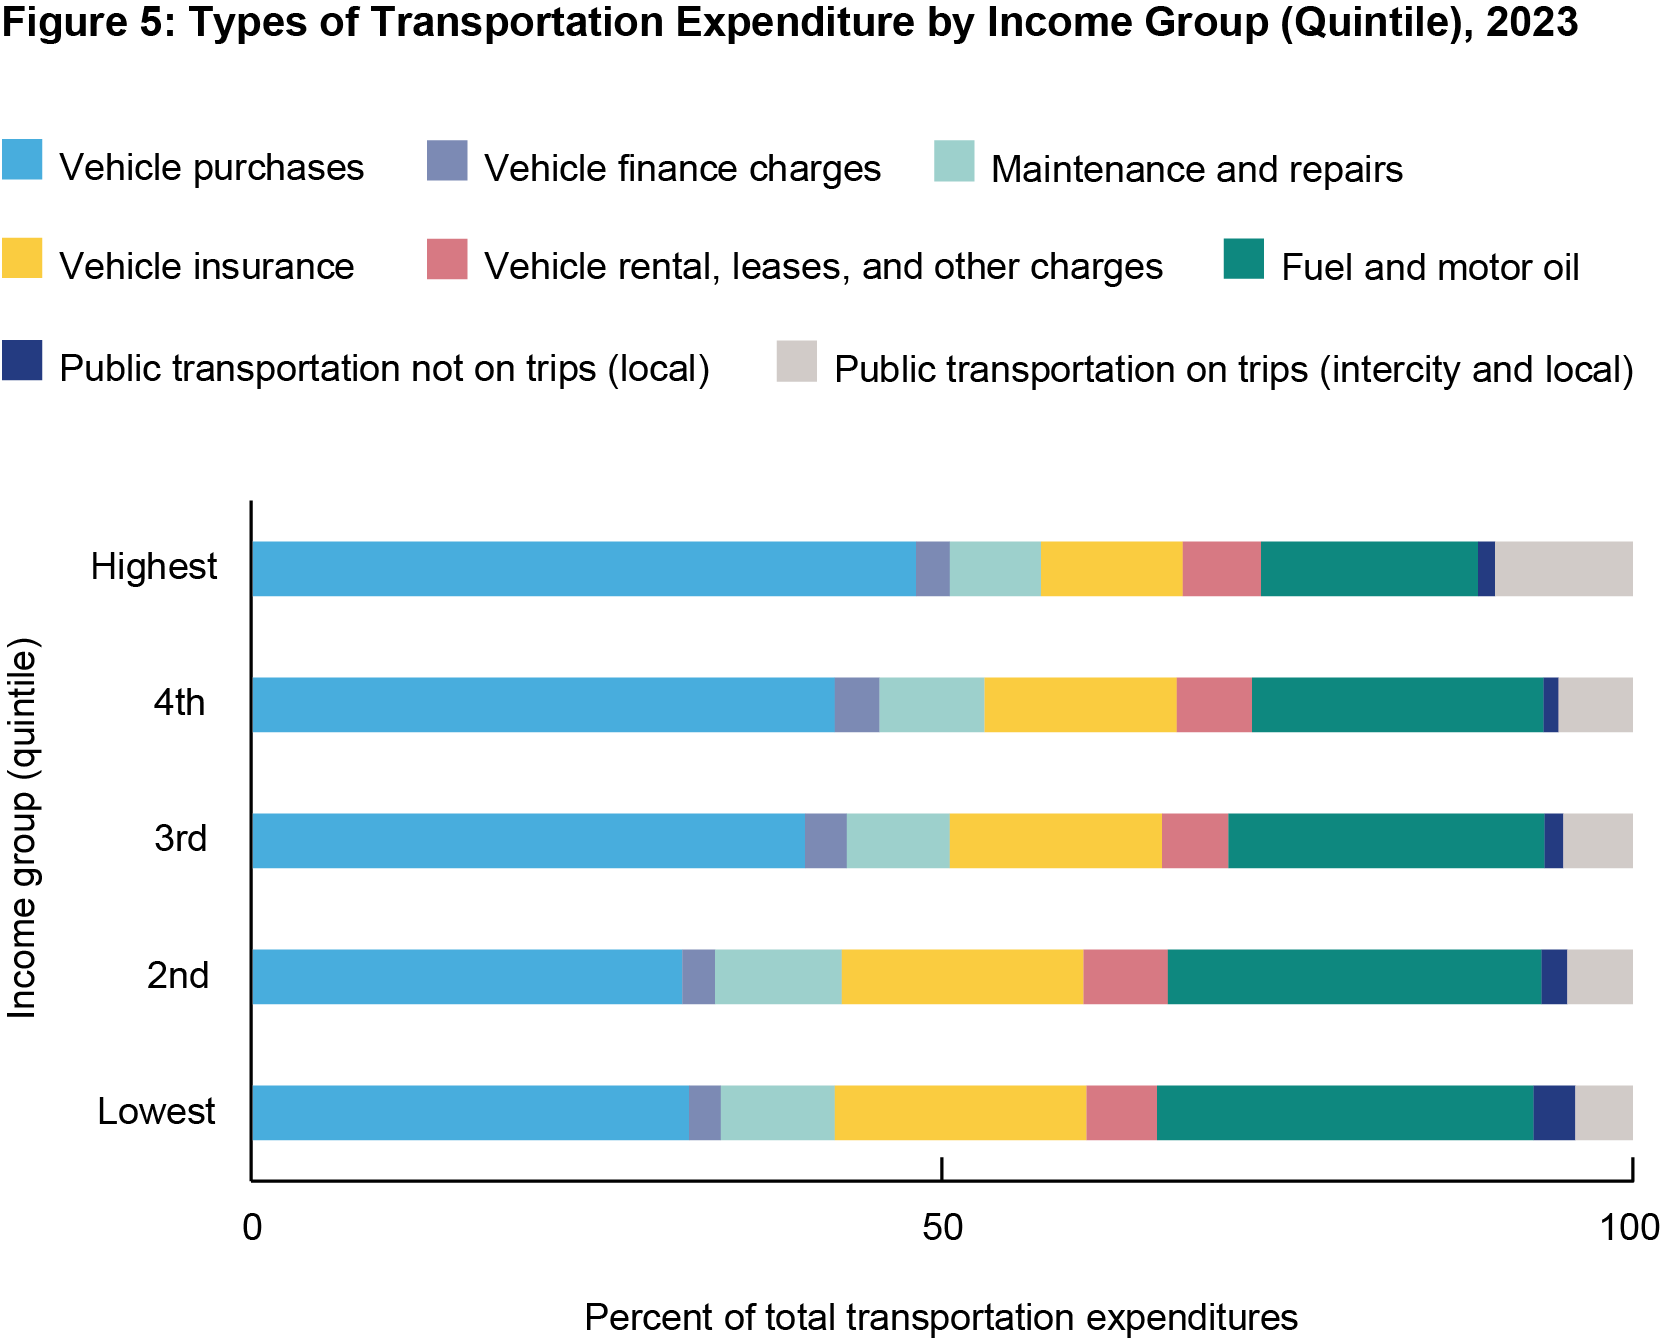
SOURCE: Calculations by U.S. Department of Transportation, Bureau of Transportation Statistics, from U.S. Department of Labor, Bureau of Labor Statistics, Consumer Expenditure Survey microdata, available at www.bls.gov/cex as of November 2024.
Differences in the composition of households across income quintiles also explain the variation in transportation spending. For example, in 2023, about 40% of households in the lowest income quintile consisted only of a head-of-household retired from work, with no other earners (figure 6). Further, within this quintile, households with no earners and a head-of-household not working due to disability, going to school, or for some other reason (not including retirement) accounted for 14%, 2%, and 4% of households, respectively. In total, households with no earners accounted for 61% of the lowest income quintile, while accounting for only 3% of all households in the highest income quintile, indicating a difference in spending capacity.
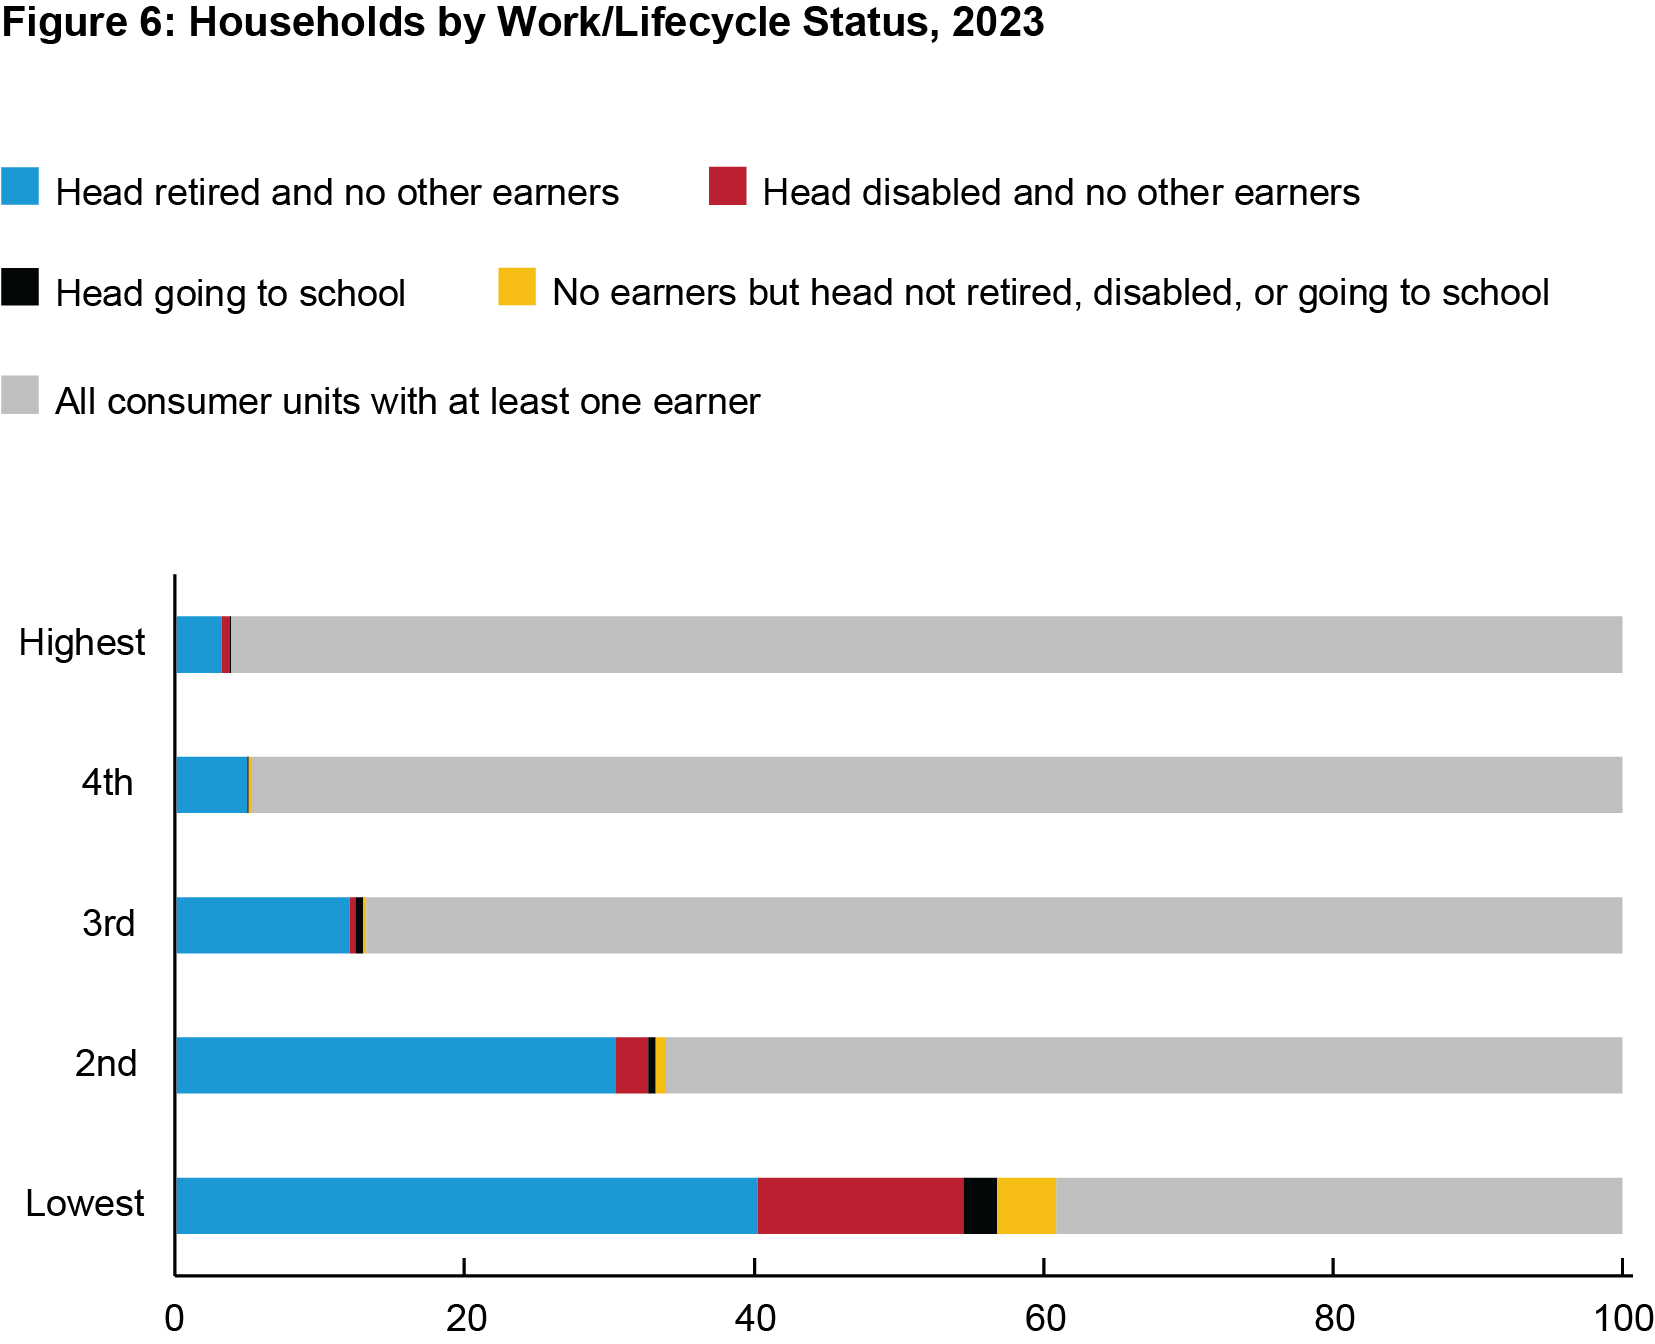
SOURCE: Calculations by U.S. Department of Transportation, Bureau of Transportation Statistics, from U.S. Department of Labor, Bureau of Labor Statistics, Consumer Expenditure Survey microdata, available at www.bls.gov/cex as of November 2024.
For more information, see Bureau of Transportation Statistics, website on transportation expenditures, income sources and household types, transportation spending by income quintile, by vehicles available, and by household characteristic. Data are from the Bureau of Labor Statistics’ (BLS’) Consumer Expenditure Survey (CE). The CE provides detailed, national level data on the amount different types of households spend, including, but not limited to, transportation.
1See U.S. Department of Transportation, Bureau of Transportation Statistics, “Average Household Transportation Expenditures: Consumer Expenditure Survey”, Transportation Economic Trends, available at https://data.bts.gov/stories/s/ida7-k95k as of November 2024.
Households are consumer units in the Consumer Expenditure Survey – the data source transportation expenditures. Consumer units consist of: all members of a particular housing unit related by blood, marriage, adoption, or some other legal arrangement, such as foster children; persons living alone or sharing a household with others, or living as a roomer in a private home, lodging house, or in permanent living quarters in a hotel or motel, but make independent financial decisions; and two or more unrelated persons living together who pool their income to make joint expenditure decisions.
2The lowest income group also experienced a decline in their before-tax transportation cost burden but it was not statistically significant at p < 0.1.
3See U.S. Department of Transportation, Bureau of Transportation Statistics, “Transportation Cost Burden: Overview of Household Spending on Transportation by Income Quintile,” Transportation Economic Trends, https://data.bts.gov/stories/s/Transportation-Cost-Burden/u3wt-eyhe as of November 2024.
4See U.S. Department of Transportation, Bureau of Transportation Statistics, “Transportation Cost Burden: Transportation Spending by Income Quintile and Vehicles Available” and “Transportation Cost Burden: Household Characteristics and Income Sources”, Transportation Economic Trends, available at https://data.bts.gov/stories/s/v67s-yiqd and https://data.bts.gov/stories/s/rkrk-b6ad, respectively, as of November 2024.
