
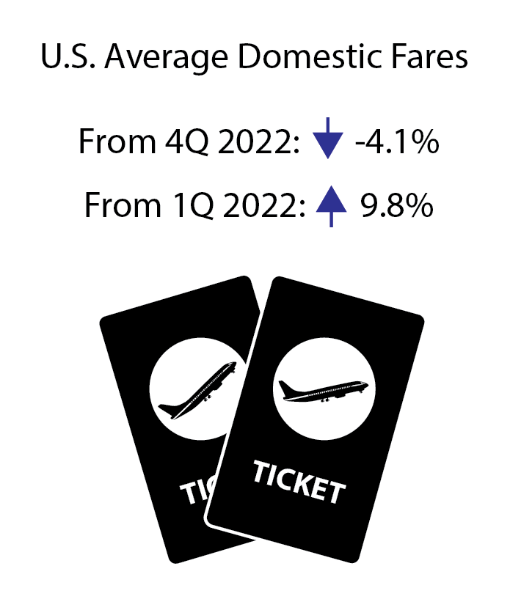
First Quarter 2023 Average Air Fare Decreases 4.1% from Fourth Quarter 2022
U.S. Department of Transportation sent this bulletin at 07/18/2023 11:17 AM EDT |
|
Having trouble viewing this email? View it as a Web page. |
First Quarter 2023 Average Air Fare Decreases 4.1% from Fourth Quarter 2022
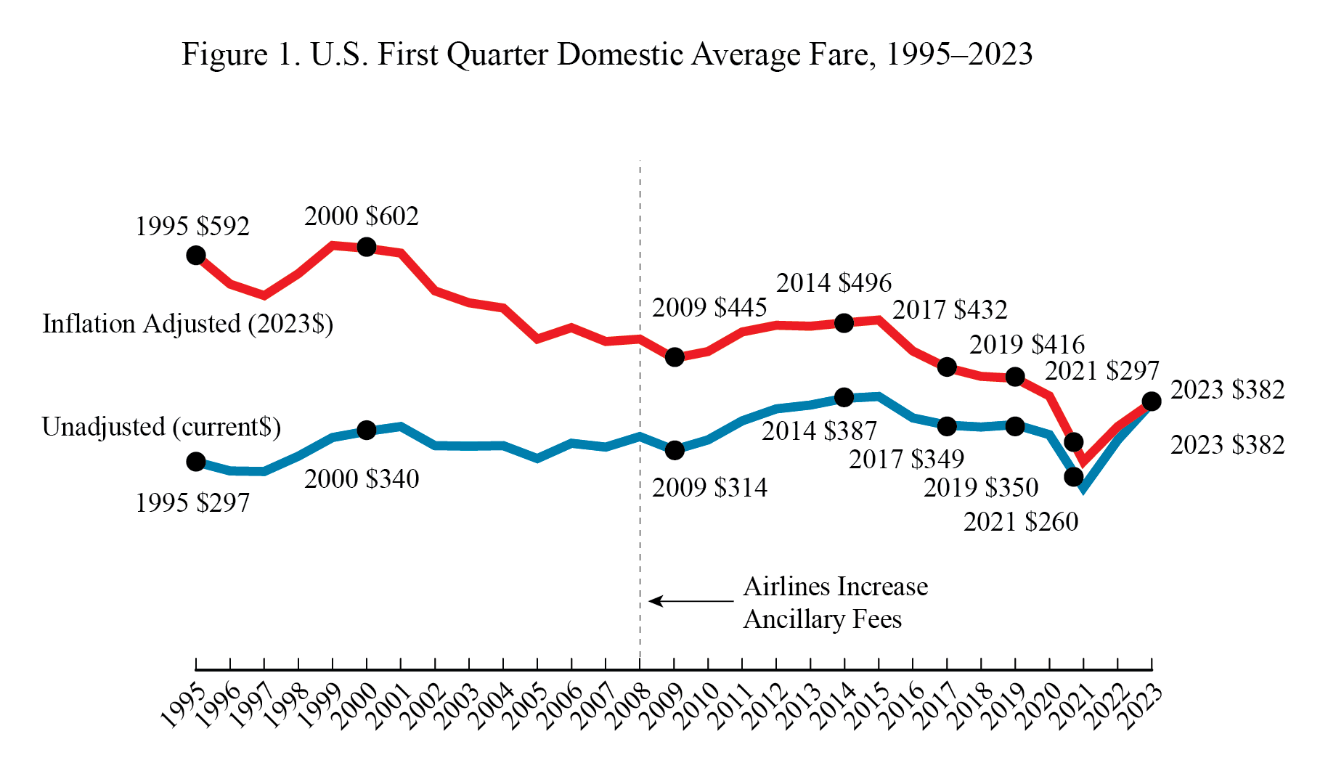
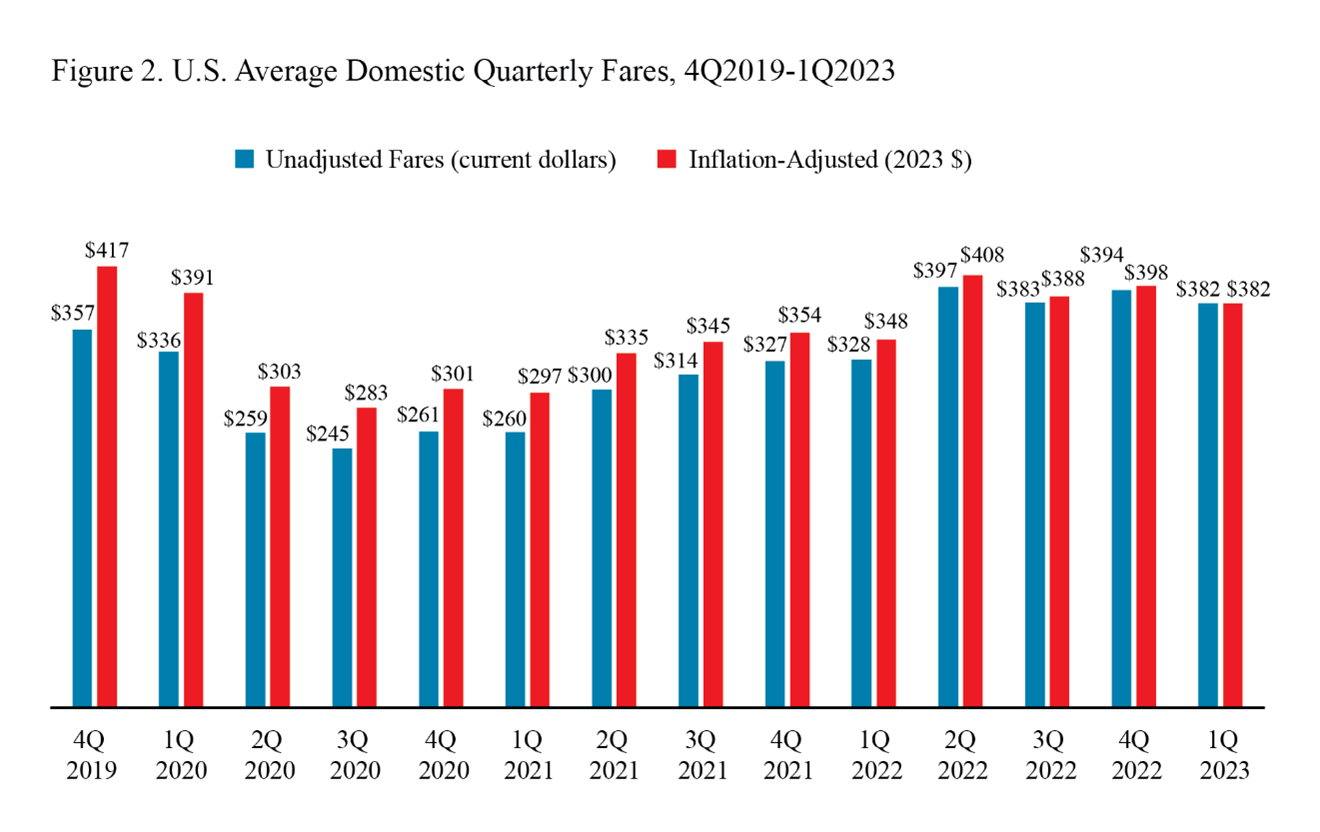
The average U.S. domestic air fare decreased in the first quarter of 2023 to $382, down 4.1% from the fourth quarter 2022 inflation-adjusted fare of $398. Adjusted for inflation (constant 2023 dollars), the average 1Q 2023 air fare was up 34.7% from $283 in the second full quarter (Q3) of the pandemic in 2020 and down 8.4% from the pre-pandemic Q4 2019 fare of $417.
In the first quarter 2023, passenger demand increased with U.S. airlines reporting 75.4 million originating passengers, up 138.8% from 31.6 million passengers in the fourth quarter of 2020.
Other Revenue: In recent years, airlines have increasingly obtained additional revenue from passenger fees, as well as from other sources. U.S. passenger airlines collected 74.2% of total operating revenue of $39.2 billion from passenger fares during the first three months of 2023, down from 88.5% in 1990.
Fares by Airport
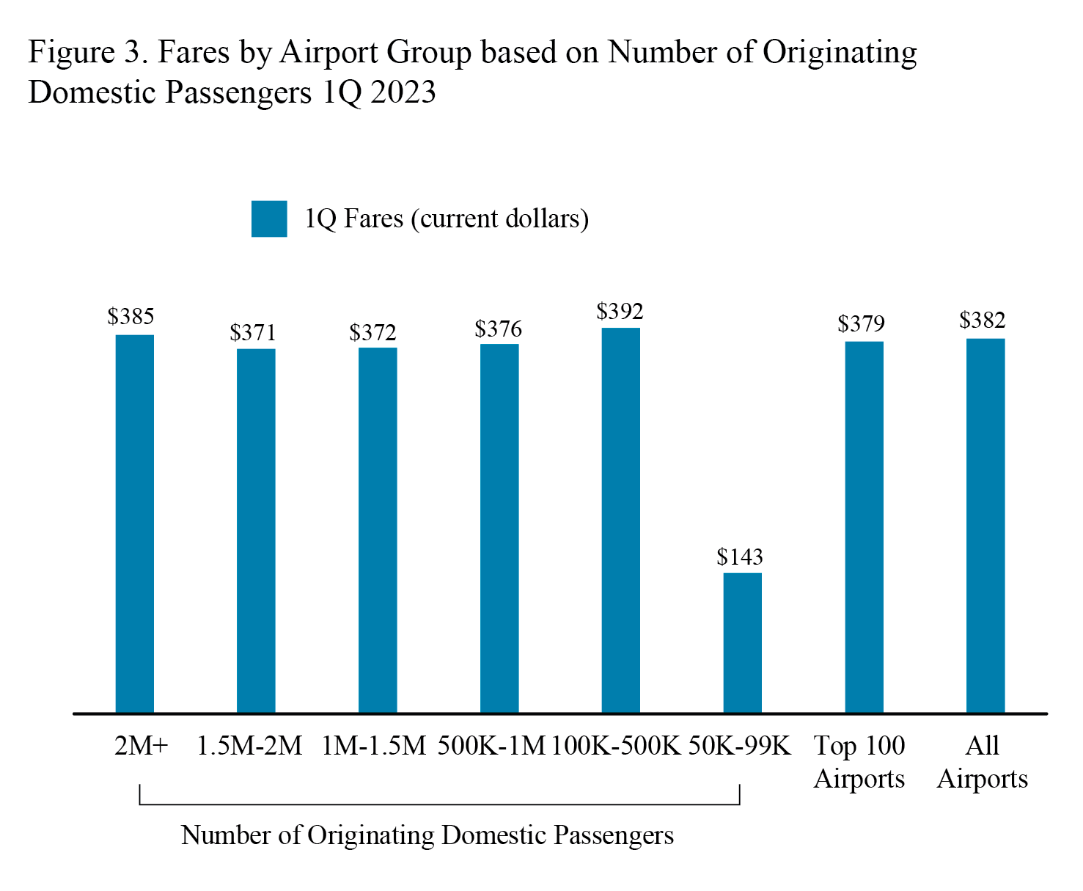
Additional data: see Top 100 Airports or All Airports. Second Quarter 2023 average fare data will be released October 17, 2023.
Standard error: Results for average fares are based on the BTS Origin & Destination Survey, a 10% sample of airline tickets used during the quarter. Averages for airports with smaller samples may be less reliable. For Q1 2023 results based on all itinerary fares, the standard error is 0.32 and the median fare is $307.43. The 90% confidence interval ranges from $380.99 to $382.03. For results based on round-trip fares, the standard error is .42 and the median fare is $390.70. The 90% confidence interval ranges from $460.01 to $461.39. For results based on one-way fares, the standard error is .38 and the median fare is $222.37. The 90% confidence interval ranges from $276.20 to $277.46.
|
You are subscribed to email updates from the USDOT Bureau of Transportation Statistics. Subscriber Services: Manage Preferences |
|
||||||||||||