
U.S. Airlines’ January 2023 Fuel Cost per Gallon Up 4.3% from December 2022; Aviation Fuel Consumption Down 0.7% from Pre-Pandemic January 2019
U.S. Department of Transportation sent this bulletin at 03/03/2023 11:08 AM EST |
|
Having trouble viewing this email? View it as a Web page. |
U.S. Airlines’ January 2023 Fuel Cost per Gallon Up 4.3% from December 2022; Aviation Fuel Consumption Down 0.7% from Pre-Pandemic January 2019
Friday, March 3, 2023
The Department of Transportation’s Bureau of Transportation Statistics (BTS) today released U.S. airlines’ January 2023 fuel cost and consumption numbers indicating U.S. scheduled service airlines used 1.413 billion gallons of fuel, 4.0% less fuel than in December 2022 (1.471 billion gallons) and 0.7% less than in pre-pandemic January 2019. The cost per gallon of fuel in January 2023 ($3.28) was up 14 cents (4.3%) from December 2022 ($3.14) and up $1.37 (71.7%) from January 2019. Total January 2023 fuel expenditure ($4.63B) was up 0.2% from December 2022 ($4.63B) and up 70.6% from pre-pandemic January 2019.
Year-over-year increases in fuel consumption and cost for January 2023 include 14.5% in domestic fuel consumption, 61.4% in domestic fuel cost, and 40.9% in cost per gallon. Domestic fuel consumption decreased 3.4% from December 2022 to January 2023, while increasing 2.5% from January 2019. Increased fuel consumption reflects an increase in airline passenger travel over the same period.
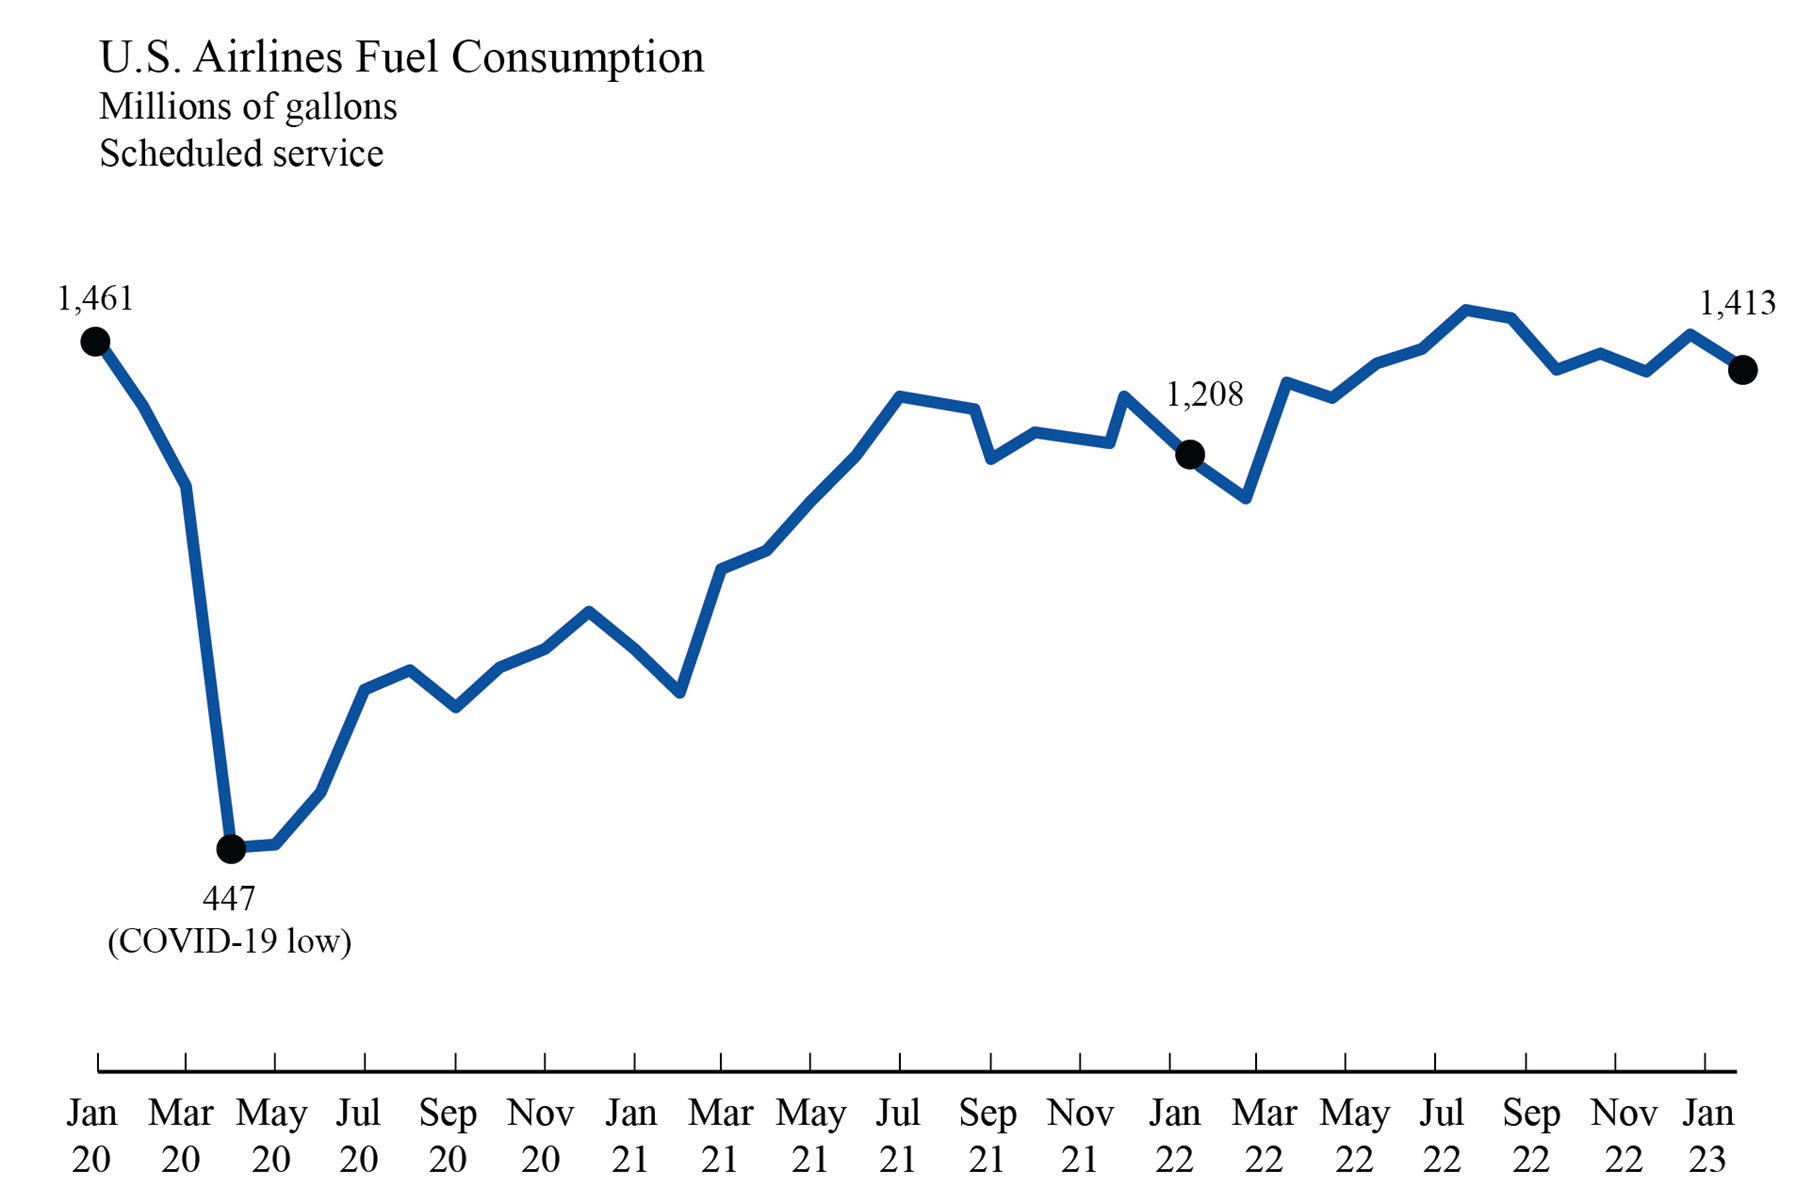
Fuel consumed by U.S. airlines (total) scheduled service:
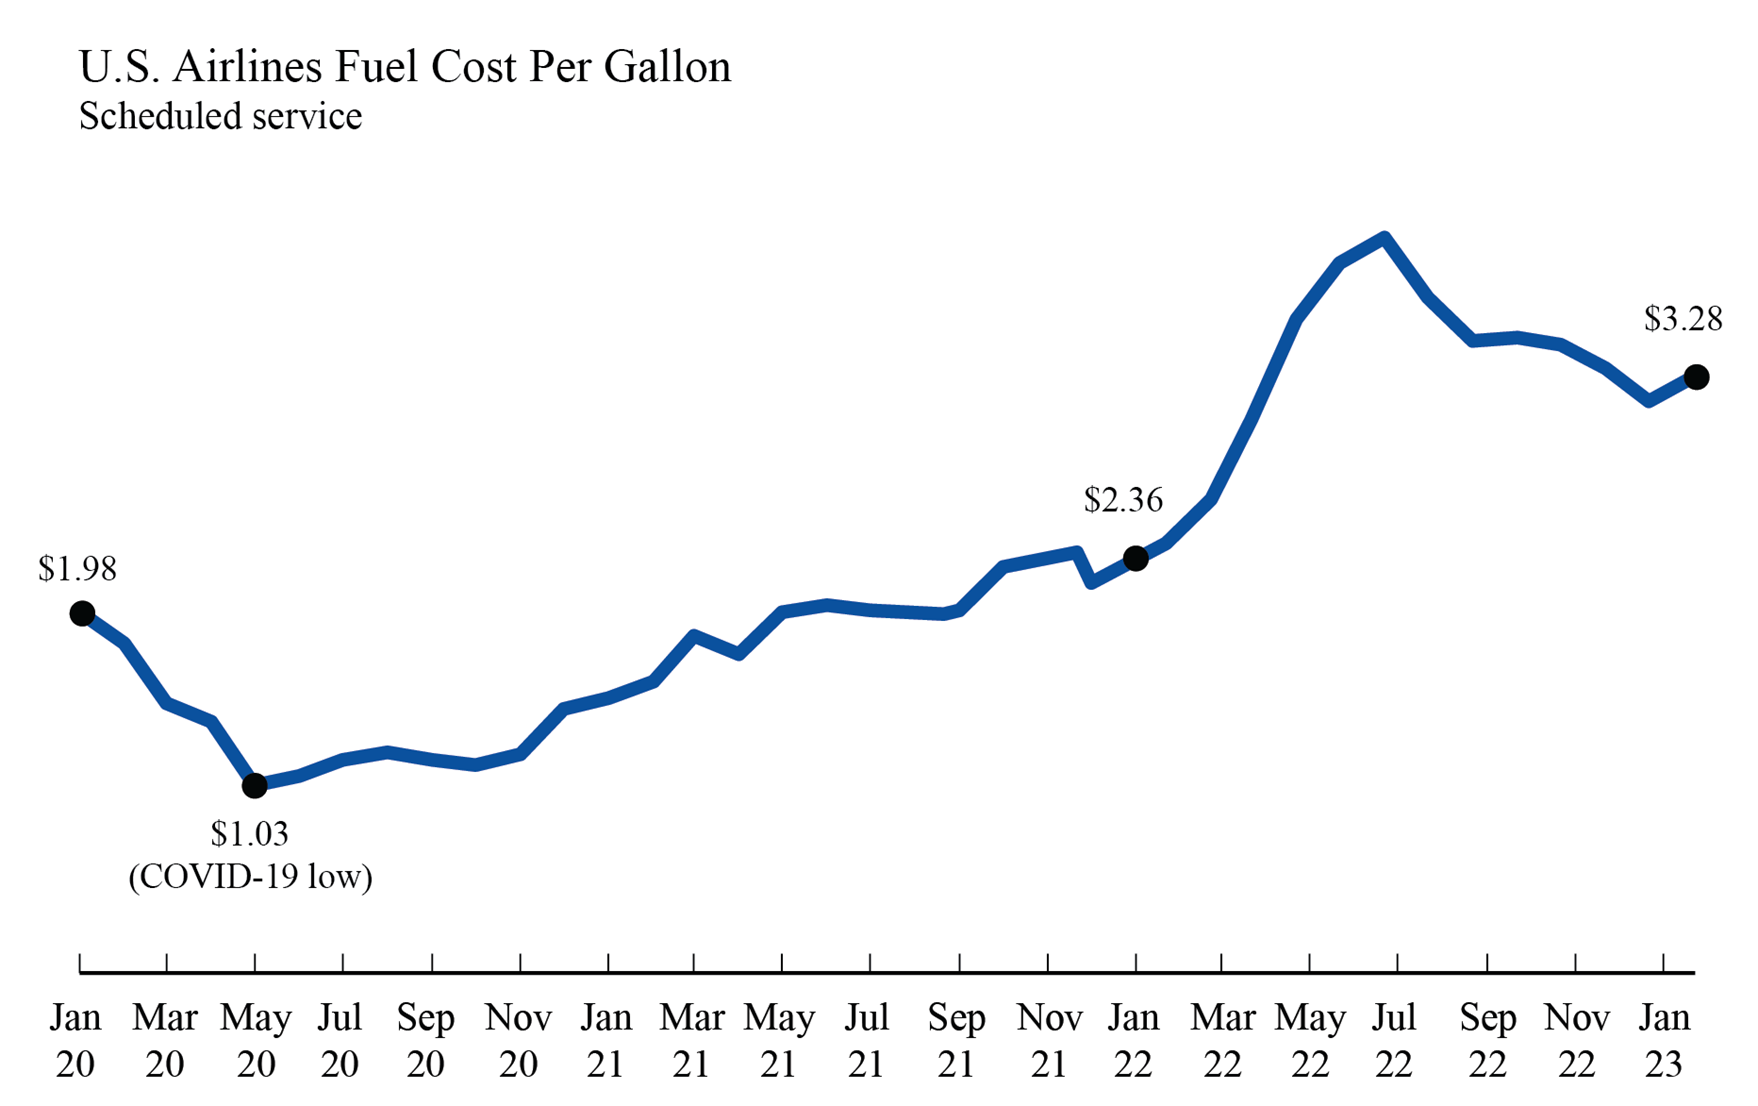
Fuel cost per gallon for U.S. airlines (total) scheduled service:
Total fuel cost for U.S. airlines (total) scheduled service:
Fuel Cost and Consumption data from January 2000 to the present can be found at https://transtats.bts.gov/fuel.asp. Summaries by month are also available.
Airline fuel costs may be affected by hedging, contracts that allow airlines to limit exposure to future price changes.
Individual airline numbers through September 2022 are available on the BTS website.
Please Note:
The information provided within BTS statistical releases may not be based on 100% of reporting carriers. Generally, data are released per schedule if reports have been received from at least 90% of the carriers, along with data from all the major carriers. Regarding this release, the following carriers remain pending: Elite Airways (2HQ), and Caribbean Sun Airlines (WL). Also, within text, percent change results may not be exact due to rounding.
###
|
You are subscribed to email updates from the USDOT Bureau of Transportation Statistics. Subscriber Services: Manage Preferences |
|
||||||||||||