
North American Transborder Freight up 4.8% in November 2022 from November 2021
U.S. Department of Transportation sent this bulletin at 01/26/2023 11:05 AM EST |
|
Having trouble viewing this email? View it as a Web page. |
North American Transborder Freight up 4.8% in November 2022
from November 2021
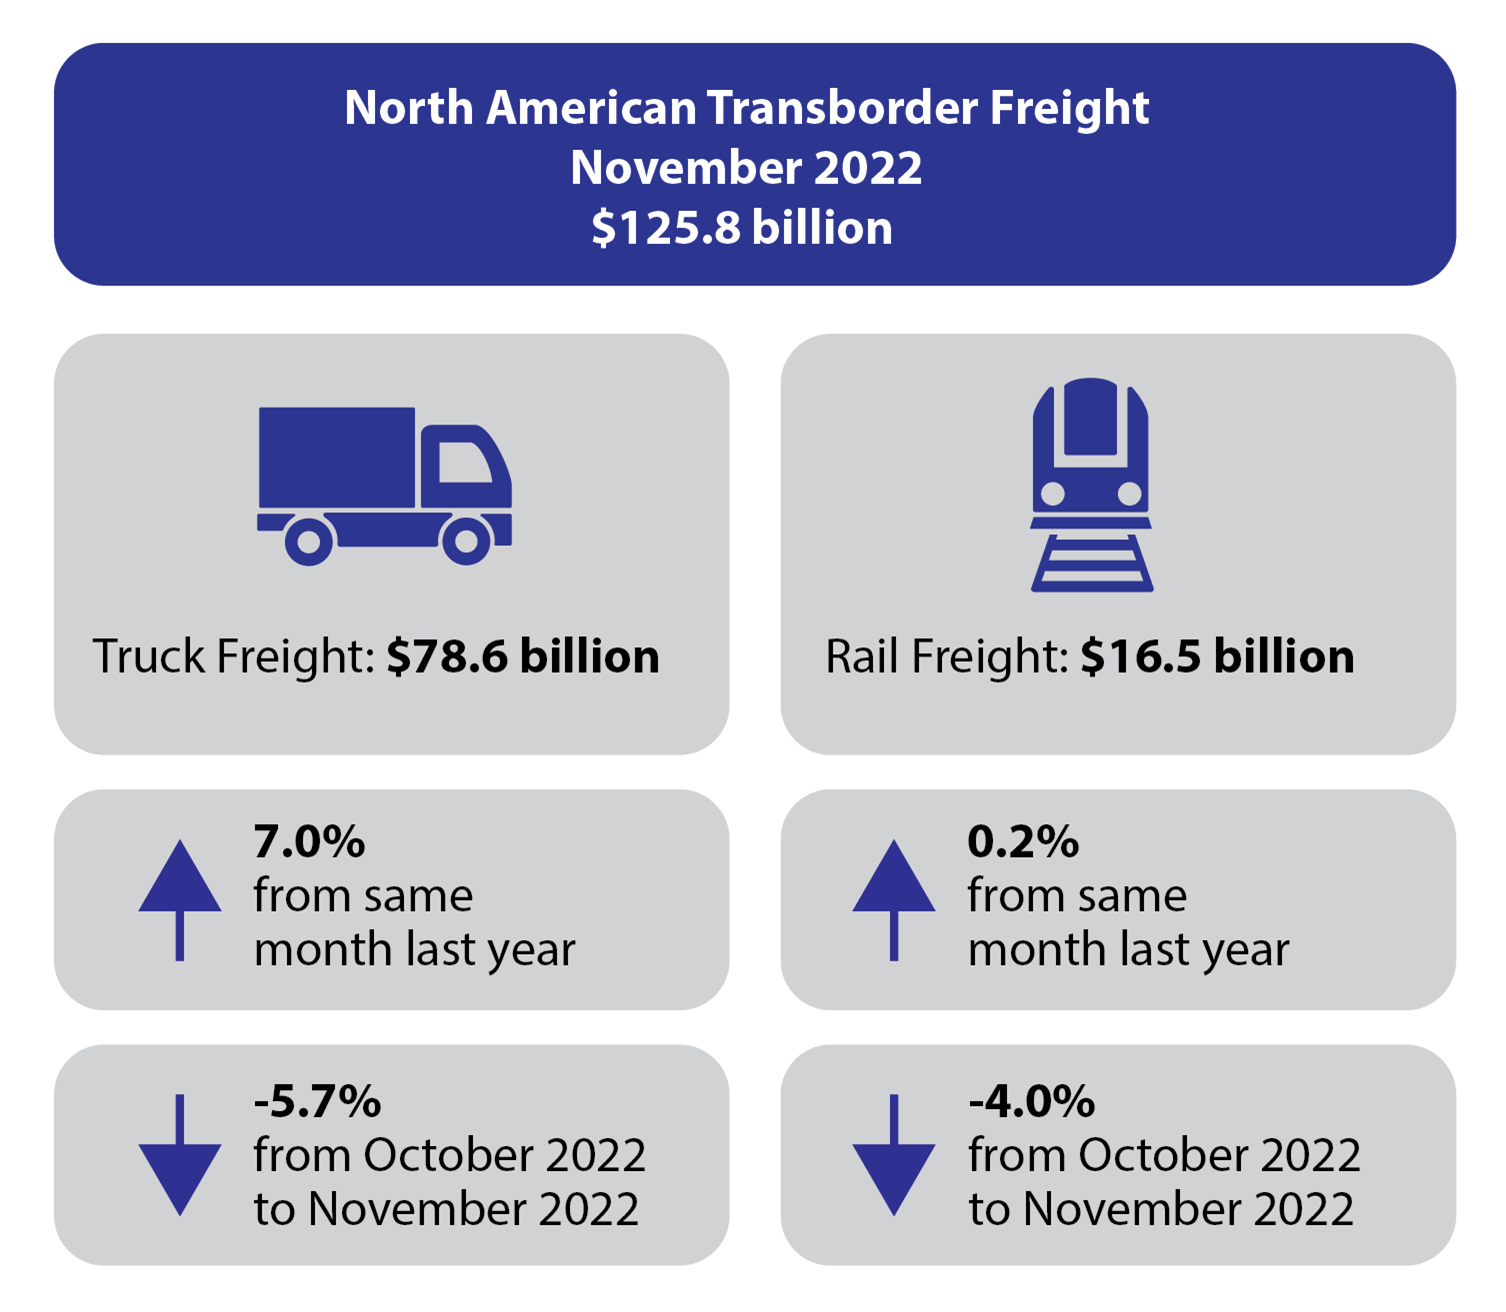
- Total transborder freight: $125.8 billion of transborder freight moved by all modes of transportation, up 4.8% compared to November 2021
- Freight between the U.S. and Canada totaled $63.4 billion, up 3.3% from November 2021
- Freight between the U.S. and Mexico totaled $62.4 billion, up 6.3% from November 2021
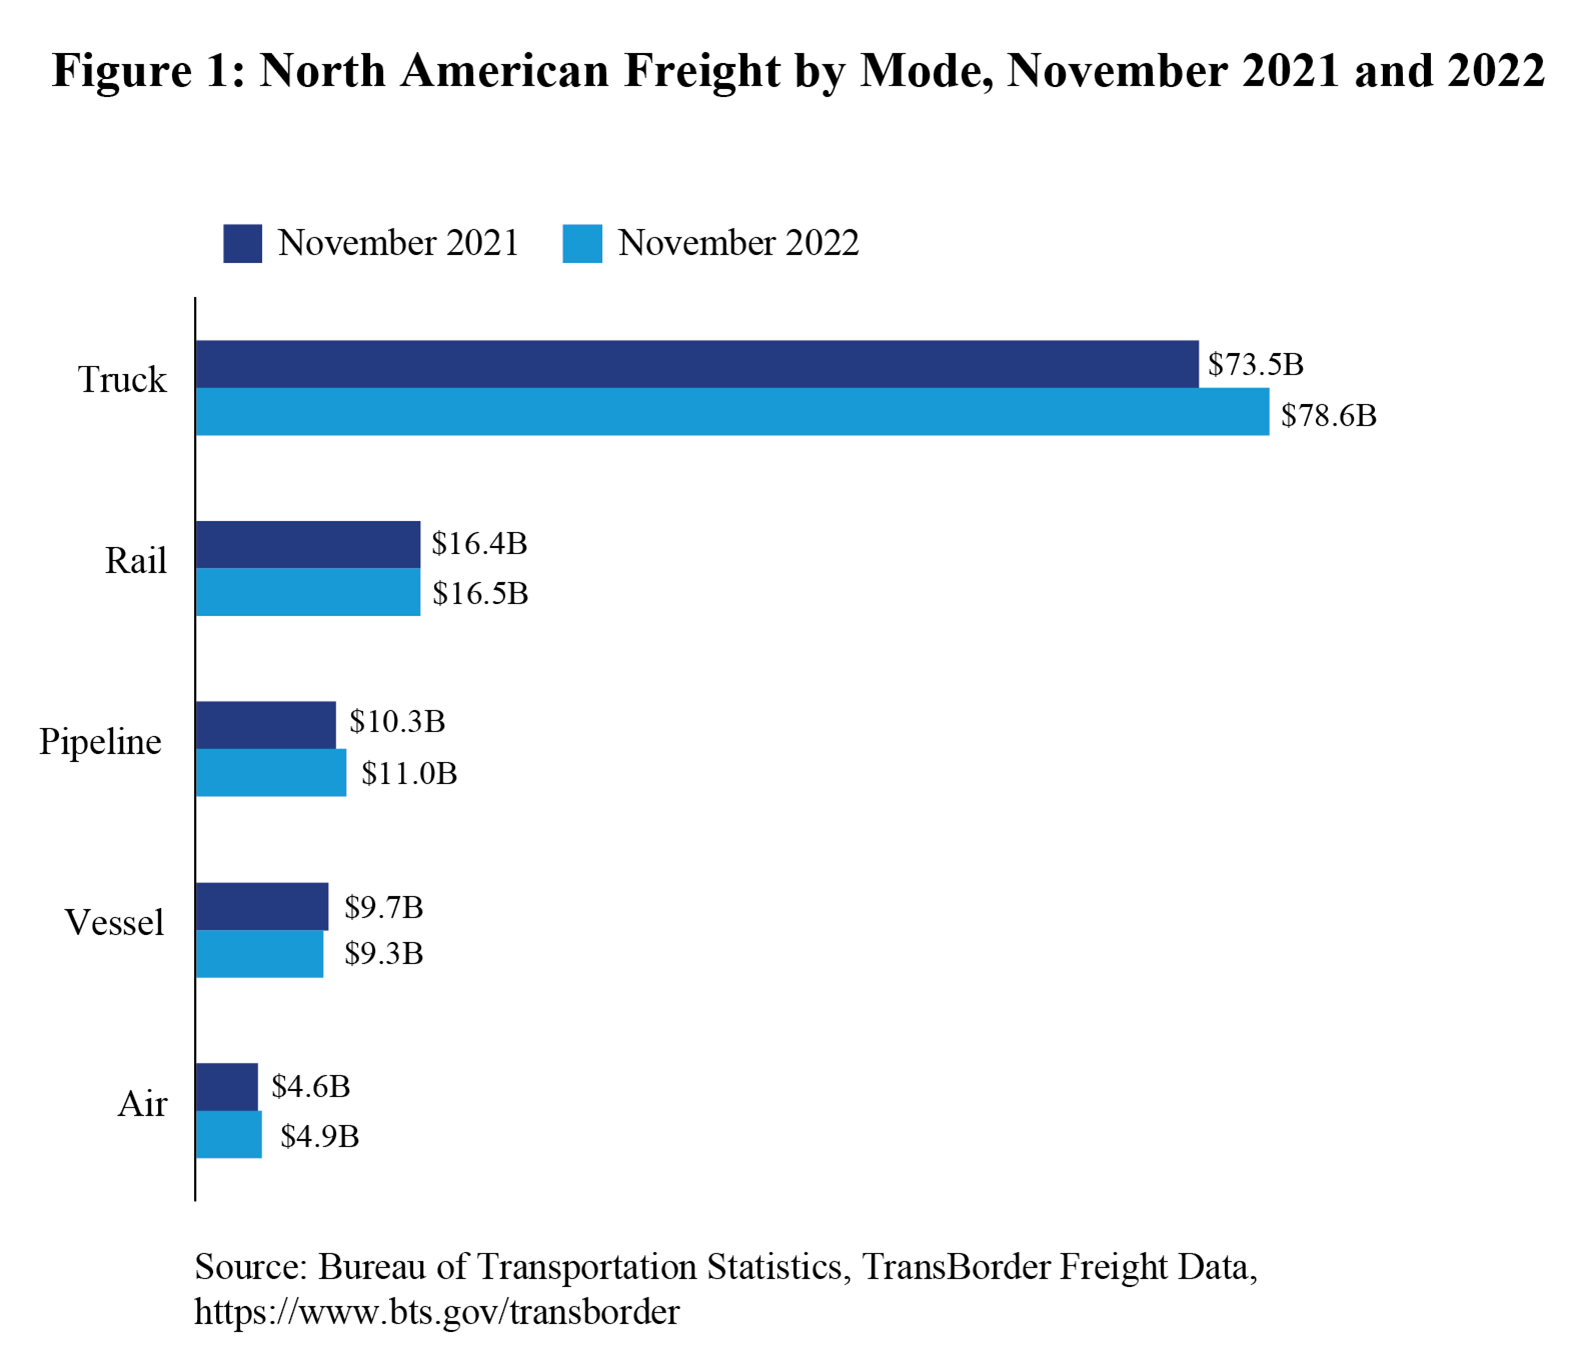
- Trucks moved $78.6 billion of freight, up 7.0% compared to November 2021
- Railways moved $16.5 billion of freight, up 0.2% compared to November 2021
- Pipelines moved $11.0 billion of freight, up 7.4% compared to November 2021
- Vessels moved $9.3 billion of freight, down 3.7% compared to November 2021
Total Transborder Freight by Border and Mode:
|
U.S.-Canada (both directions)
(Dollars in Billions)
Truck: $34.1
Pipeline: $10.1
Rail: $9.3
Air: $3.1
Vessel: $3.0
|
U.S.-Mexico (both directions)
(Dollars in Billions)
Truck: $44.5
Rail: $7.2
Vessel: $6.3
Air: $1.7
Pipeline: $0.9
|
The value of oil increased by 6.6% in November 2022 compared to November 2021, which contributed to year-over-year increases in the value of freight moved by pipeline with Canada and vessel with Mexico. (1)(2) Chicago, Port Huron, and Minneapolis are the top pipeline connection regions for U.S. energy flows with Canada. Port of Houston, Arthur, and Texas City are the top water port connections for U.S. energy flows with Mexico.
|
U.S.-Canada Trade Breakdown
Top three truck ports Detroit, MI $10.2 billion Port Huron, MI $5.5 billion Buffalo, NY $5.3 billion
Top three truck commodities Computers/parts $5.5 billion Vehicles/parts $4.5 billion Electrical machinery $2.3 billion
Top three rail ports Detroit, MI $2.5 billion Port Huron, MI $2.0 billion Int’l Falls, MN $1.3 billion
Top three rail commodities Vehicles/part $3.4 billion Mineral fuel $0.9 billion Fertilizers $0.6 billion |
U.S.-Mexico Trade Breakdown
Top three truck ports Laredo, TX $19.7 billion El Paso-Ysleta, TX $6.7 billion Otay Mesa, CA $4.9 billion
Top three truck commodities Electrical machinery $10.0 billion Computers/parts $10.0 billion Vehicles/parts $5.9 billion
Top three rail ports Laredo, TX $3.9 billion Eagle Pass, TX $2.0 billion El Paso, TX $0.6 billion
Top three rail commodities Vehicles/parts $3.6 billion Computers/part $0.5 billion Cereals $0.4 billion |
Reporting Notes
Data in this Bureau of Transportation Statistics release are not seasonally adjusted and are not adjusted for inflation. For previous statistical releases and summary tables, see transborder releases. See transborder freight data for data from previous months, and additional state, port, and commodity data. BTS has scheduled the next release of transborder numbers for February 21, 2023.
1 Changes are due to fluctuations in the price of oil, volume, and weight.
2 WTI Spot Price: https://www.eia.gov/dnav/pet/hist/LeafHandler.ashx?n=pet&s=rwtc&f=m
|
You are subscribed to email updates from the USDOT Bureau of Transportation Statistics. Subscriber Services: Manage Preferences |
|
||||||||||||