
October 2022 U.S. Airline Traffic Data
U.S. Department of Transportation sent this bulletin at 01/17/2023 11:05 AM EST |
|
Having trouble viewing this email? View it as a Web page. |
October 2022 U.S. Airline Traffic Data
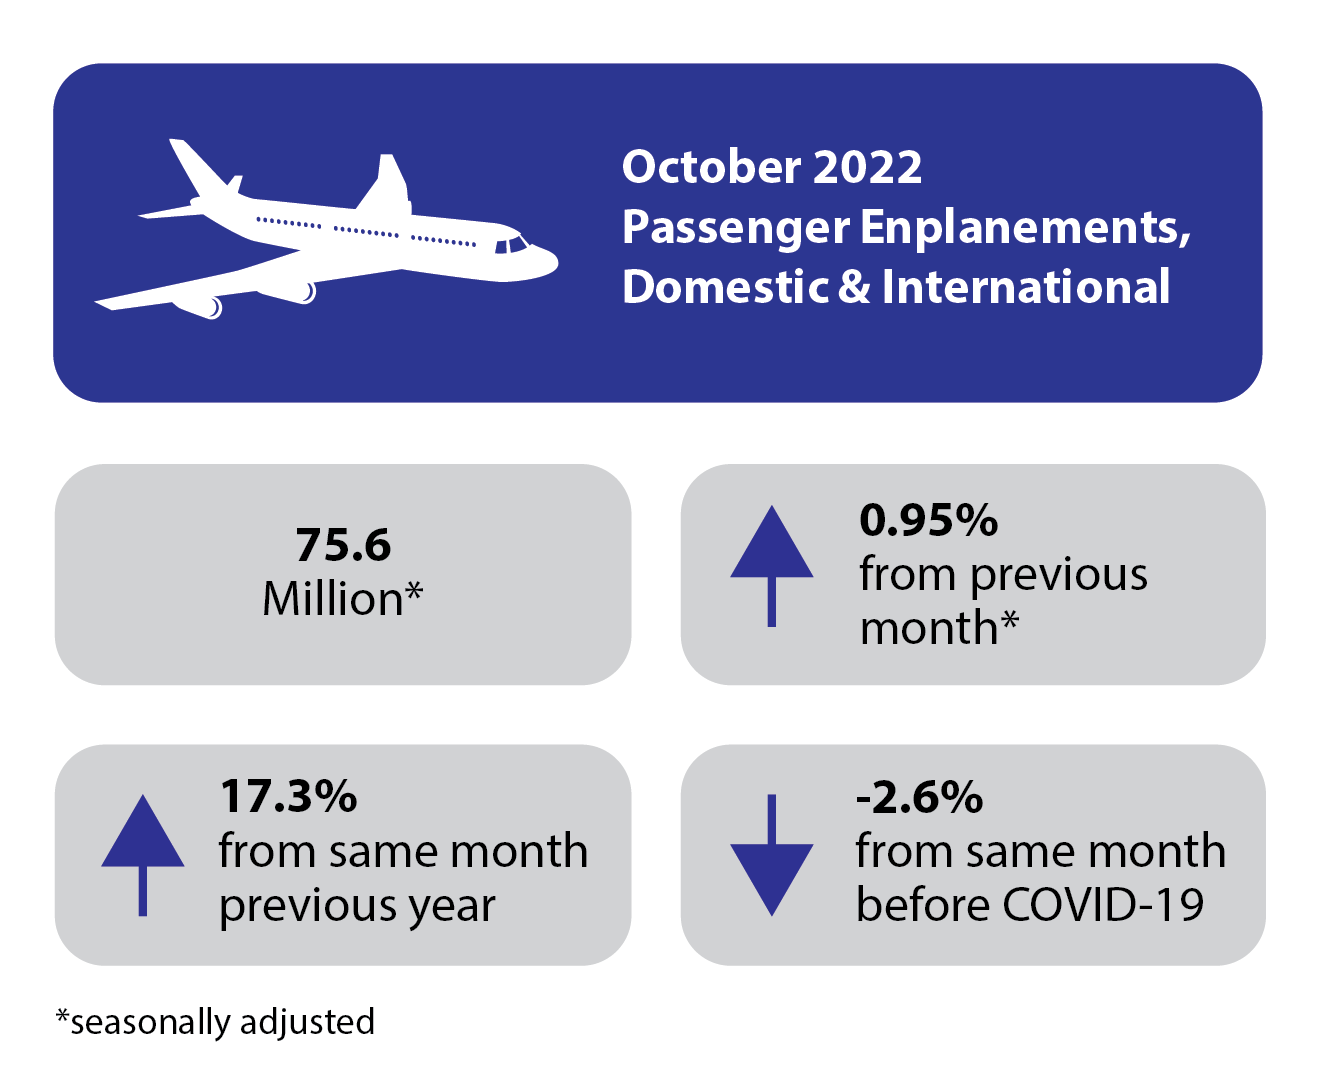
U.S. airlines carried 75.6 million systemwide (domestic and international) scheduled service passengers in October 2022, seasonally adjusted, according to the Bureau of Transportation Statistics’ (BTS), up 1.0% from September.
BTS reported 66.1 million domestic passengers and 9.5 million international passengers on U.S. airlines flights in October.
U.S. airline traffic reports are filed monthly with BTS. See the tables that accompany this release on the BTS website for summary data since 2016 (Tables 1-24) and complete data since 2000.
U.S. airlines passenger enplanements
October seasonally adjusted:
- System-wide enplanements (75.6M) were down 6.3% from the all-time high of 80.7 million reached in January 2020.
- Domestic enplanements (66.1M) were down 6.8% from the all-time high of 70.9 million reached in January 2020.
- International enplanements (9.49M) were down 2.9% from the all-time high of 9.78 million reached in October 2019.
October unadjusted:
- Systemwide enplanements (76.0M) were down 3.3% from the all-time October high (78.6M) reached in 2019.
- Domestic enplanements (67.6M) were down 3.3% from the all-time October high (69.9M) reached in 2019.
- International enplanements (8.42M) were down 3.2% from the all-time October high (8.69M) reached in 2019.
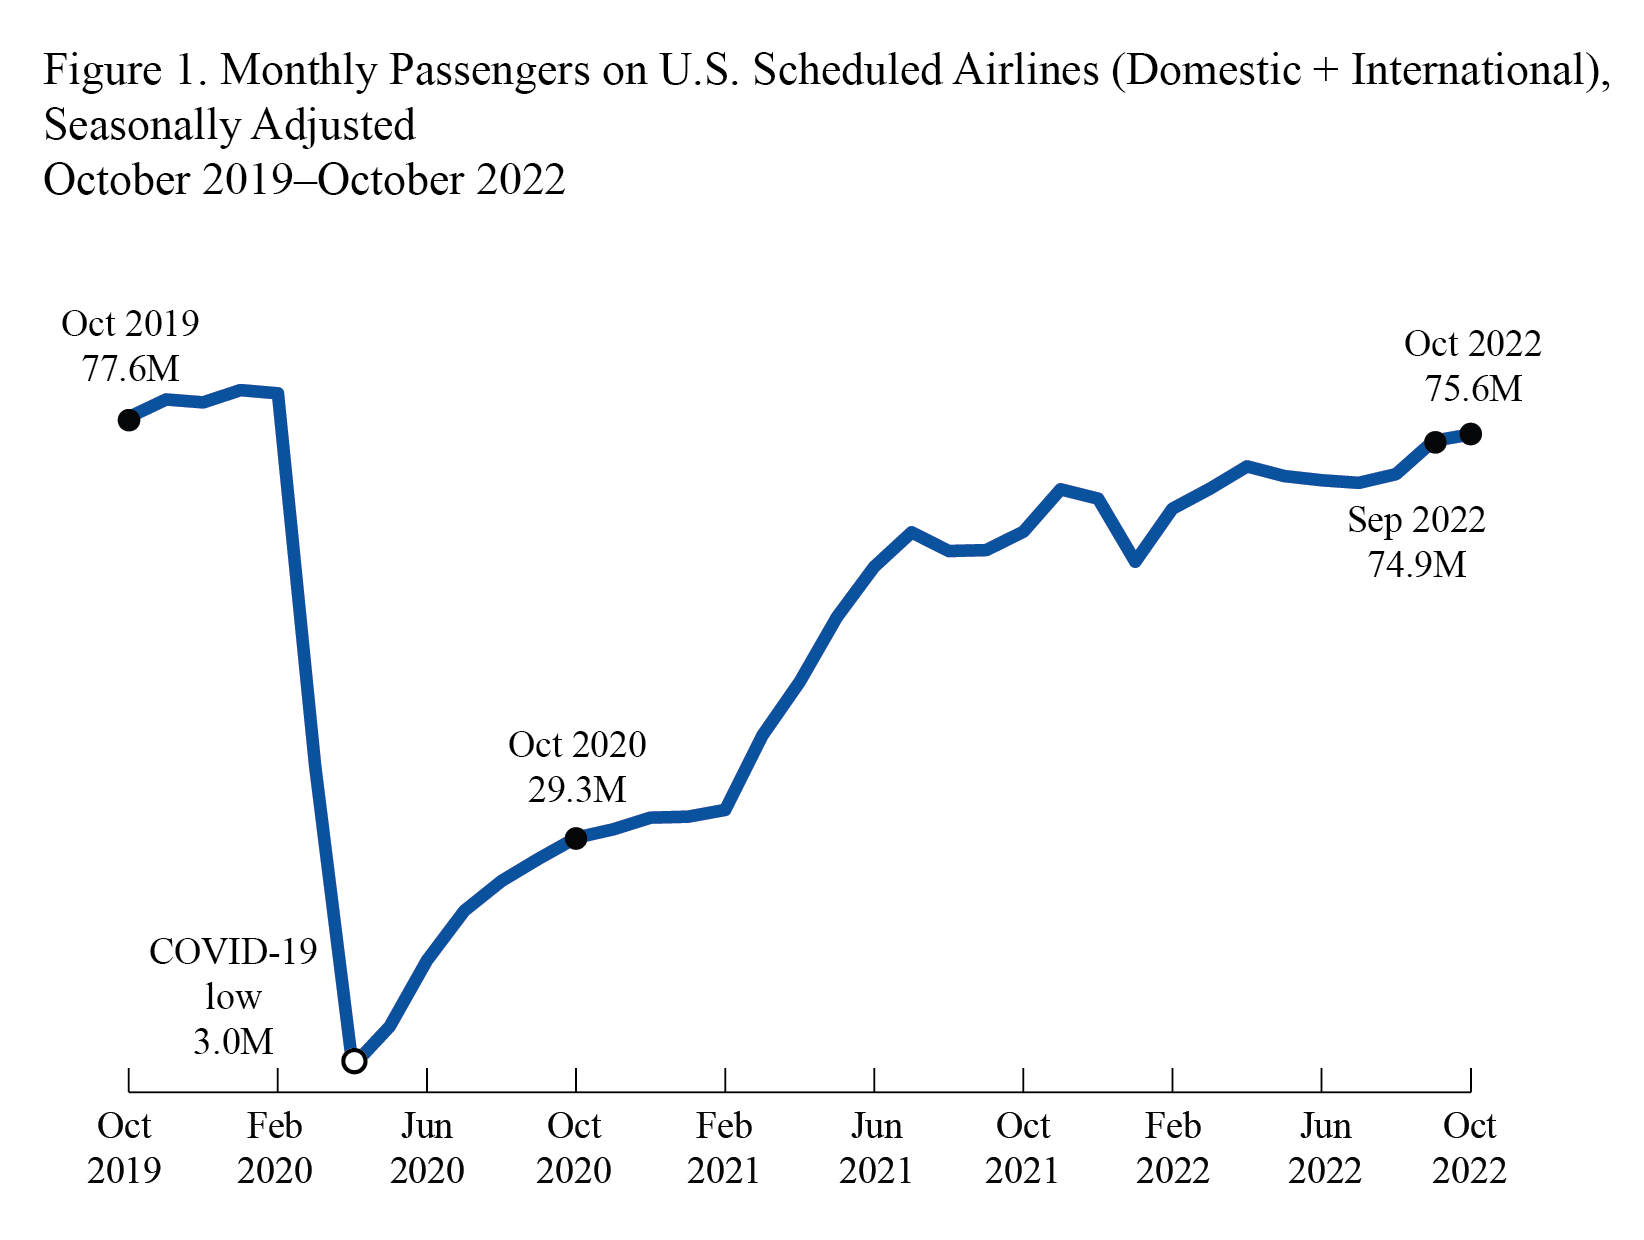
Table A. Seasonally Adjusted Passenger Enplanements Compared to Previous Time Periods
|
Seasonally Adjusted |
Passengers (in millions) |
Percent Change Compared to: |
||
|
Previous Month |
Previous Year |
Three Years Previous |
||
|
October |
75.6 |
1.0% |
17.3% |
-2.6% |
Table B. Unadjusted Passenger Enplanements Compared to Previous Time Periods
|
Unadjusted |
Passengers (in millions) |
Percent Change Compared to: |
||
|
Previous Year |
Two Years Previous |
Three Years Previous |
||
|
October |
76.0 |
15.4% |
153.4% |
-3.3% |
For data filed through October, see accompanying tables. For the complete database of reported data, see Traffic. For an explanation of BTS’ seasonal adjustment methodology, see Seasonal Adjustment.
Reporting Notes
Data are compiled from monthly reports filed with BTS by commercial U.S. air carriers detailing operations, passenger traffic and freight traffic. This release includes data received by BTS from 77 U.S. carriers as of January 5 for U.S. carrier scheduled civilian operations.
See the BTS Airlines and Airports page for additional scheduled service numbers through October for U.S. airlines. International data by origin and destination is available through July. International totals in this press release consist of all U.S. carrier operations to and from the U.S. and from one foreign point to another foreign point. BTS’ Airlines and Airports page does not include U.S. carriers’ foreign point-to-point flights.
BTS has scheduled February 9th for the release of data through November.
None of the data are from samples. Measures of statistical significance do not apply to the complete air traffic data.
Missing carriers: 2HQ (Elite) has not been reported since July 2022 and 34Q (Polaris Aviation Solutions) has not been reported since Aug 2022. ExpressJet (EV) is in Chapter 11 and discontinued operations on August 22nd. There are no operations to report for September and beyond.
|
You are subscribed to email updates from the USDOT Bureau of Transportation Statistics. Subscriber Services: Manage Preferences |
|
||||||||||||