
North American Transborder Freight up 23.8% in March 2022 from March 2021
U.S. Department of Transportation sent this bulletin at 05/25/2022 11:21 AM EDT |
|
Having trouble viewing this email? View it as a Web page. |
BTS 24-22
Wednesday, May 25, 2022
Contact: BTSnews@dot.gov
North American Transborder Freight up 23.8% in March 2022
from March 2021
Transborder freight between the U.S. and North American countries (Canada and Mexico) in March 2022:
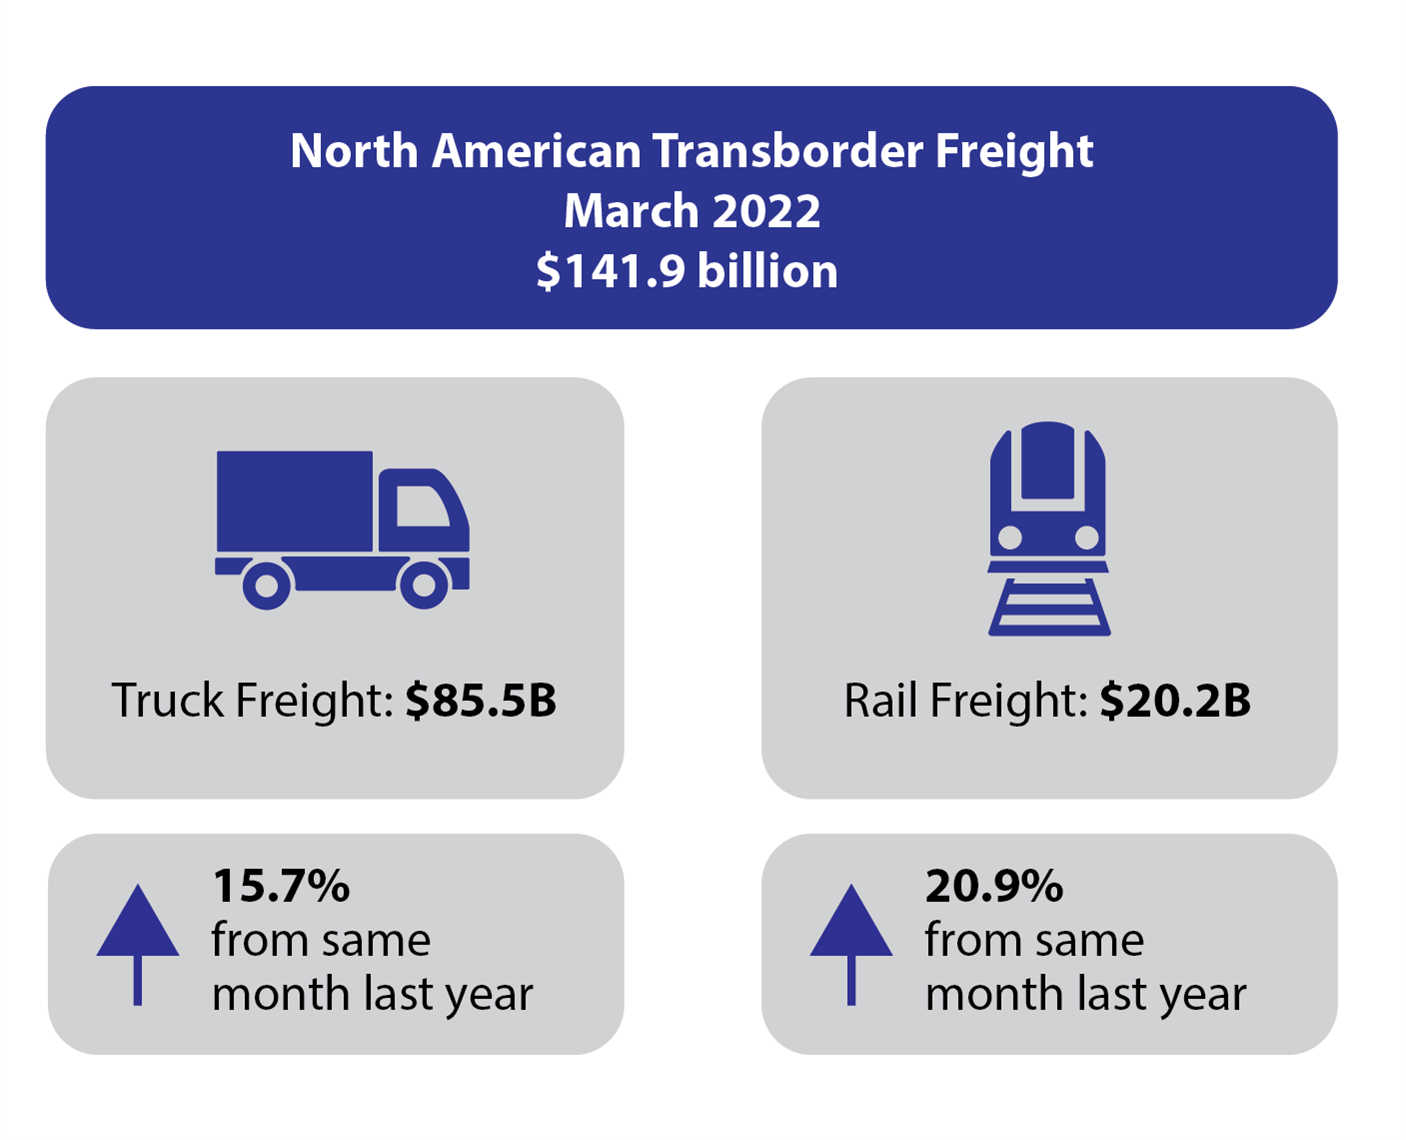
- Total transborder freight: $141.9 billion of transborder freight moved by all modes of transportation, up 23.8% compared to March 2021.
- Freight between the U.S. and Canada totaled $72.9B. Freight between the U.S. and Mexico totaled $69.0B.
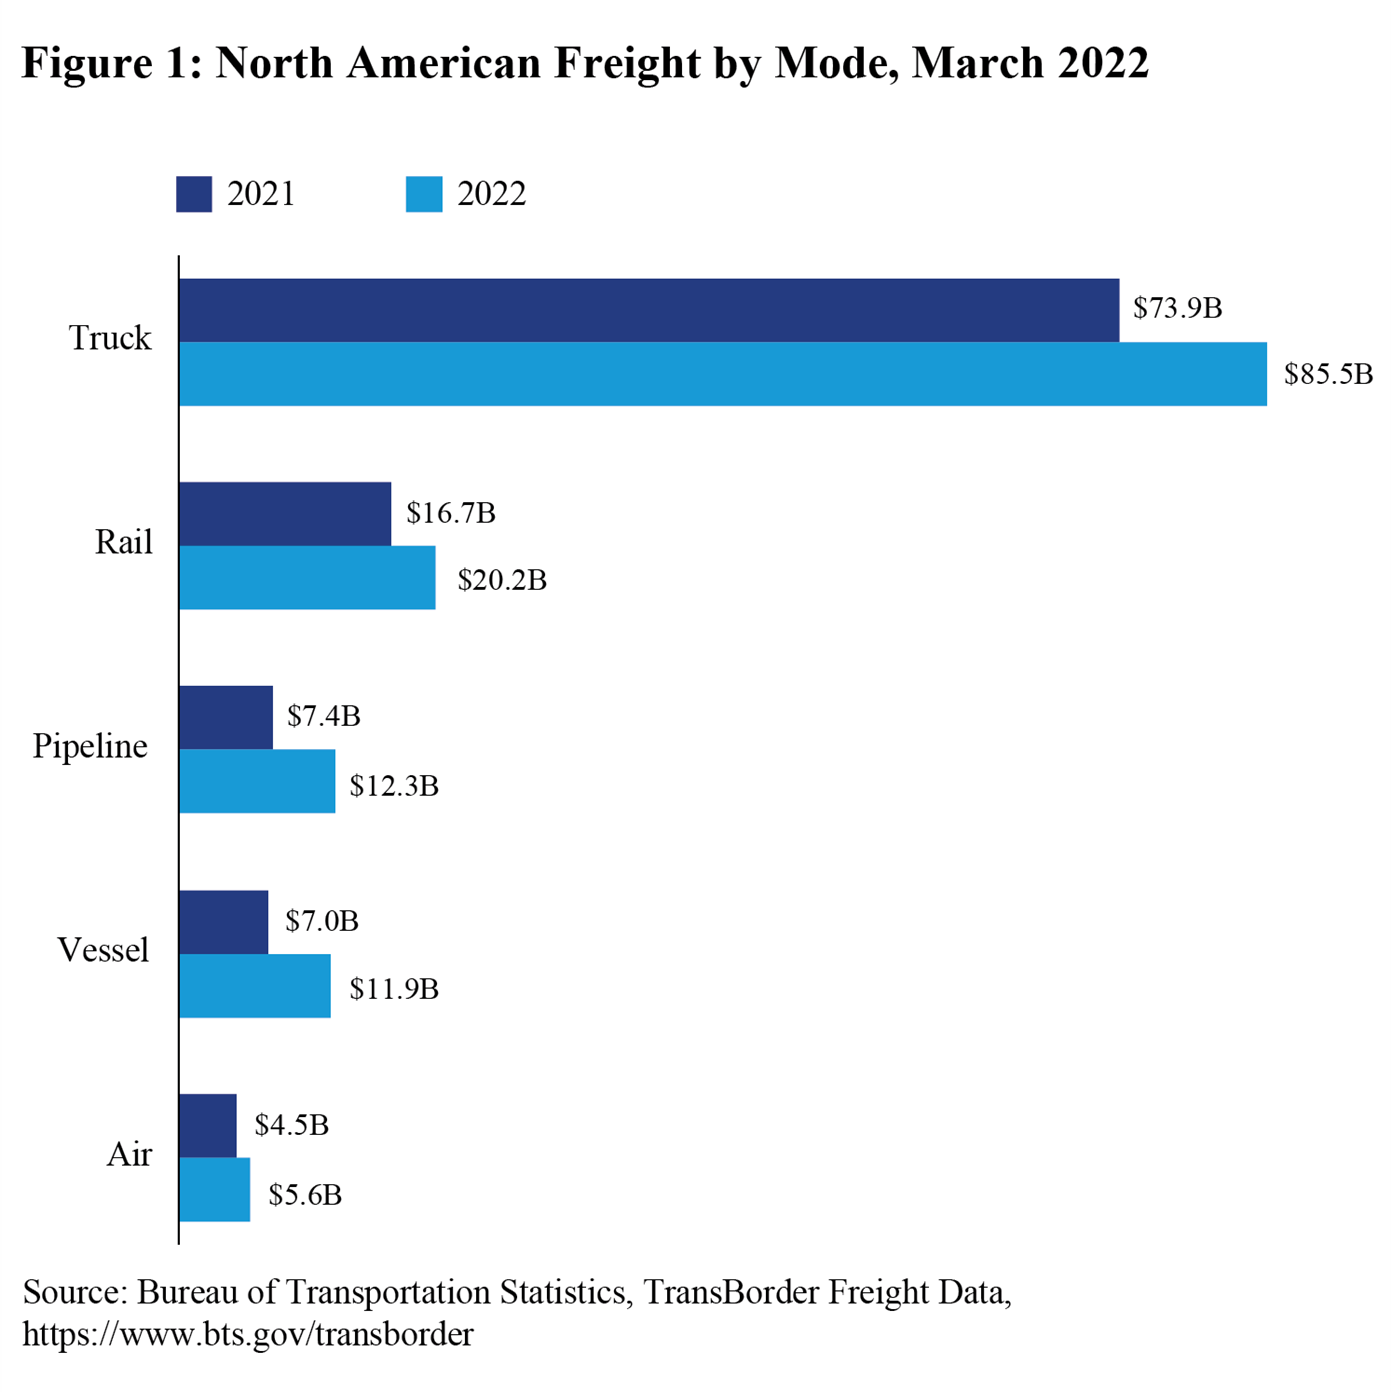
- Trucks moved $85.5 billion of freight, up 15.7% compared to March 2021.
- Railways moved $20.2 billion of freight, up 20.9% compared to March 2021.
Total Transborder Freight by Border Compared to March 2021:
- U.S.-Canada up 26.3%
- U.S.-Mexico up 21.2%
Total Transborder Freight by Border and Mode:
|
U.S.-Canada (both directions) (Dollars in Billions) Truck: $38.4 Rail: $11.7 Pipeline: $11.4 Air: $3.6 Vessel: $3.6 |
U.S.-Mexico (both directions) (Dollars in Billions) Truck: $47.1 Rail: $8.5 Vessel: $8.4 Air: $2.0 Pipeline: $0.9 |
The value of oil increased by 74.1% in March 2022 compared to March 2021. 1Over 99% of pipeline freight between the U.S. and Canada are mineral fuels, primarily oil and gas. Of freight by vessel between the U.S. and Mexico, over 50% are mineral fuel shipments between Gulf of Mexico ports in the U.S. and Mexico.
Truck Freight: $85.5 billion (60.3% of all transborder freight)
- U.S.-Canada: $38.4 billion (52.7% of all northern border freight)
- U.S.-Mexico: $47.1 billion (68.3% of all southern border freight)
- Top three busiest truck border ports
- Laredo, TX $20.0 billion
- Detroit, MI $10.7 billion
- Port Huron, MI $6.9 billion
- Top three truck commodities
- Computers and parts $16.0 billion
- Electrical machinery $13.0 billion
- Vehicles and parts $10.8 billion
Rail Freight: $20.2 billion (14.2% of all transborder freight)
- U.S.-Canada: $11.7 billion (16.1% of all northern border freight)
- U.S.-Mexico: $8.5 billion (12.3% of all southern border freight)
- Top three busiest rail border ports
- Laredo, TX $4.5 billion
- Port Huron, MI $2.8 billion
- Detroit, MI $2.5 billion
- Top three rail commodities
- Vehicles and parts $7.9 billion
- Mineral fuels $1.6 billion
- Plastics $1.4 billion
Reporting Notes
Data in this Bureau of Transportation Statistics release are not seasonally adjusted and are not adjusted for inflation. For previous statistical releases and summary tables, see transborder releases. See transborder freight data for data from previous months, and for additional state, port, and commodity data. BTS has scheduled the release of April transborder numbers for June 22, 2022.
1 Cushing, OK WTI Spot Price: https://www.eia.gov/dnav/pet/hist/LeafHandler.ashx?n=pet&s=rwtc&f=m
|
You are subscribed to email updates from the USDOT Bureau of Transportation Statistics. Subscriber Services: Manage Preferences |
|
||||||||||||