
North American Transborder Freight up 17.3% in February 2022 from February 2021
U.S. Department of Transportation sent this bulletin at 04/20/2022 11:38 AM EDT |
|
Having trouble viewing this email? View it as a Web page. |
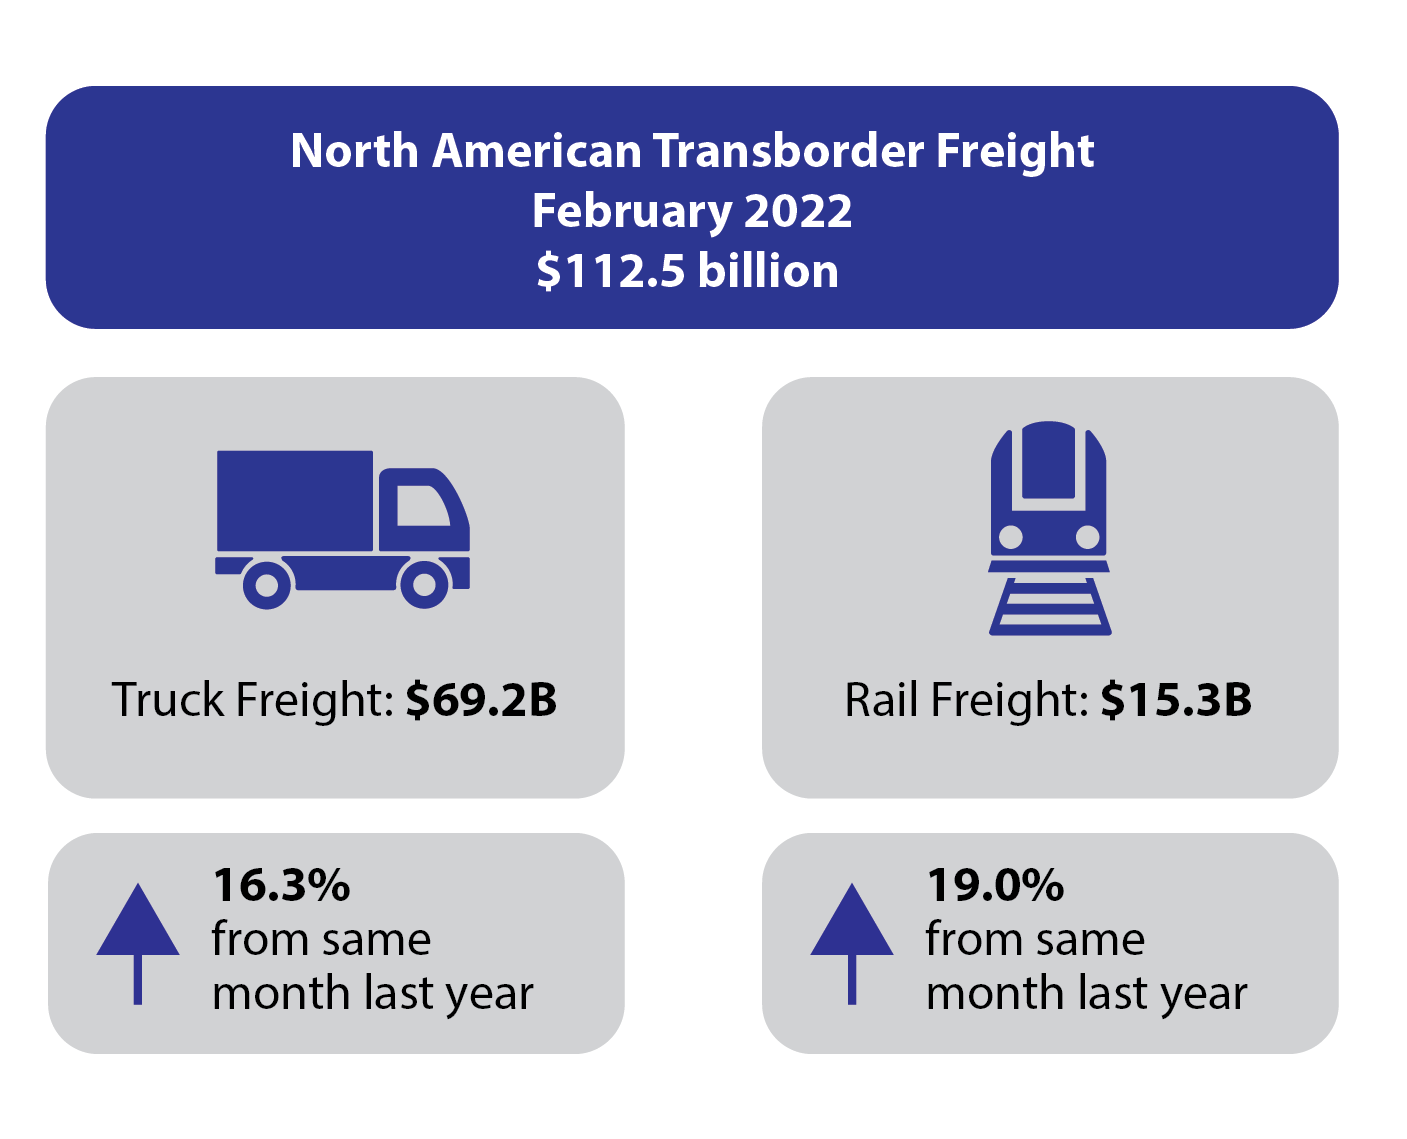
Freight shipped across the U.S. borders with Canada and Mexico by all modes of transportation was valued at $112.5 billion in February 2022, down 1.1% from January 2022 ($113.7B) but up 17.3% from February 2021 ($95.86B) and up17.2% from pre-pandemic February 2020 ($95.95B).
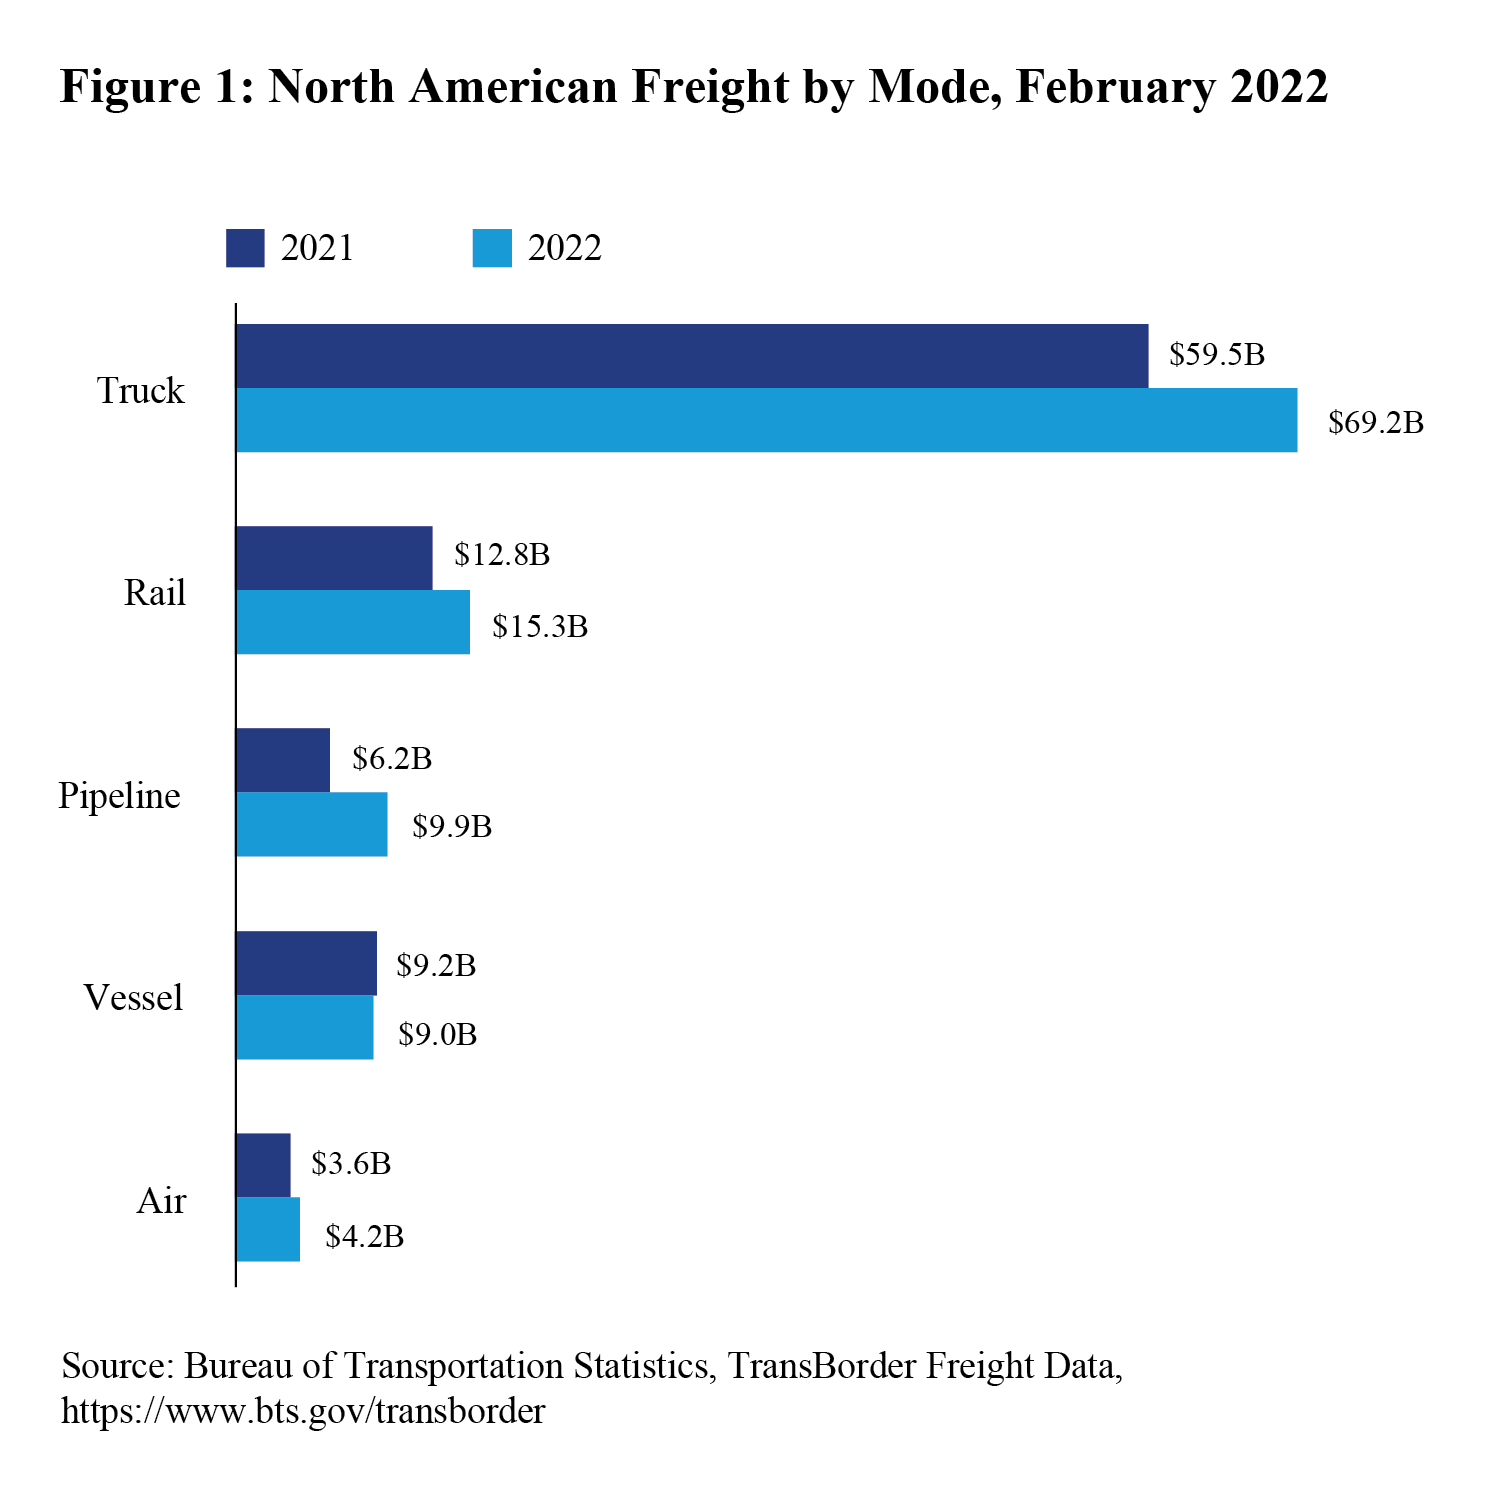
Freight between the U.S. and Canada totaled $56.2B in February 2022, up 18.6% from February 2021 ($47.4B). Freight between the U.S. and Mexico totaled $56.3B, up 16% from February 2021 ($48.5B). Also in February 2022, trucks moved $69.2 billion of freight, up 16.3% compared to February 2021 ($59.5B), and railways moved $15.3 billion of freight, up 19.0% from February 2021 ($12.8B).
Total Transborder Freight by Border and Mode:
|
U.S.-Canada (both directions)
(Dollars in Billions)
Truck: $29.7
Rail: $8.6
Pipeline: $9.0
Air: $2.7
Vessel: $2.9
|
U.S.-Mexico (both directions)
(Dollars in Billions)
Truck: $39.5
Rail: $6.7
Vessel: $6.1
Air: $1.5
Pipeline: $0.9
|
Truck Freight: $69.2 billion (61.5% of all transborder freight)
- U.S.-Canada: $29.7 billion (52.8% of all northern border freight)
- U.S.-Mexico: $39.5 billion (70.2% of all southern border freight)
-
Top three busiest truck border ports (43.9% of total transborder truck freight)
- Laredo, TX $17.1 billion
- Detroit, MI $7.2 billion
- Port Huron, MI $6.1 billion
-
Top three truck commodities (46.5% of total transborder truck freight)
- Computers and parts $12.9 billion
- Electrical machinery $10.5 billion
- Vehicles and parts $8.8 billion
Rail Freight: $15.3 billion (13.6% of all transborder freight)
- U.S.-Canada: $8.6 billion (15.2% of all northern border freight)
- U.S.-Mexico: $6.7 billion (11.9% of all southern border freight)
-
Top three busiest rail border ports (48.4% of total transborder rail freight)
- Laredo, TX $3.5 billion
- Port Huron, MI $2.1 billion
- Eagle Pass, TX $1.7 billion
-
Top three rail commodities (50.2% of total transborder rail freight)
- Vehicles and parts $5.2 billion
- Mineral fuels $1.3 billion
- Plastics $1.2 billion
Reporting Notes
Data in this Bureau of Transportation Statistics release are not seasonally adjusted and are not adjusted for inflation. For previous statistical releases and summary tables, see transborder releases. See transborder freight data for data from previous months, and for additional state, port, and commodity data. BTS has scheduled the release of March transborder numbers for May 25, 2022.
|
You are subscribed to email updates from the USDOT Bureau of Transportation Statistics. Subscriber Services: Manage Preferences |
|
||||||||||||