
CORRECTION: U.S. Scheduled Service Airline January 2022 Passengers Increased 33% from 2021, Decreased 34% from Pre-pandemic 2020 (Preliminary)
U.S. Department of Transportation sent this bulletin at 03/16/2022 03:19 PM EDT |
|
Having trouble viewing this email? View it as a Web page. |
U.S. Scheduled Service Airline January 2022 Passengers Increased 33% from 2021, Decreased 34% from Pre-pandemic 2020 (Preliminary)
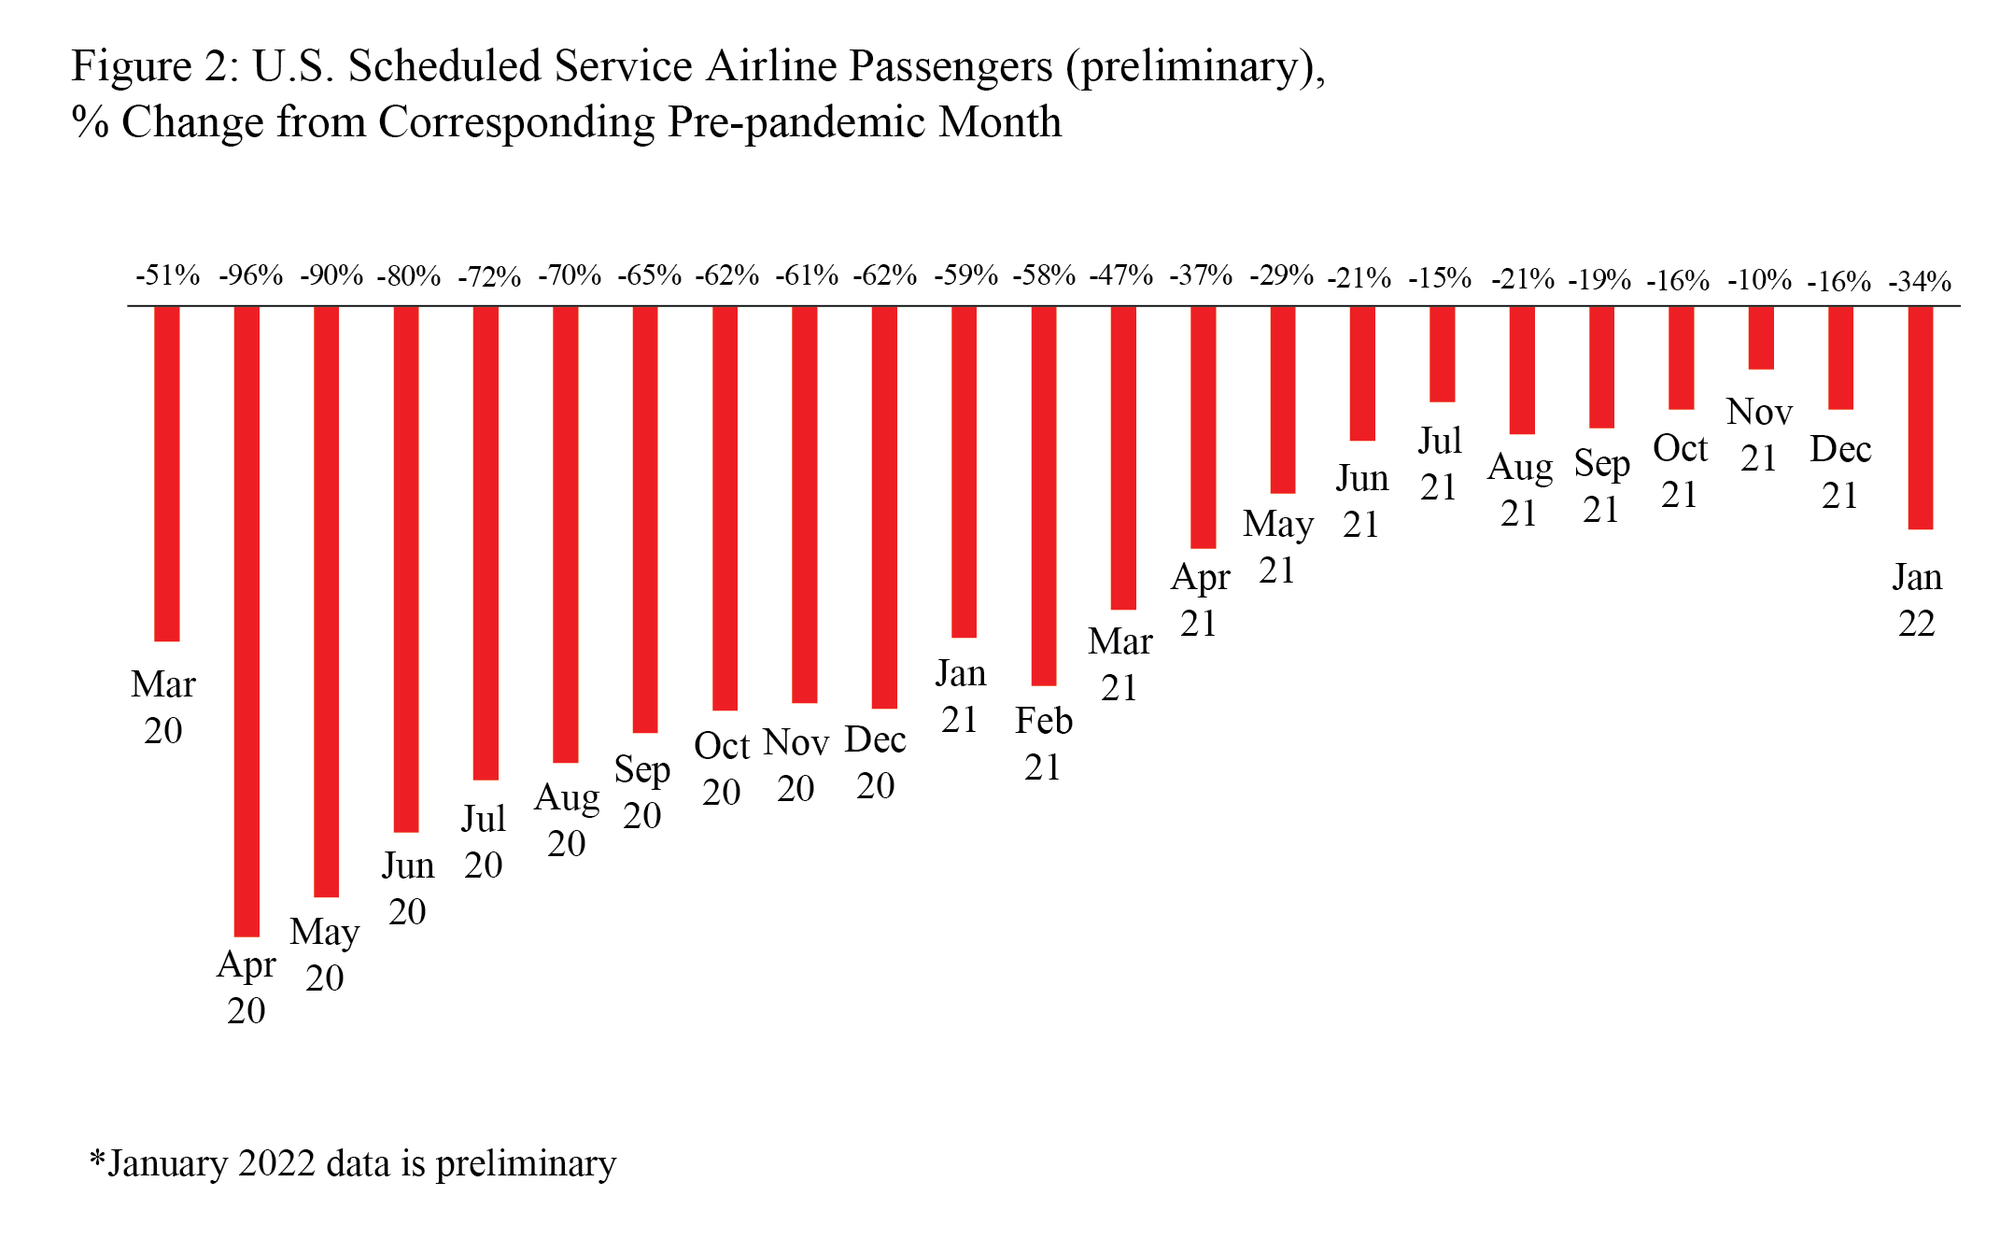
Omicron concerns drive steepest drop from most recent pre-pandemic corresponding month since April 2021
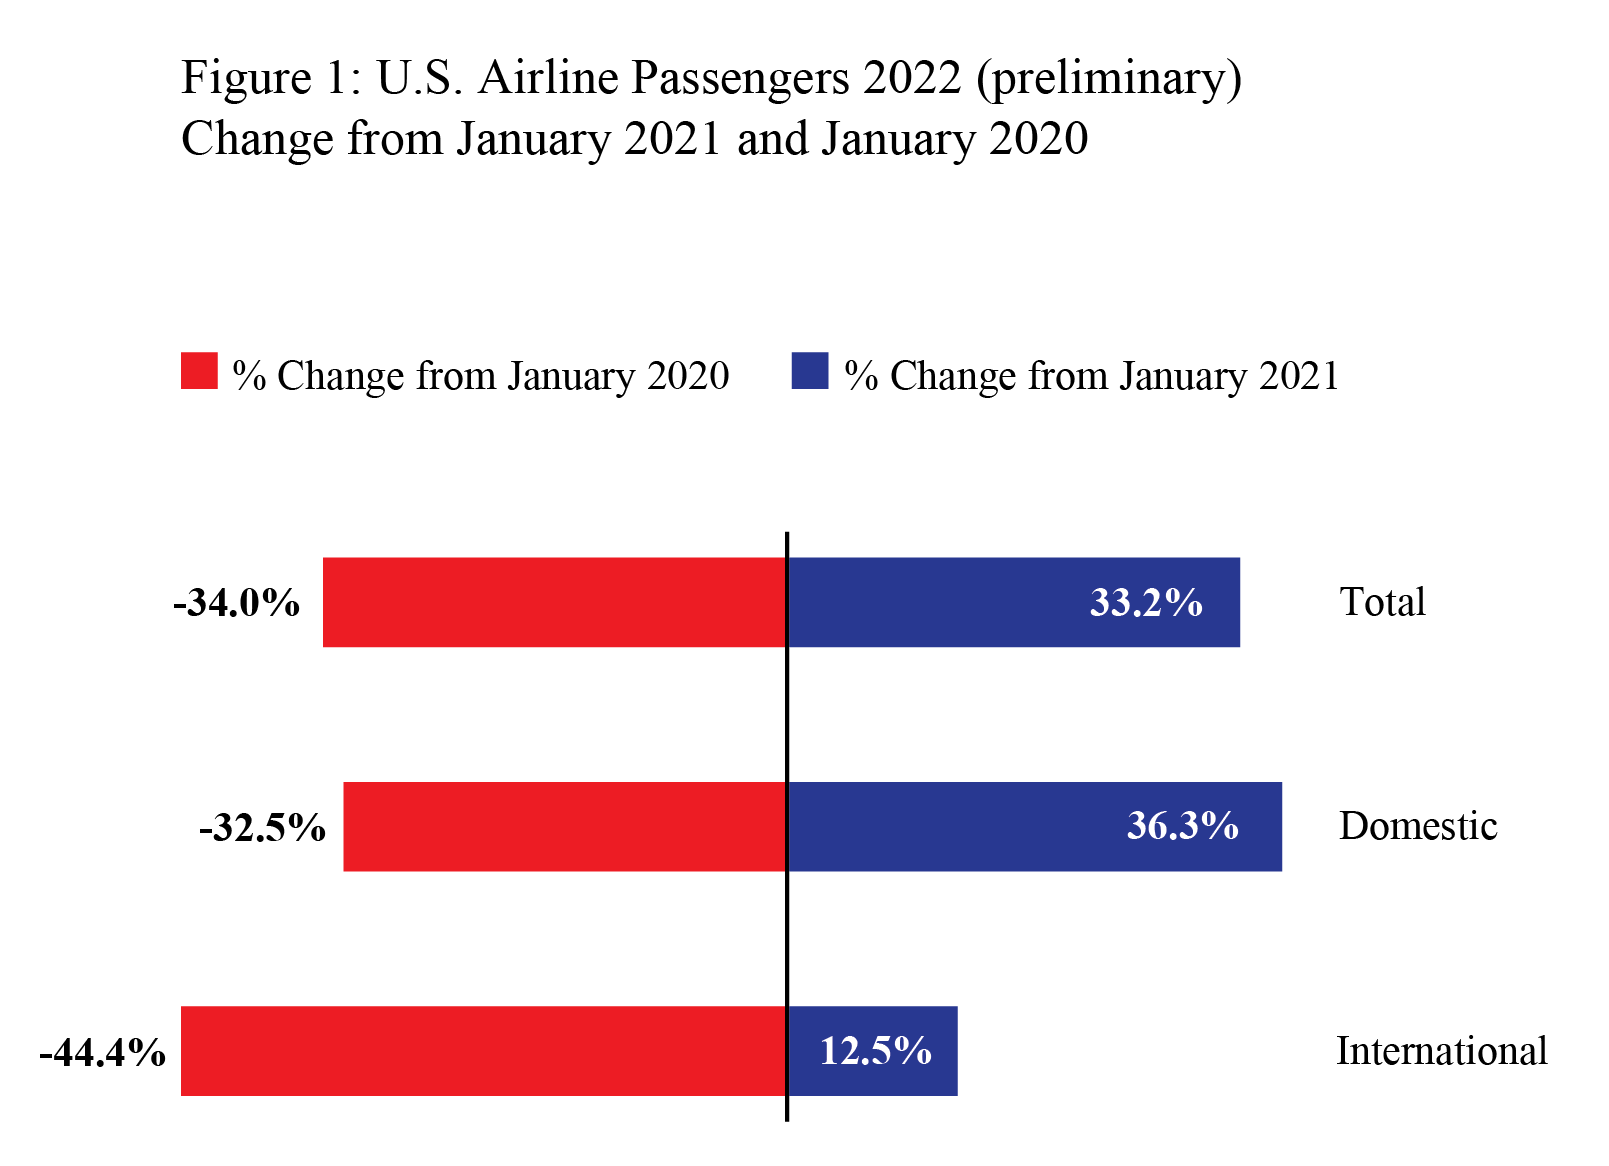
U.S. airlines carried 46.3 million scheduled service passengers in January 2022 (preliminary), 33.2% more than in January 2021 and 34.0% fewer than in pre-pandemic January 2020, according to data filed with the Bureau of Transportation Statistics (BTS) by 23 airlines that carry more than 90% of passengers. Domestic passengers (41.2 million) made up 89% of total enplanements, and international passengers (5.1 million) accounted for 11% of total enplanements.
Systemwide Passengers
- January 2022 passengers: 46.3M
- Change from January 2021: 33.2% (11.5M)
- Change from pre-pandemic January 2020: -34.0% (-23.8M)
- Change from April 2020 low: 144.9% (43.3M)
|
Table 1: Systemwide Percent Change in US Airlines Scheduled Service Passengers from the Same Month of the Previous Year, 2017 - 2022 |
|||||
|
Year-to-Year Percent Change |
|||||
|
|
2017 - 2018 |
2018 - 2019 |
2019 - 2020 |
2020 - 2021 |
2021 - 2022 |
|
January |
3.0 |
5.2 |
5.9 |
-50.5 |
33.2* |
|
February |
5.9 |
4.2 |
7.0 |
-60.6 |
- |
|
March |
4.6 |
6.3 |
-51.1 |
9.9 |
- |
|
April |
6.0 |
3.8 |
-96.0 |
1492.6 |
- |
|
May |
6.0 |
5.3 |
-90.0 |
617.3 |
- |
|
June |
6.2 |
3.7 |
-80.1 |
300.3 |
- |
|
July |
6.4 |
3.6 |
-72.2 |
206.7 |
- |
|
August |
6.2 |
3.5 |
-69.6 |
164.6 |
- |
|
September |
7.1 |
5.8 |
-65.0 |
132.5 |
- |
|
October |
5.0 |
4.3 |
-61.6 |
119.5 |
- |
|
November |
5.7 |
0.7 |
-60.4 |
128.5 |
- |
|
December |
4.8 |
9.2 |
-61.3 |
118 |
- |
|
Source: Bureau of Transportation Statistics, T-100 Market |
|
||||
|
* January 2022 data is preliminary |
|||||
Domestic Passengers
- January 2022 passengers: 41.2M
- Change from January 2021: 36.3% (11.0M)
- Change from pre-pandemic January 2020: -32.5% (-19.8M)
- Change from April 2020 low: 1343.0% (38.4M)
- Domestic percent of total January 2022 passengers: 89.1%
- Domestic percent of total January 2020 passengers: 87.0%
|
Table 2: Domestic Percent Change in US Airlines Scheduled Service Passengers from the Same Month of the Previous Year, 2017 - 2022 |
|||||
|
Year-to-Year Percent Change |
|||||
|
|
2017 - 2018 |
2018 - 2019 |
2019 - 2020 |
2020 - 2021 |
2021 - 2022 |
|
January |
3.3 |
5.2 |
6.5 |
-50.5 |
36.3* |
|
February |
6.0 |
4.2 |
7.8 |
-58.9 |
- |
|
March |
4.3 |
6.7 |
-50.8 |
14.7 |
- |
|
April |
7.0 |
3.7 |
-95.7 |
1426.7 |
- |
|
May |
6.6 |
5.2 |
-88.9 |
571.6 |
- |
|
June |
6.7 |
3.6 |
-77.7 |
272.8 |
- |
|
July |
7.2 |
3.8 |
-69.3 |
191.1 |
- |
|
August |
6.9 |
3.5 |
-66.9 |
153.3 |
- |
|
September |
7.2 |
5.9 |
-62.5 |
125.8 |
- |
|
October |
5.0 |
4.4 |
-59.7 |
115.8 |
- |
|
November |
5.8 |
0.5 |
-59.2 |
127 |
- |
|
December |
5.0 |
9.9 |
-60.7 |
118 |
- |
|
Source: Bureau of Transportation Statistics, T-100 Domestic Market |
|
||||
|
* January 2022 data is preliminary |
|||||
International Passengers
- January 2022 passengers: 5.1M
- Change from January 2021: 12.5% (563,661)
- Change from pre-pandemic January 2020: -44.4% (-4.0M)
- Change from April 2020 low: 3744.3% (4.9M)
- International percent of total January 2022 passengers: 10.9%
- International percent of total January 2020 passengers: 13.0%
Table 3: International Percent Change in US Airlines Scheduled Service Passengers from the Same Month of the Previous Year, 2017-2022
|
Year-to-Year Percent Change |
|||||
|
|
2017 - 2018 |
2018 - 2019 |
2019 - 2020 |
2020 - 2021 |
2021 - 2022 |
|
January |
1.3 |
4.7 |
2.5 |
-50.6 |
12.5* |
|
February |
4.8 |
3.7 |
1.4 |
-73.3 |
- |
|
March |
7.3 |
3.7 |
-53.1 |
-25.6 |
- |
|
April |
-0.8 |
4.7 |
-98.6 |
2924.5 |
- |
|
May |
2.4 |
5.7 |
-98.1 |
2530 |
- |
|
June |
3.3 |
4.3 |
-96.4 |
1414.6 |
- |
|
July |
1.7 |
2.4 |
-90.3 |
525.8 |
- |
|
August |
2.3 |
4.1 |
-87.4 |
360 |
- |
|
September |
6.1 |
4.9 |
-83.6 |
245.1 |
- |
|
October |
4.5 |
3.5 |
-77.1 |
171.7 |
- |
|
November |
4.9 |
2.5 |
-70.1 |
144.5 |
- |
|
December |
3.5 |
4.3 |
-65.9 |
117.8* |
- |
|
Source: Bureau of Transportation Statistics, T-100 International Market |
|
||||
|
* January 2022 data is preliminary |
|||||
Reporting Notes
U.S. airline traffic reports detailing operations, passenger traffic and freight traffic are filed monthly with BTS by commercial U.S. carriers. This release includes data received by BTS from U.S. scheduled passenger service airlines as of March 11, 2022. None of the data are from samples. Measures of statistical significance do not apply to the complete air traffic data.
Final January data is scheduled for release on April 14. Complete international data by origin and destination, which is under a six-month confidentiality restriction, will be released on July 15.
See the BTS Airlines and Airport page for additional U.S. airlines numbers through December for U.S. airlines. International data by origin and destination is available through September.
|
You are subscribed to email updates from the USDOT Bureau of Transportation Statistics. Subscriber Services: Manage Preferences |
|
||||||||||||