
U.S. Airlines Carried 3% More Cargo in September 2021 than in September 2020 (Preliminary)
U.S. Department of Transportation sent this bulletin at 11/22/2021 11:18 AM EST |
|
Having trouble viewing this email? View it as a Web page. |
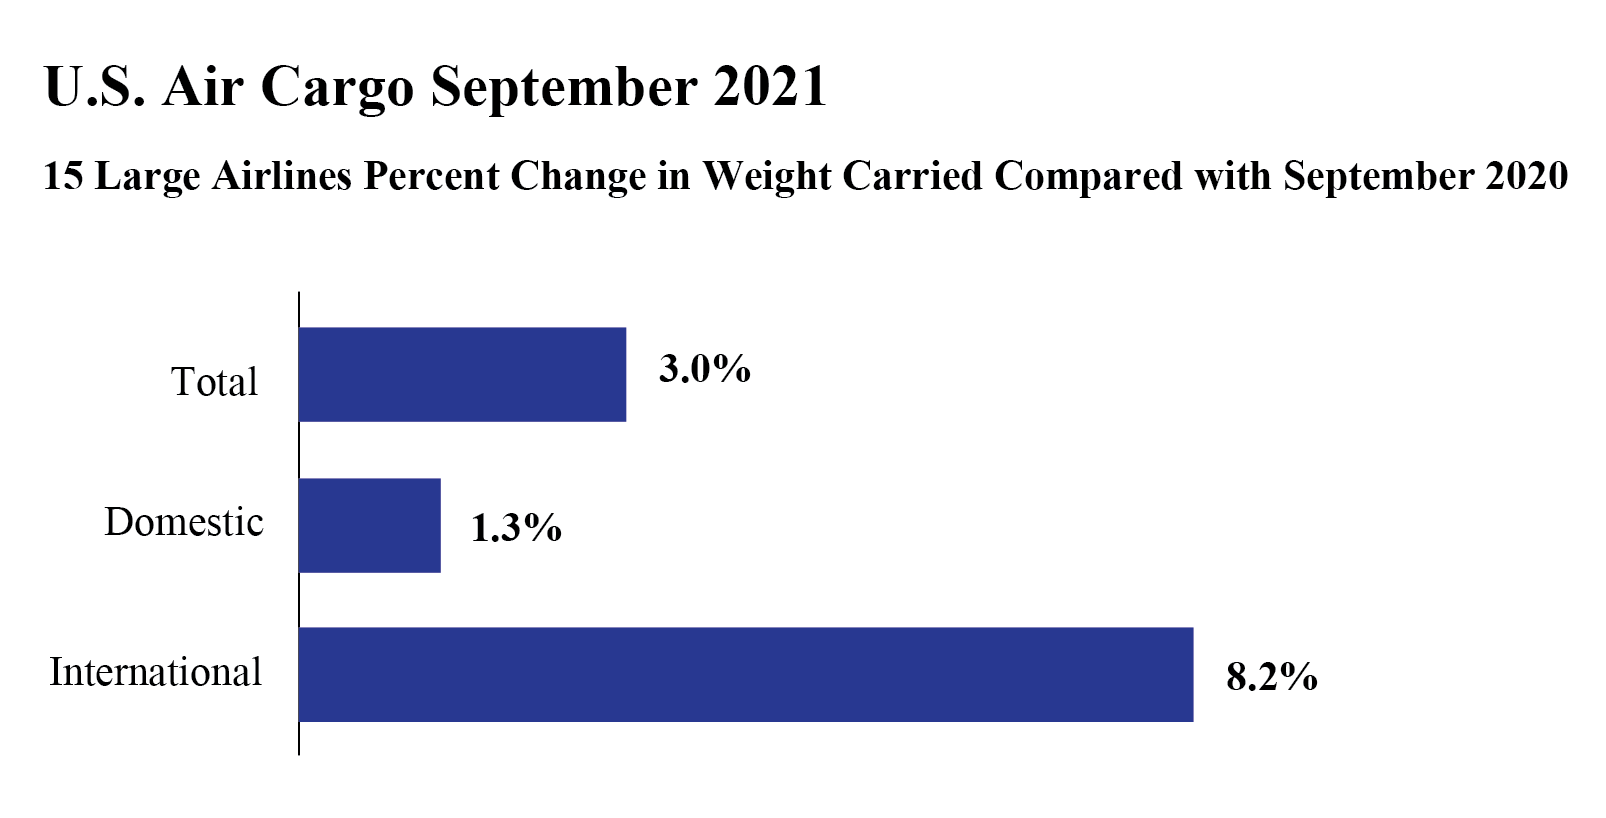
U.S. Airlines carried 1,675 thousand tons of cargo in September, a 3% increase from September 2020 according to data filed with the Bureau of Transportation Statistics (BTS) by 15 of the leading U.S. cargo airlines. The year-over-year rise was fueled by an 8.2% increase in international cargo carried (27% of all cargo). Domestic cargo carried (73% of all cargo), increased by 1.3%.
The 15 airlines carry 95% of the total cargo by weight transported on U.S. airlines. Cargo data consists of freight and mail carried within the U.S. and between the U.S. and foreign points.
September 2021 (preliminary) air cargo numbers for 15 U.S. cargo carriers:
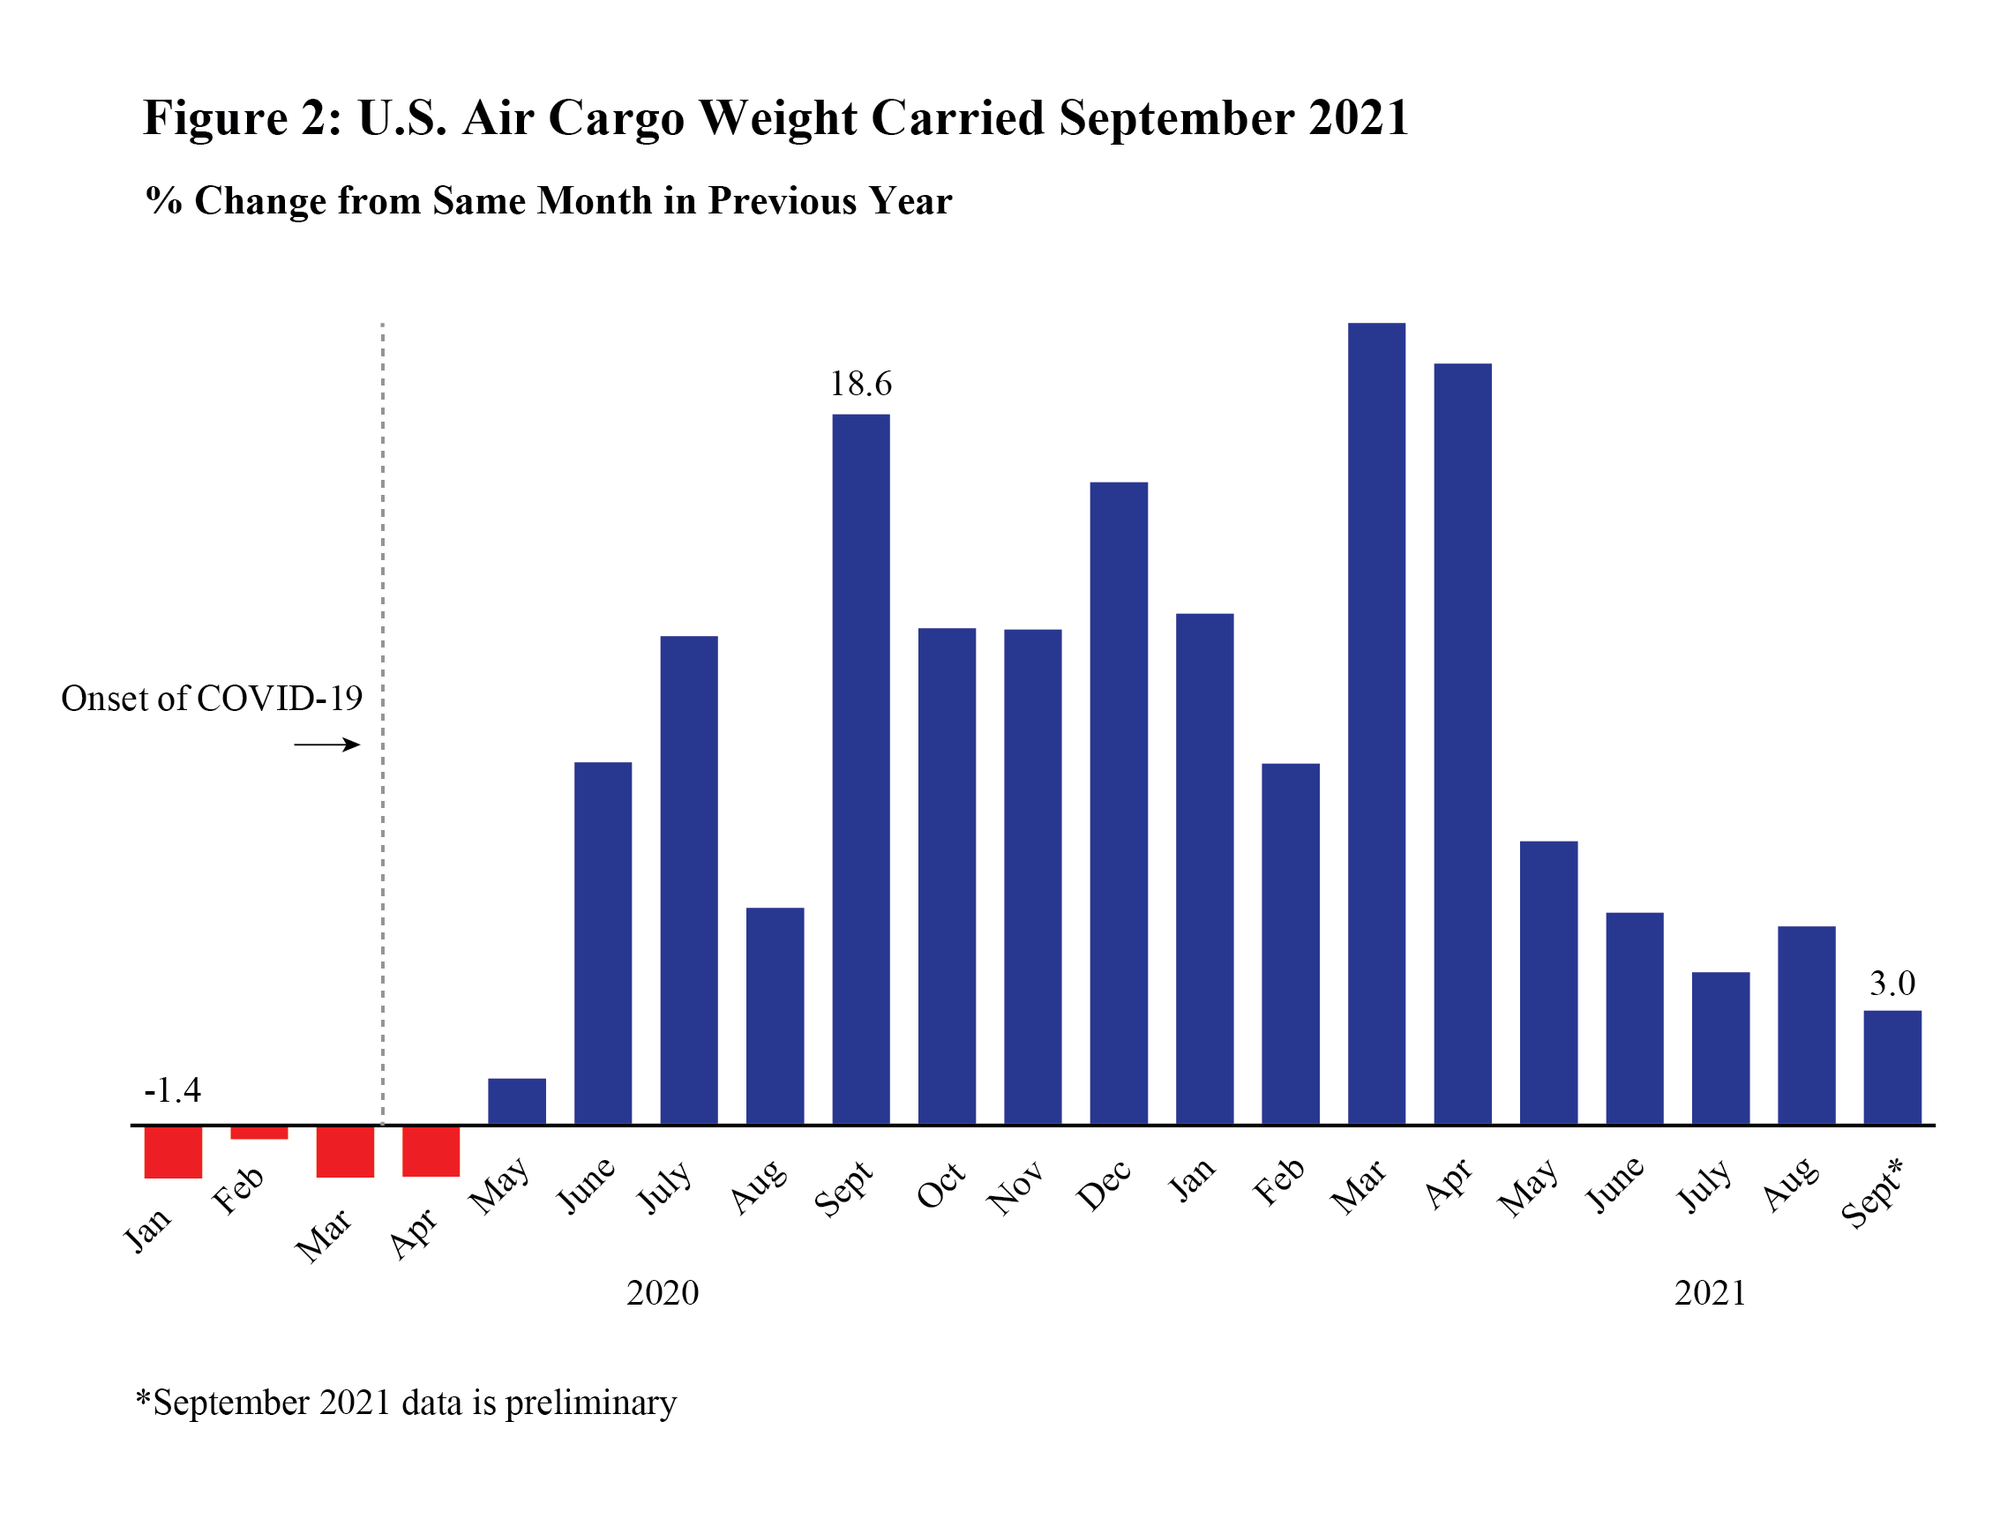
- Total: 1,675 thousand tons, up 3.0% from September 2020 (1,625T tons)
- Domestic: 1,227 thousand tons, up 1.3% from September 2020 (1,212T tons)
- International: 447 thousand tons, up 8.2% from September 2020 (413T tons)
U.S. airline traffic reports are filed monthly with BTS. Final September data will be released on December 16. Complete international data by origin and destination, which is under a six-month confidentiality restriction, will be released in February 2022.
Systemwide Cargo (Domestic + International)
- September 2021 cargo: 1,675T tons
- Change from September 2020: +3%
- Change from August 2021: +0.8%
- Recent high: December 2020 (1,854T tons)
- Recent low: February 2020 (1,255T tons)
|
Year-to-Year Percent Change |
||||
|
|
2017 - 2018 |
2018 - 2019 |
2019 - 2020 |
2020 - 2021 |
|
January |
10.6 |
4.9 |
-1.4 |
13.4 |
|
February |
9.3 |
-0.4 |
-0.4 |
9.5 |
|
March |
5.7 |
-0.3 |
-1.4 |
21.0 |
|
April |
5.7 |
4.5 |
-1.3 |
20.0 |
|
May |
9.0 |
3.1 |
1.2 |
7.4 |
|
June |
5.6 |
-1.2 |
9.5 |
5.6 |
|
July |
6.6 |
3.6 |
12.8 |
4.0 |
|
August |
4.8 |
0.2 |
5.7 |
5.2 |
|
September |
4.9 |
-4.5 |
18.6 |
3.0 |
|
October |
5.7 |
-1.2 |
13.0 |
- |
|
November |
-0.7 |
-2.2 |
13.0 |
- |
|
December |
0.2 |
0.7 |
16.9 |
- |
|
YTD Jan - Sep |
6.8 |
1.1 |
4.8 |
9.6 |
|
Annual |
5.4 |
0.5 |
7.3 |
- |
Domestic Cargo
- September 2021 cargo: 1,227T tons
- Change from September 2020: +1.3%
- Change from August 2021: +0.5%
- Recent high: December 2020 (1,420T tons)
- Recent low: February 2020 (944T tons)
- Domestic as percent of total cargo September 2020: 6%
- Domestic as percent of total cargo September 2021: 3%
|
Year-to-Year Percent Change |
|||||
|
|
2017 - 2018 |
2018 - 2019 |
2019 - 2020 |
2020 - 2021 |
|
|
January |
10.3 |
6.2 |
0.5 |
12.5 |
|
|
February |
9.0 |
0.7 |
1.9 |
4.7 |
|
|
March |
3.9 |
-0.2 |
3.4 |
15.9 |
|
|
April |
4.9 |
8.2 |
3.8 |
12.6 |
|
|
May |
9.0 |
4.6 |
4.7 |
2.0 |
|
|
June |
4.6 |
0.7 |
13.3 |
2.6 |
|
|
July |
6.7 |
6.7 |
15.8 |
1.1 |
|
|
August |
4.7 |
0.2 |
7.2 |
4.0 |
|
|
September |
4.1 |
-2.8 |
21.7 |
1.3 |
|
|
October |
6.1 |
1.7 |
14.3 |
- |
|
|
November |
-0.4 |
-1.6 |
13.6 |
- |
|
|
December |
0.1 |
4.6 |
15.9 |
- |
|
|
YTD Jan - Sep |
6.2 |
2.6 |
8.0 |
6.1 |
|
|
Annual |
5.0 |
2.4 |
9.8 |
- |
|
International Cargo
- September 2021 cargo: 447T tons
- Change from September 2020: +8.2%
- Change from August 2021: +1.6%
- Recent high: November 2020 (447T tons)
- Recent low: February 2020 (311T tons)
- Domestic as percent of total cargo September 2020: 4%
- Domestic as percent of total cargo September 2021: 7%
|
Year-to-Year Percent Change |
|||||
|
|
2017 - 2018 |
2018 - 2019 |
2019 - 2020 |
2020 - 2021 |
|
|
January |
11.3 |
1.5 |
-6.7 |
16.0 |
|
|
February |
10.2 |
-3.4 |
-6.7 |
24.0 |
|
|
March |
10.6 |
-0.5 |
-13.6 |
36.9 |
|
|
April |
7.7 |
-4.5 |
-15.4 |
44.6 |
|
|
May |
8.9 |
-1.0 |
-8.4 |
24.6 |
|
|
June |
8.4 |
-5.7 |
-0.7 |
14.5 |
|
|
July |
6.5 |
-4.1 |
4.5 |
12.9 |
|
|
August |
5.2 |
0.1 |
1.6 |
8.9 |
|
|
September |
6.8 |
-8.8 |
10.5 |
8.2 |
|
|
October |
4.6 |
-8.7 |
9.5 |
- |
|
|
November |
-1.5 |
-3.7 |
11.4 |
- |
|
|
December |
0.4 |
-10.7 |
20.1 |
- |
|
|
YTD Jan - Sep |
8.3 |
-3.0 |
-3.9 |
20.3 |
|
|
Annual |
6.4 |
-4.2 |
0.4 |
- |
|
Reporting Notes
Data are compiled from monthly reports filed with BTS by commercial U.S. air carriers detailing operations, passenger traffic and freight traffic. This release includes data received by BTS from 15 U.S. airlines as of November 16, 2021.
See the BTS Airlines and Airports page for additional U.S. airlines numbers through August 2021 for U.S. airlines. International data by origin and destination is available through May 2021.
None of the data are from samples. Measures of statistical significance do not apply to the complete air traffic data. Numbers in this release are not seasonally adjusted.
|
You are subscribed to email updates from the USDOT Bureau of Transportation Statistics. Subscriber Services: Manage Preferences |
|
||||||||||||