
U.S. Airlines July 2021 Passengers (Preliminary) Increase 207% from July 2020, but Remain 15% Below Pre-Pandemic July 2019
U.S. Department of Transportation sent this bulletin at 09/16/2021 11:16 AM EDT |
|
Having trouble viewing this email? View it as a Web page. |
U.S. Airlines July 2021 Passengers (Preliminary) Increase 207% from July 2020, but Remain 15% Below Pre-Pandemic July 2019
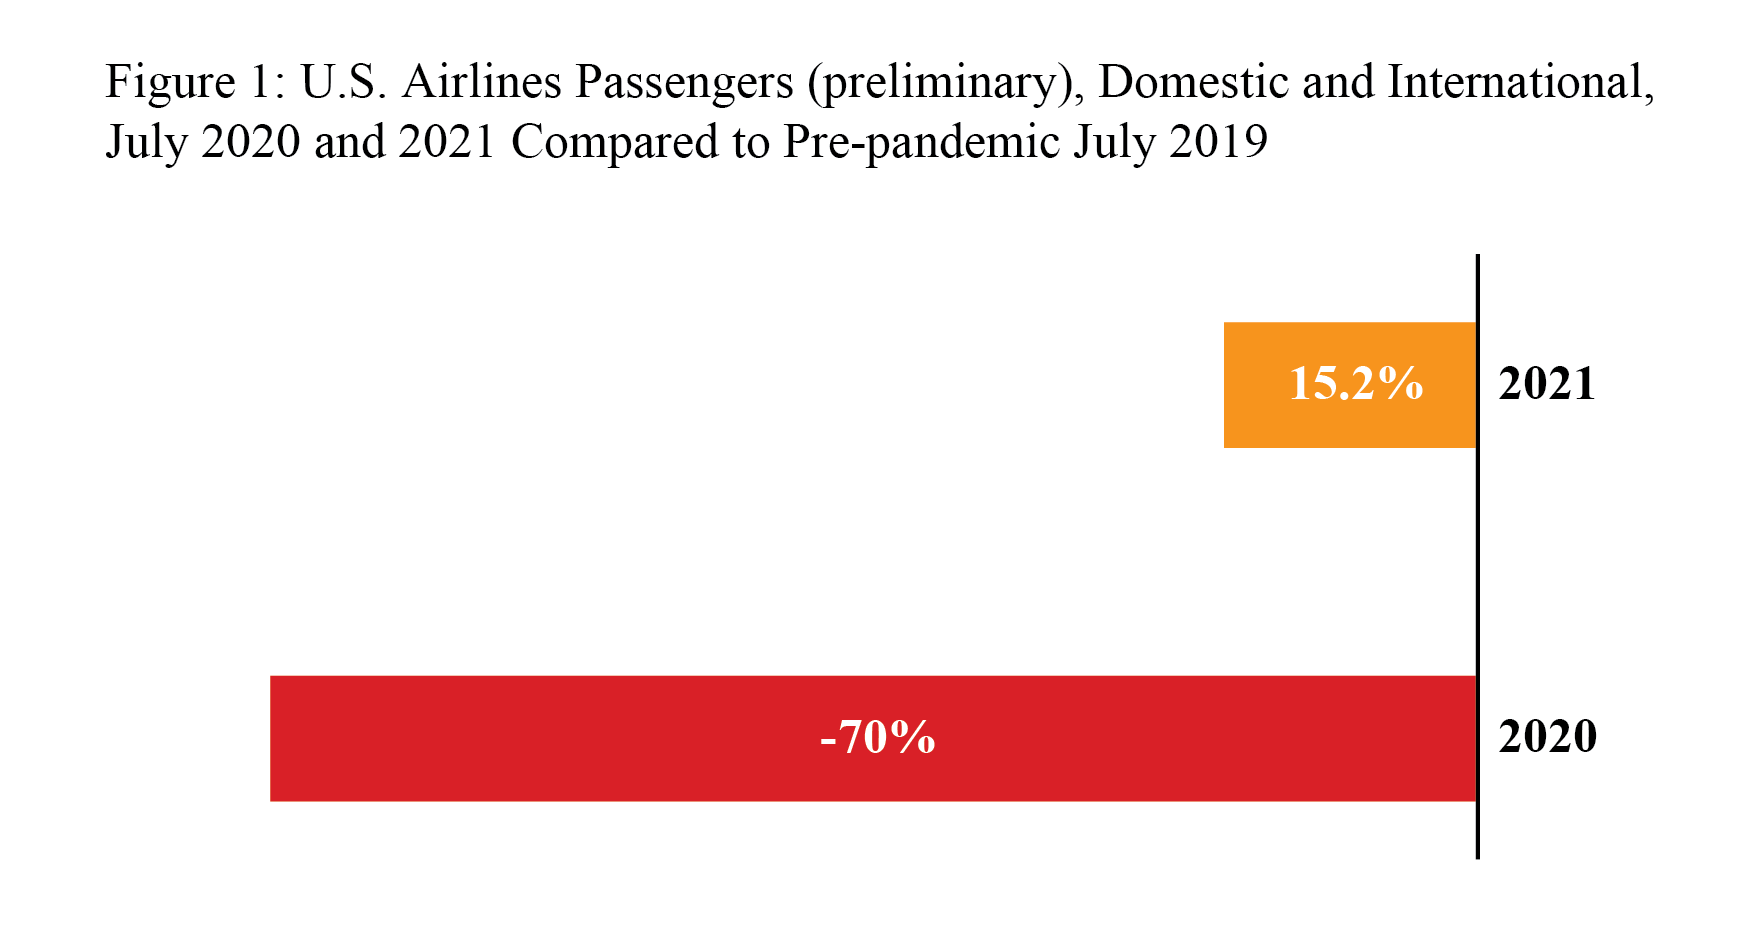
U.S. airlines carried 207% more scheduled service passengers in July 2021 than in July 2020 (preliminary) but 15% fewer passengers than in pre-pandemic July 2019, according to data filed with the Bureau of Transportation Statistics (BTS) by 24 airlines that carry more than 90% of passengers.
The large airlines carried 73.4 million passengers in July 2021 (preliminary), compared to 23.9 million passengers in July 2020, which was the lowest monthly total in BTS records dating back to 1974. The previous low was 14.6 million passengers in February 1975. In the most recent corresponding month before the COVID-19 pandemic, July 2019, U.S. airlines carried 86.5 million passengers.
Preliminary July 2021 passenger numbers (22 carriers reporting):
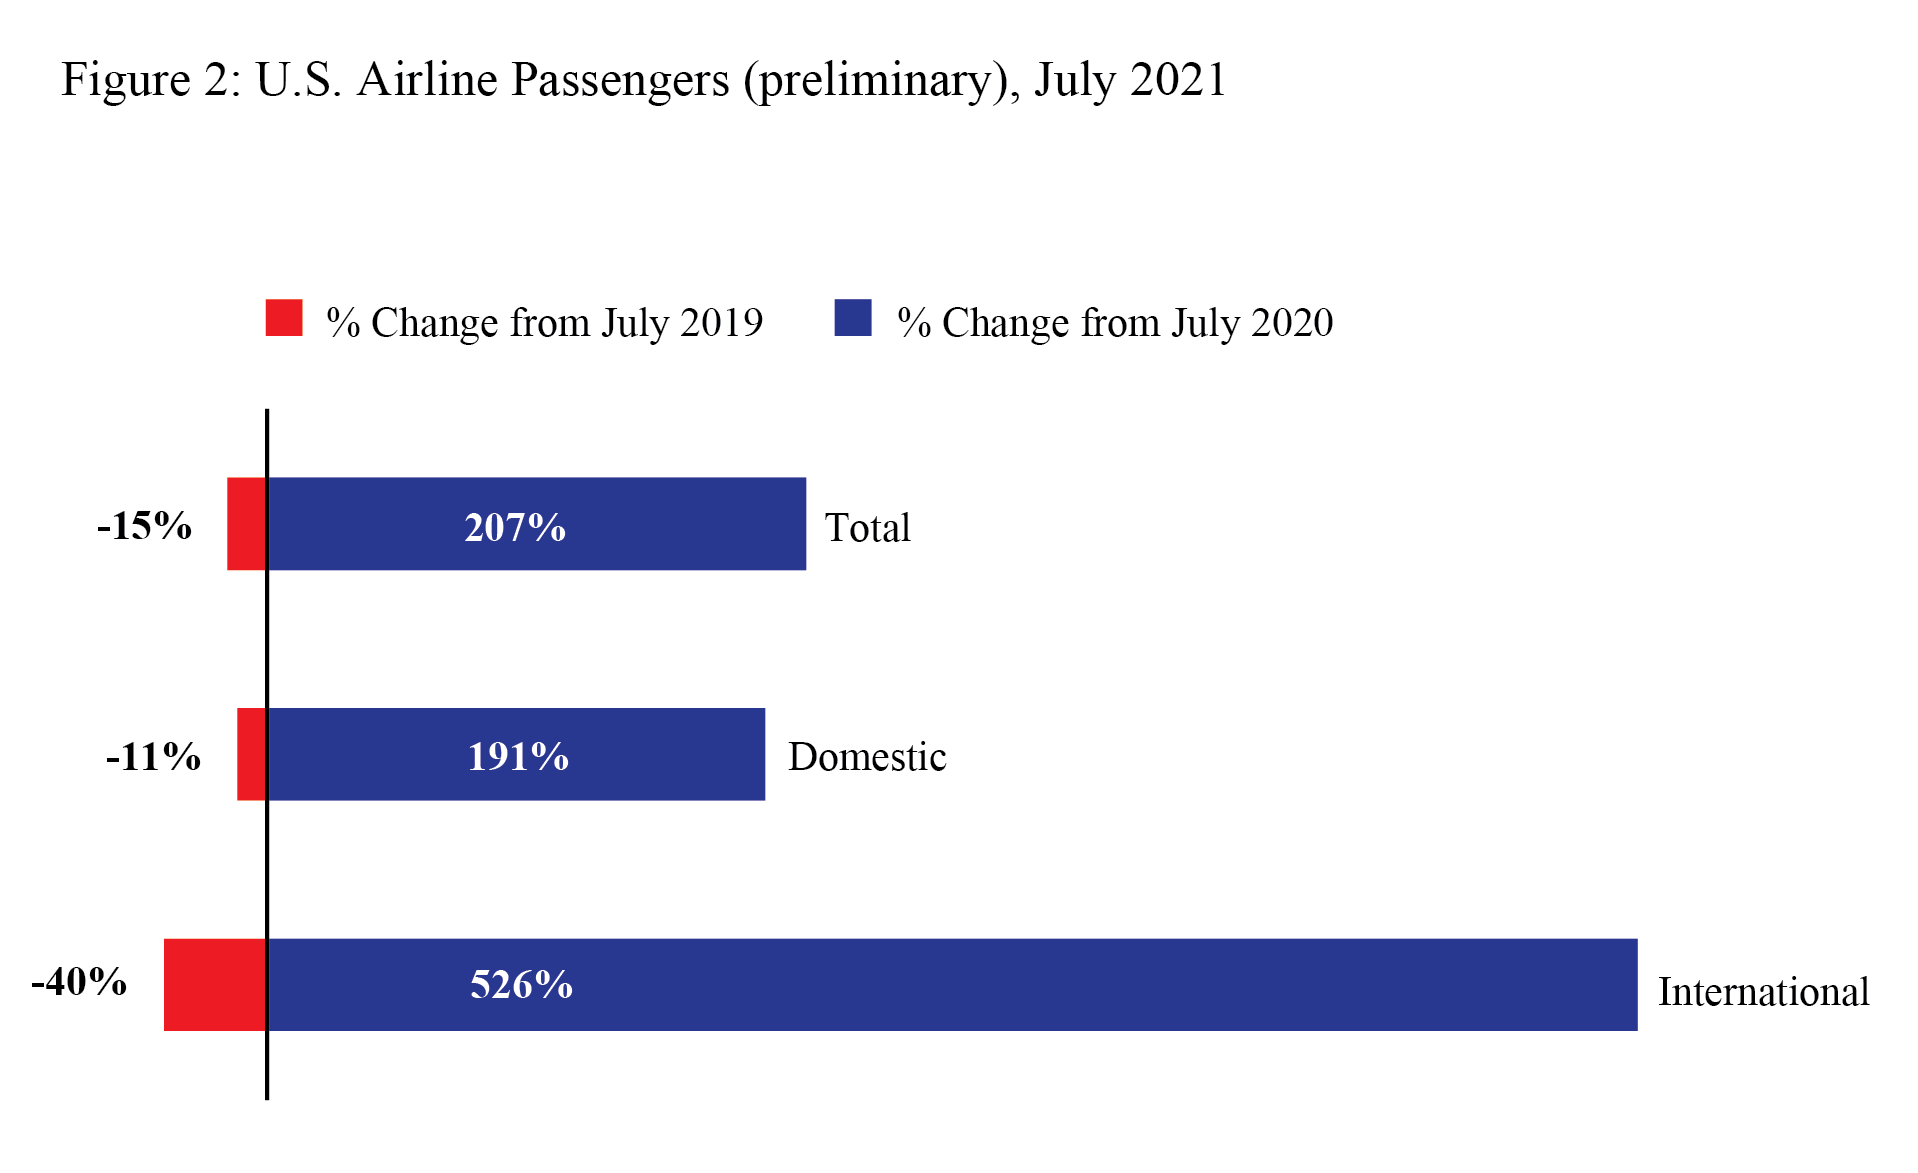
- Total: 73.4 million passengers, up 207% from July 2020 (23.9M), down 15% from July 2019 (86.5M)
- Domestic: 66.4 million passengers, up 191% from July 2020 (22.8M), down 11% from July 2019 (74.9M)
- International: 7 million passengers, up 526% from July 2020 (1.1M), down 40% from July 2019 (11.6M)
U.S. airline traffic reports are filed monthly with BTS. Final July data will be released on October 15. Complete international data by origin and destination, which is under a six-month confidentiality restriction, will be released in January 2022.
|
Systemwide Passengers |
|
· July 2021 passengers: 73.4M |
|
· Change from July 2020: 207% |
|
· Percent of 2020 passengers: 307% |
|
· Change from April 2020 low: +70.4M passengers · Change from July 2019: -15% |
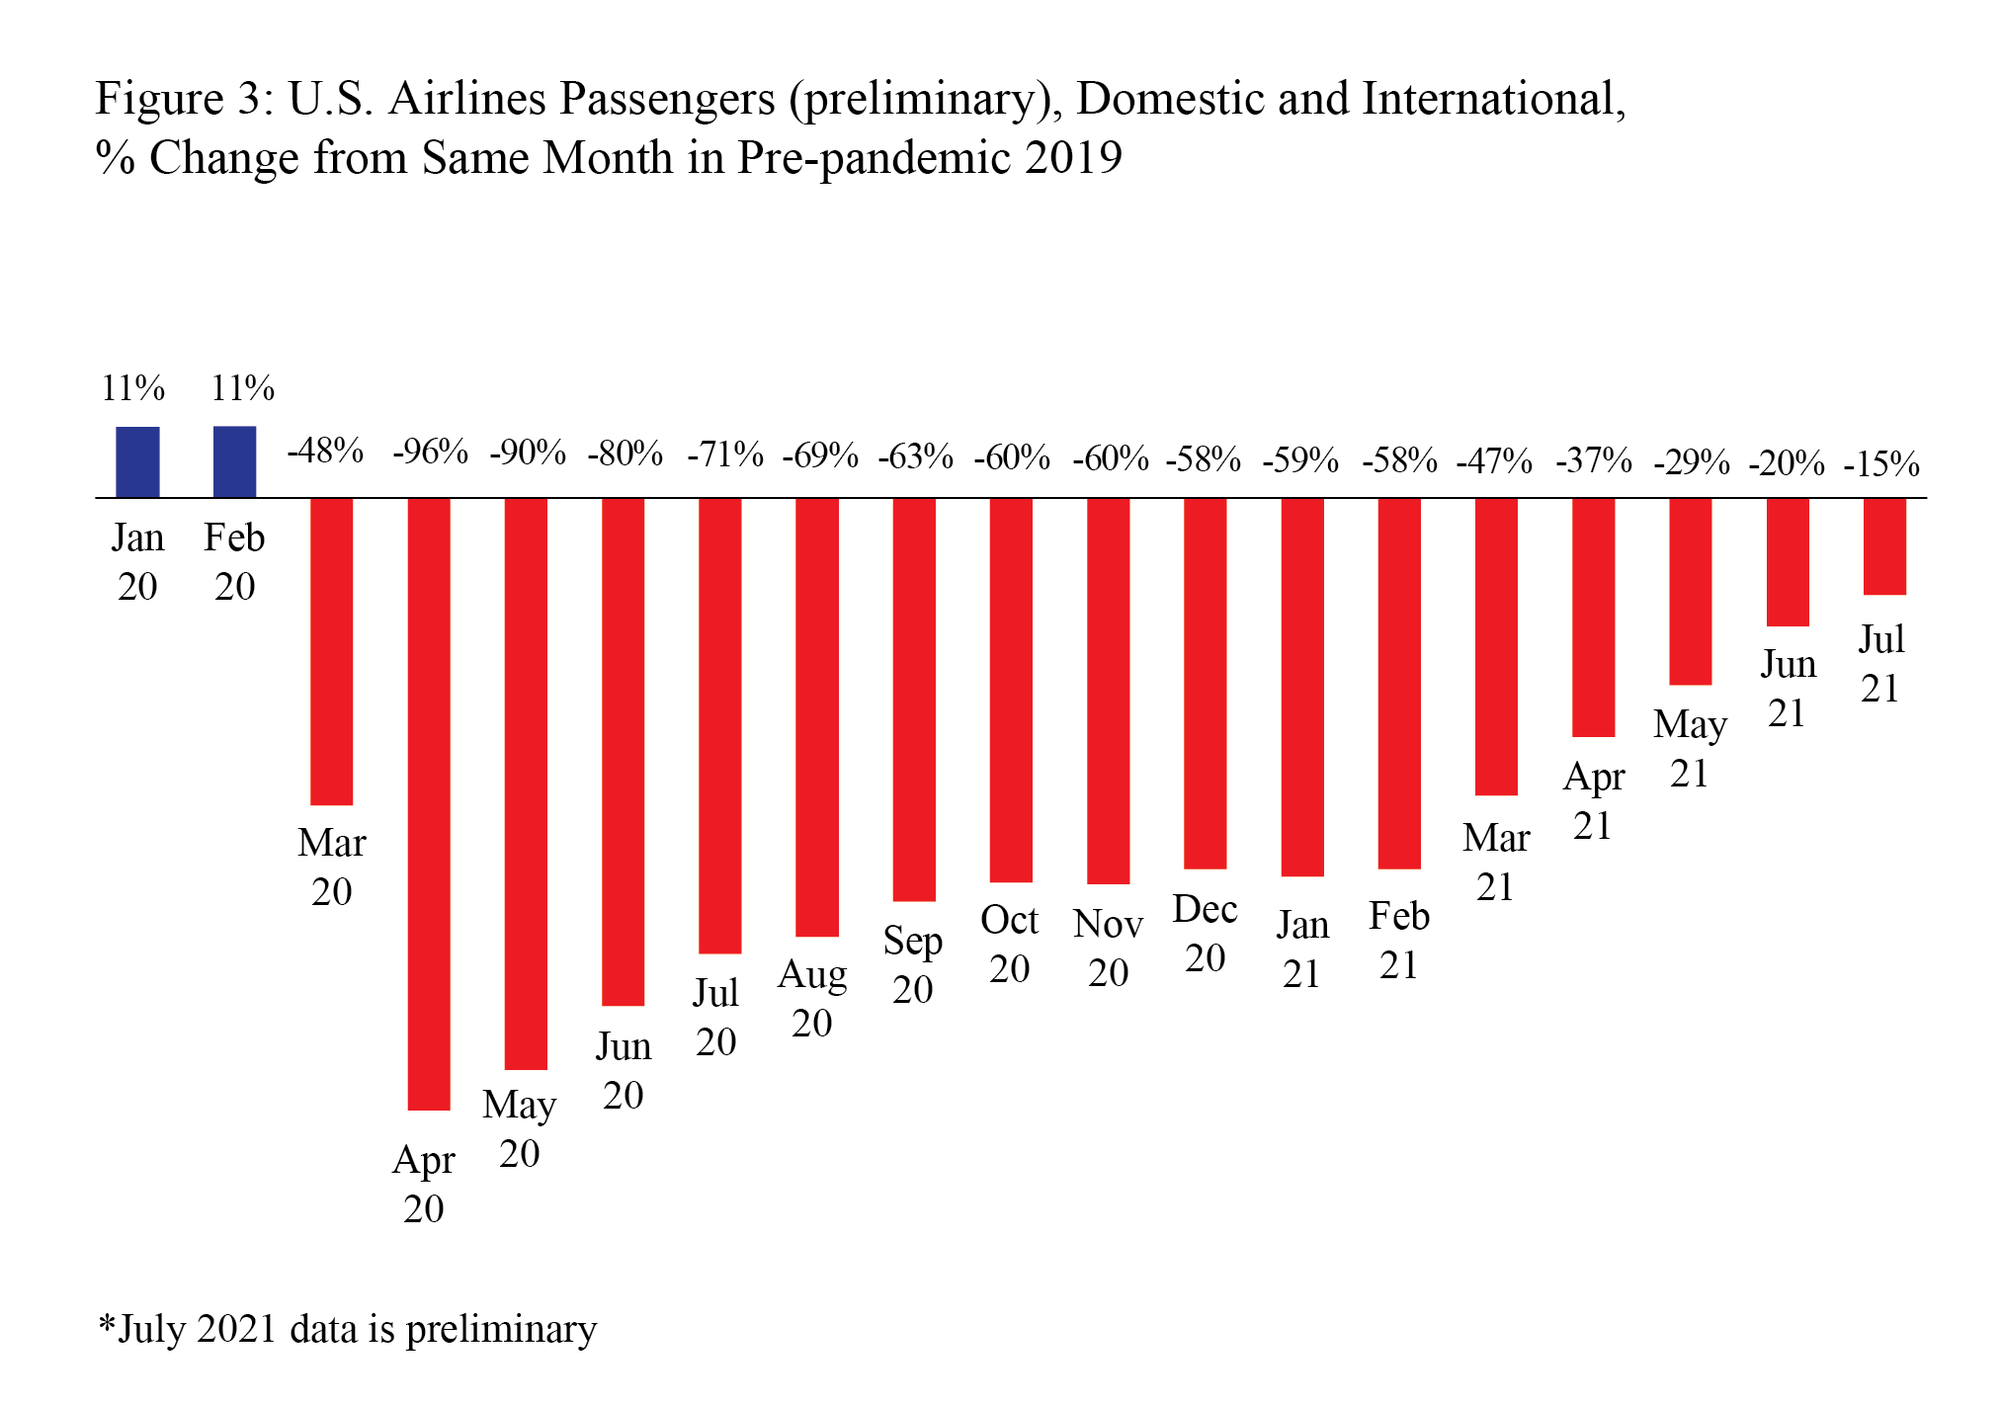
Table 1: Systemwide Percent Change in US Airlines Scheduled Service Passengers from the Same Month of the Previous Year, 2017-2021
|
Year-to-Year Percent Change |
||||
|
|
2017 - 2018 |
2018 - 2019 |
2019 - 2020 |
2020 - 2021 |
|
January |
3.0 |
5.2 |
5.7 |
-61.5 |
|
February |
5.8 |
4.2 |
6.7 |
-60.8 |
|
March |
4.6 |
6.4 |
-51.3 |
9.5 |
|
April |
6.0 |
3.9 |
-96.1 |
1492.3 |
|
May |
6.1 |
5.3 |
-90.1 |
614.9 |
|
June |
6.2 |
3.7 |
-80.3 |
305.6 |
|
July |
6.4 |
3.7 |
-72.4 |
206.7* |
|
August |
6.3 |
3.5 |
-69.8 |
|
|
September |
7.1 |
5.7 |
-65.2 |
|
|
October |
5.0 |
4.2 |
-61.8 |
|
|
November |
5.7 |
0.5 |
-60.7 |
|
|
December |
4.8 |
8.9 |
-61.5 |
|
|
Jan - Jul |
5.5 |
4.6 |
-57.5 |
49.4 |
|
Annual |
5.6 |
4.6 |
-60.2 |
|
Domestic Passengers
- July 2021 passengers: 4M
- Change from July 2020: 191%
- Percent of 2020 passengers: 291%
- Change from April 2020 low: +63.5M passengers
- Change from July 2019: -11%
- Domestic percent of total July 2021 passengers: 91%
- Domestic percent of total July 2020 passengers: 98%
Table 2: Domestic Percent Change in US Airlines Scheduled Service Passengers from the Same Month of the Previous Year, 2017-2021
|
Year-to-Year Percent Change |
||||
|
|
2017 - 2018 |
2018 - 2019 |
2019 - 2020 |
2020 - 2021 |
|
January |
3.3 |
5.3 |
6.2 |
-60.6 |
|
February |
6.0 |
4.2 |
7.5 |
-59.1 |
|
March |
4.2 |
6.7 |
-51.0 |
14.3 |
|
April |
7.0 |
3.8 |
-95.7 |
1426.5 |
|
May |
6.6 |
5.3 |
-89.0 |
569.1 |
|
June |
6.6 |
3.6 |
-77.9 |
277.3 |
|
July |
7.2 |
3.9 |
-69.6 |
191.1* |
|
August |
6.9 |
3.5 |
-67.1 |
|
|
September |
7.2 |
5.9 |
-62.7 |
|
|
October |
5.0 |
4.3 |
-59.9 |
|
|
November |
5.8 |
0.3 |
-59.4 |
|
|
December |
5.0 |
9.6 |
-60.9 |
|
|
Jan - Jul |
5.9 |
4.7 |
-56.3 |
51.6 |
|
Annual |
5.9 |
4.6 |
-58.7 |
|
International Passengers
- June 2021 passengers: 1M
- Change from June 2020: 1450%
- Percent of 2020 passengers: 1550%
- Change from April 2020 low: +6M passengers
- Change from July 2019: -40%
- International percent of total July 2021 passengers: 9%
- International percent of total July 2020 passengers: 2%
Table 3: International Percent Change in US Airlines Scheduled Service Passengers from the Same Month of the Previous Year, 2017-2021
|
Year-to-Year Percent Change |
||||
|
|
2017 - 2018 |
2018 - 2019 |
2019 - 2020 |
2020 - 2021 |
|
January |
1.3 |
4.8 |
2.1 |
-67.5 |
|
February |
4.8 |
3.8 |
1.0 |
-73.4 |
|
March |
7.4 |
3.8 |
-53.3 |
-25.7 |
|
April |
-0.6 |
4.7 |
-98.6 |
2923.3 |
|
May |
2.7 |
5.7 |
-98.1 |
2528.7 |
|
June |
3.7 |
4.3 |
-96.4 |
1450.8 |
|
July |
1.9 |
2.3 |
-90.4 |
525.8* |
|
August |
2.5 |
3.9 |
-87.5 |
|
|
September |
6.3 |
4.7 |
-83.7 |
|
|
October |
4.6 |
3.4 |
-77.3 |
|
|
November |
5.0 |
2.4 |
-70.3 |
|
|
December |
3.6 |
4.0 |
-66.0 |
|
|
Jan - Jul |
3.0 |
4.1 |
-65.7 |
30.1 |
|
Annual |
3.5 |
4.0 |
-70.4 |
|
Reporting Notes
Data are compiled from monthly reports filed with BTS by commercial U.S. air carriers detailing operations, passenger traffic and freight traffic. This release includes data received by BTS from U.S. airlines as of September 13.
See the BTS Airlines and Airport page for additional U.S. airlines numbers through June 2021 for U.S. airlines. International data by origin and destination is available through March 2021.
None of the data are from samples. Measures of statistical significance do not apply to the complete air traffic data.
|
You are subscribed to DOT email updates. Subscriber Services: Manage Preferences |
|
||||||||||||
