
BTS Updates 15 Tables in National Transportation Statistics
U.S. Department of Transportation sent this bulletin at 07/01/2021 09:01 AM EDT |
|
Having trouble viewing this email? View it as a Web page.
|
BTS Updates 15 Tables in National Transportation Statistics
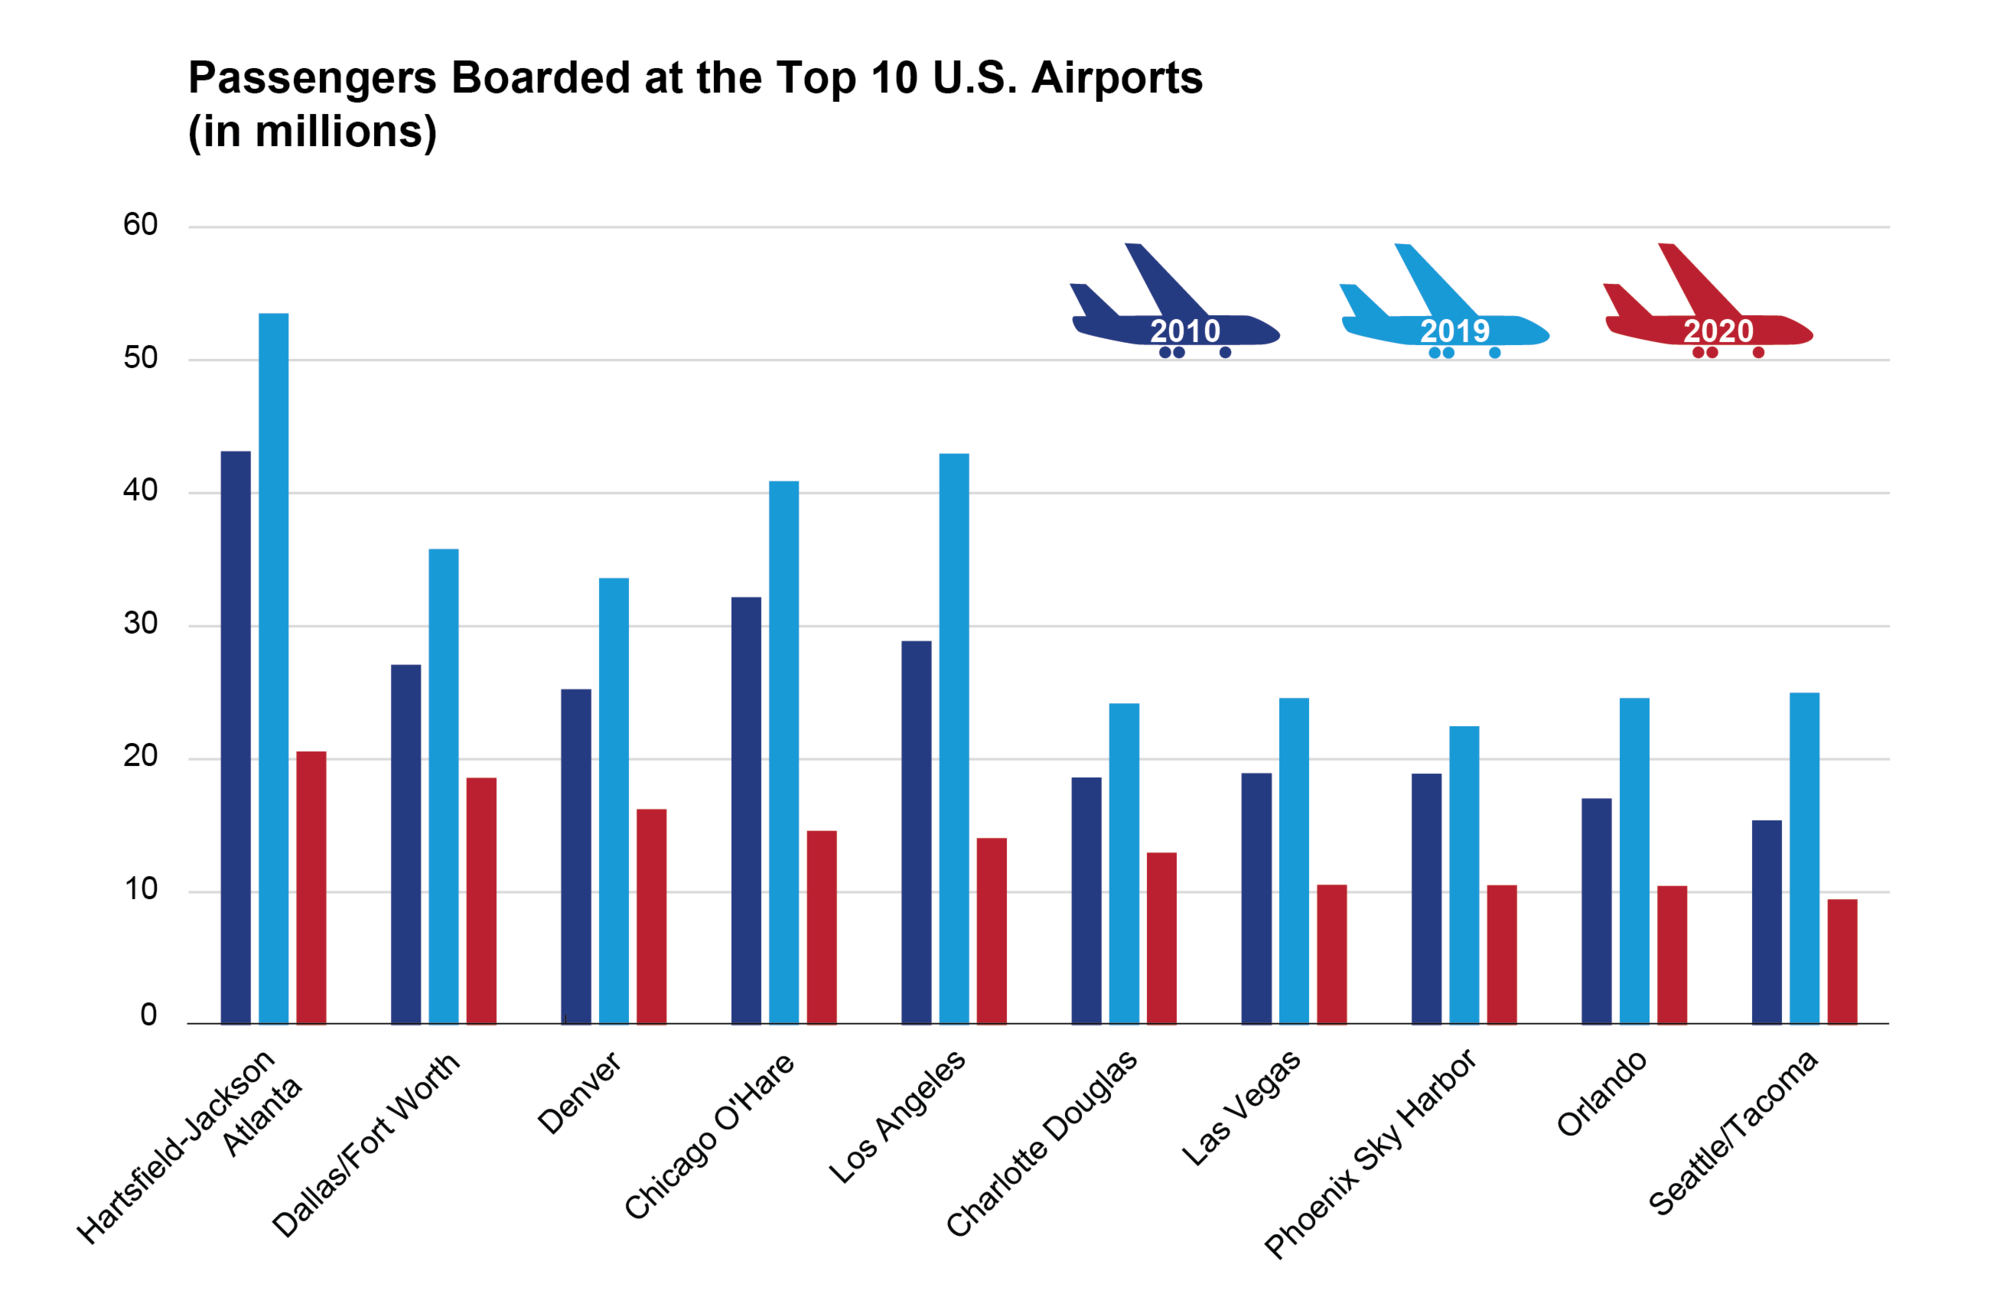
National Transportation Statistics (NTS), the Bureau of Transportation Statistics’ guide to historical national-level transportation trends, was updated today with 15 transportation-related tables including Passengers Boarded at the Top 50 US Airports.
Updated Tables by Topics:
Condition
- Airport Runway Pavement Conditions (1-25)
Travel and Goods Movement
- U.S. Air Carrier Aircraft Departures, Enplaned Revenue Passengers, and Enplaned Revenue Tons (1-37)
- Passengers Boarded at the Top 50 U.S. Airports (1-44)
- Air Passenger Travel Arrivals in the United States from Selected Foreign Countries (1-45)
- Air Passenger Travel Departures from the United States to Selected Foreign Countries (1-46)
Air Safety
- Number of Pilot-Reported Near Midair Collisions by Degree of Hazard (2-15)
Transportation Revenues, Employment, and Productivity
- Employment in For-Hire Transportation and Selected Transportation-Related Industries (3-23)
Government Finance
- Cash Balances of the Transportation-Related Federal Trust Funds, Fiscal Year (3-34)
Transportation Energy Intensity and Fuel Efficiency
Air Pollution
- Estimated U.S. Average Vehicle Emissions Rates per Vehicle by Vehicle Type Using Gasoline and Diesel (4-43)
- Air Pollution Trends in Selected Metropolitan Statistical Areas (4-51)
- U.S. Carbon Dioxide Emissions from Energy Use by Sector (4-53)
Water Pollution, Noise, and Solid Waste
- Petroleum Oil Spills Impacting Navigable U.S. Waters (4-54)
Modal Profiles
Contact: Dave Smallen
david.smallen@dot.gov
|
You are subscribed to DOT email updates. Subscriber Services: Manage Preferences |
|
||||||||||||
