
Average Air Fares Dropped to All-Time Low in 2020
U.S. Department of Transportation sent this bulletin at 04/20/2021 11:27 AM EDT |
|
Having trouble viewing this email? View it as a Web page.
|
Average Air Fares Dropped to All-Time Low in 2020
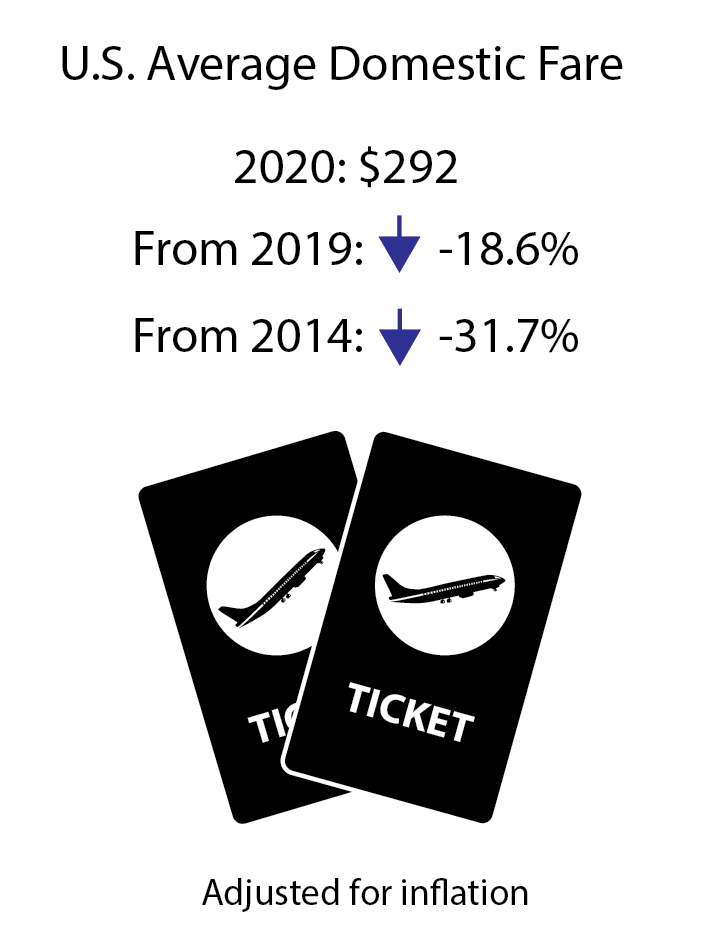
The 2020 average domestic itinerary air fare of $292 was the lowest inflation-adjusted annual fare since the Bureau of Transportation Statistics began collecting such records in 1995, down 19% from the previous low of $359 in 2019.
In 2020, 131 million originating passengers traveled on U.S. airlines, down from 331 million in 2019.
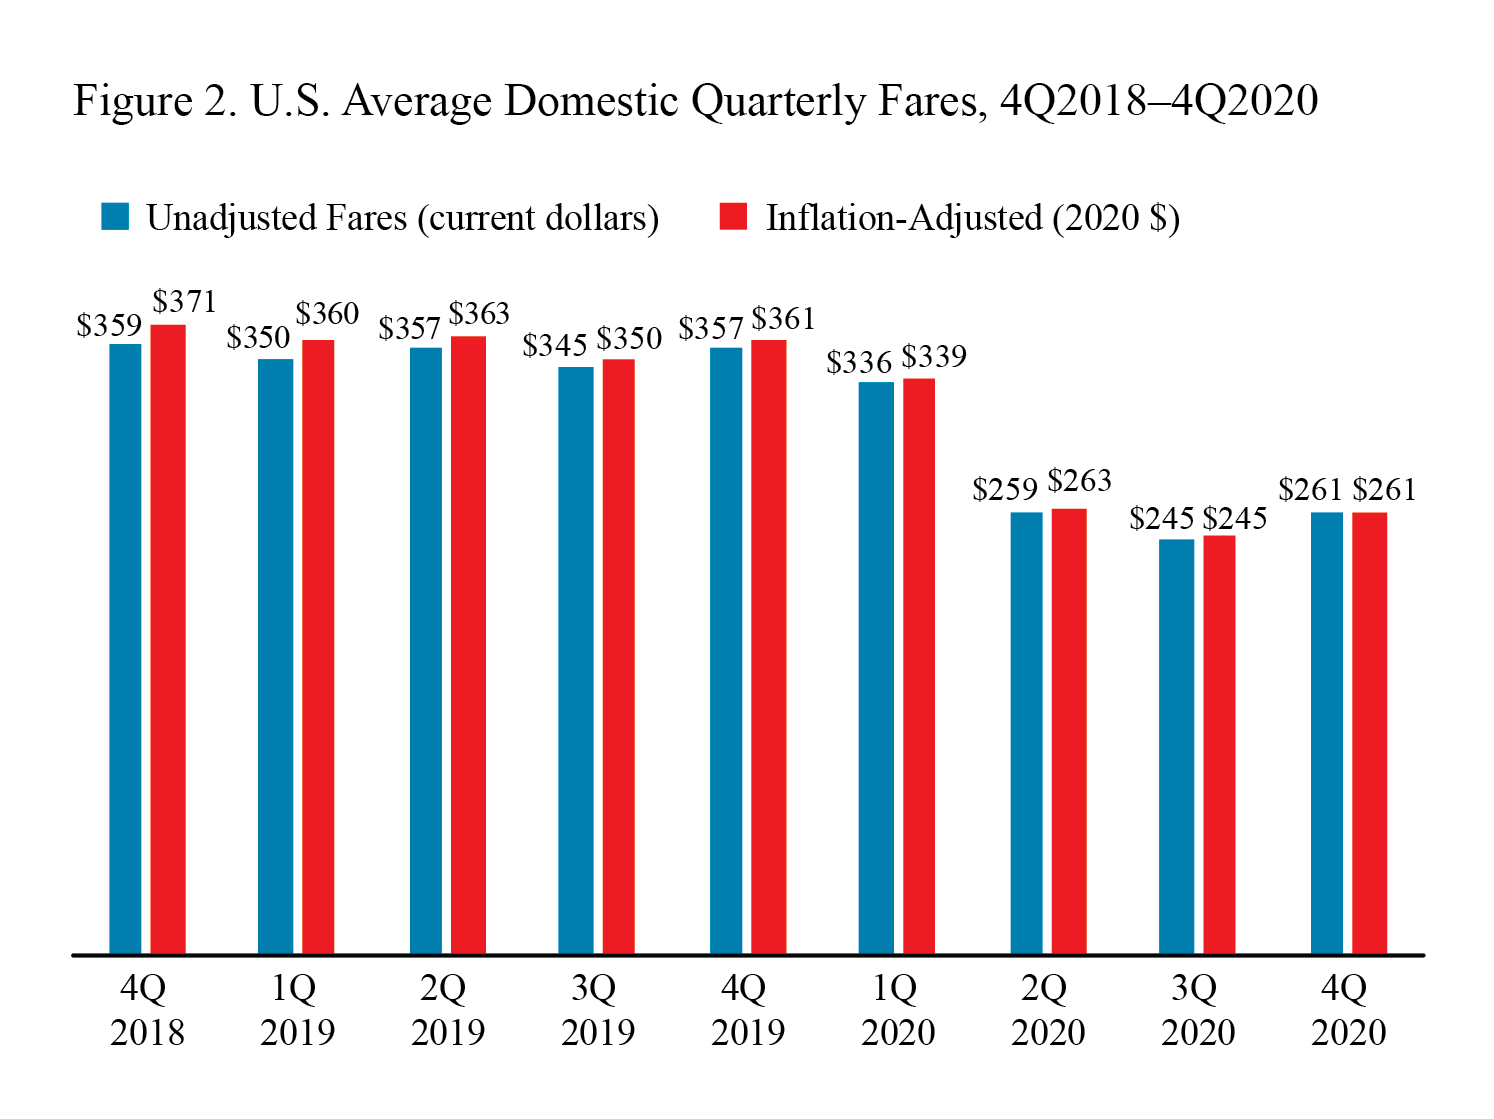
During the year, fares dropped in the third quarter to $245, inflation-adjusted, the lowest quarterly fare on record. In the fourth quarter, fares rose to $261, up 6% from the third quarter but down 28% from the fourth quarter 2019 average fare of $361.
Annual Air Fares
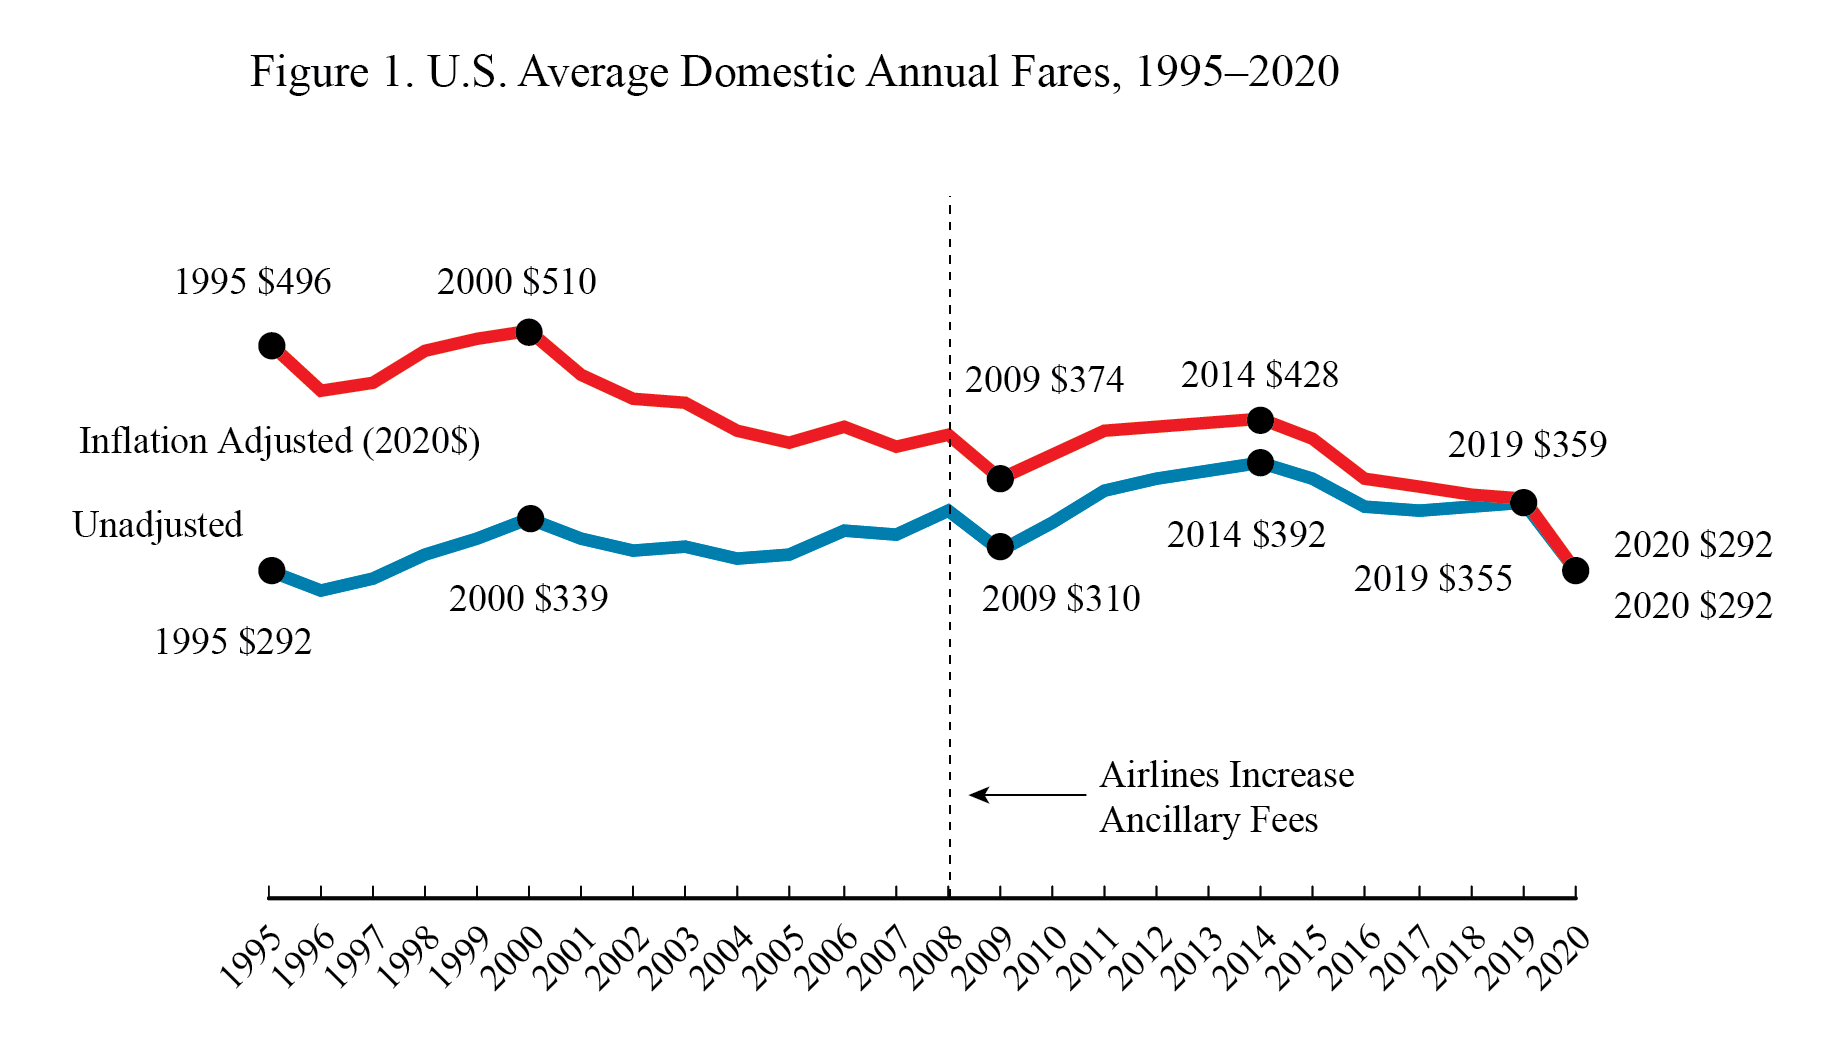
Other Revenue: In recent years, airlines have increasingly obtained additional revenue from passenger fees, as well as from other sources. U.S. passenger airlines collected 65.1% of total operating revenue of $38.6 billion from passenger fares during the first nine months of 2020, down from 88.5% in 1990.
Results for average fares are based on the BTS Origin & Destination Survey, a 10% sample of airline tickets used during the quarter. For results based on all itinerary fares for 2020, the standard error is 0.18. The median fare for the year was $235.01.
Fourth Quarter 2020 Air Fares
The average U.S. domestic air fare in the fourth quarter of 2020 was $261, increasing 6.3% from an inflation-adjusted third quarter 2020 fare of $245. The number of passengers increased from 27 million originating passengers in the third quarter of 2020 quarter to 31 million passengers in the fourth quarter compared to 86 million passengers in the fourth quarter of 2019.
Adjusted for inflation (constant 2020 dollars) the average 4Q 2020 air fare was:
- Down 27.7% from 4Q 2019 ($361)
- Up 6.3% from 3Q 2020 ($245)
- Down 35.0% from 4Q 2015 ($401)
Itinerary Fares: Round-trips, but includes one-way tickets if no return is purchased.
Breakout of trip types: one-way, 41% ($201); round-trip, 59% ($309).
Fares by Airport
Additional data: see Top 100 Airports or All Airports. First Quarter 2021 average fare data will be released July 20.
Standard error: Results for average fares are based on the BTS Origin & Destination Survey, a 10% sample of airline tickets used during the quarter. Averages for airports with smaller samples may be less reliable.
Note: Results for average fares are based on the BTS Origin & Destination Survey, a 10% sample of airline tickets used during the quarter. For Q4 2020 results based on all itinerary fares, the standard error is 0.30 and the median fare is $209.10. The 90% confidence interval ranges from $260.30 to $261.29. For results based on round-trip fares, the standard error is .47 and the median fare is $262.56. The 90% confidence interval ranges from $308.54 to $310.09. For results based on one-way fares, the standard error is .34 and the median fare is $158.69. The 90% confidence interval ranges from $200.00 to $201.12.
|
You are subscribed to DOT email updates. Subscriber Services: Manage Preferences |
|
||||||||||||
