
December 2020 Freight Transportation Services Index (TSI) Rose to Highest Level since Start of Pandemic
U.S. Department of Transportation sent this bulletin at 02/10/2021 10:12 AM EST |
|
Having trouble viewing this email? View it as a Web page.
|
 |
U.S. Department of Transportation
Office of Public Affairs
1200 New Jersey Avenue, SE
Washington, DC 20590
|
December 2020 Freight Transportation Services Index (TSI) Rose to Highest Level since Start of Pandemic
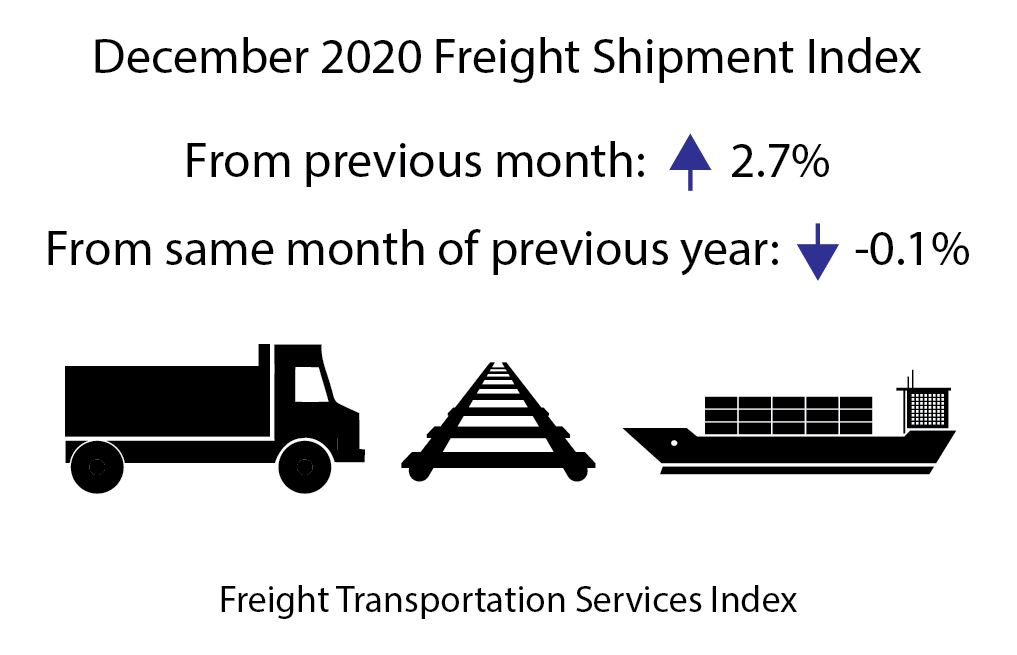
The Freight Transportation Services Index (TSI), which is based on the amount of freight carried by the for-hire transportation industry, rose 2.7% in December from November, rising to the highest level since the start of the pandemic, according to the U.S. Department of Transportation’s Bureau of Transportation Statistics’ (BTS). The index reached the level of 136.3, the highest level since 136.9 in January 2020.
The index rose 8.4% since dropping to 125.7 in April at the start of the pandemic.
Annually, from December 2019 to December 2020 the index fell 0.1% compared to a decline of 0.6% from December 2018 to December 2019 and a rise of 2.9% from December 2017 to December 2018 (Tables 1, 2, and 2A).
In the fourth quarter of 2020, the freight TSI rose 3.3%, the second consecutive quarterly increase and the largest quarterly rise since the fourth quarter of 2017 (Table 10).
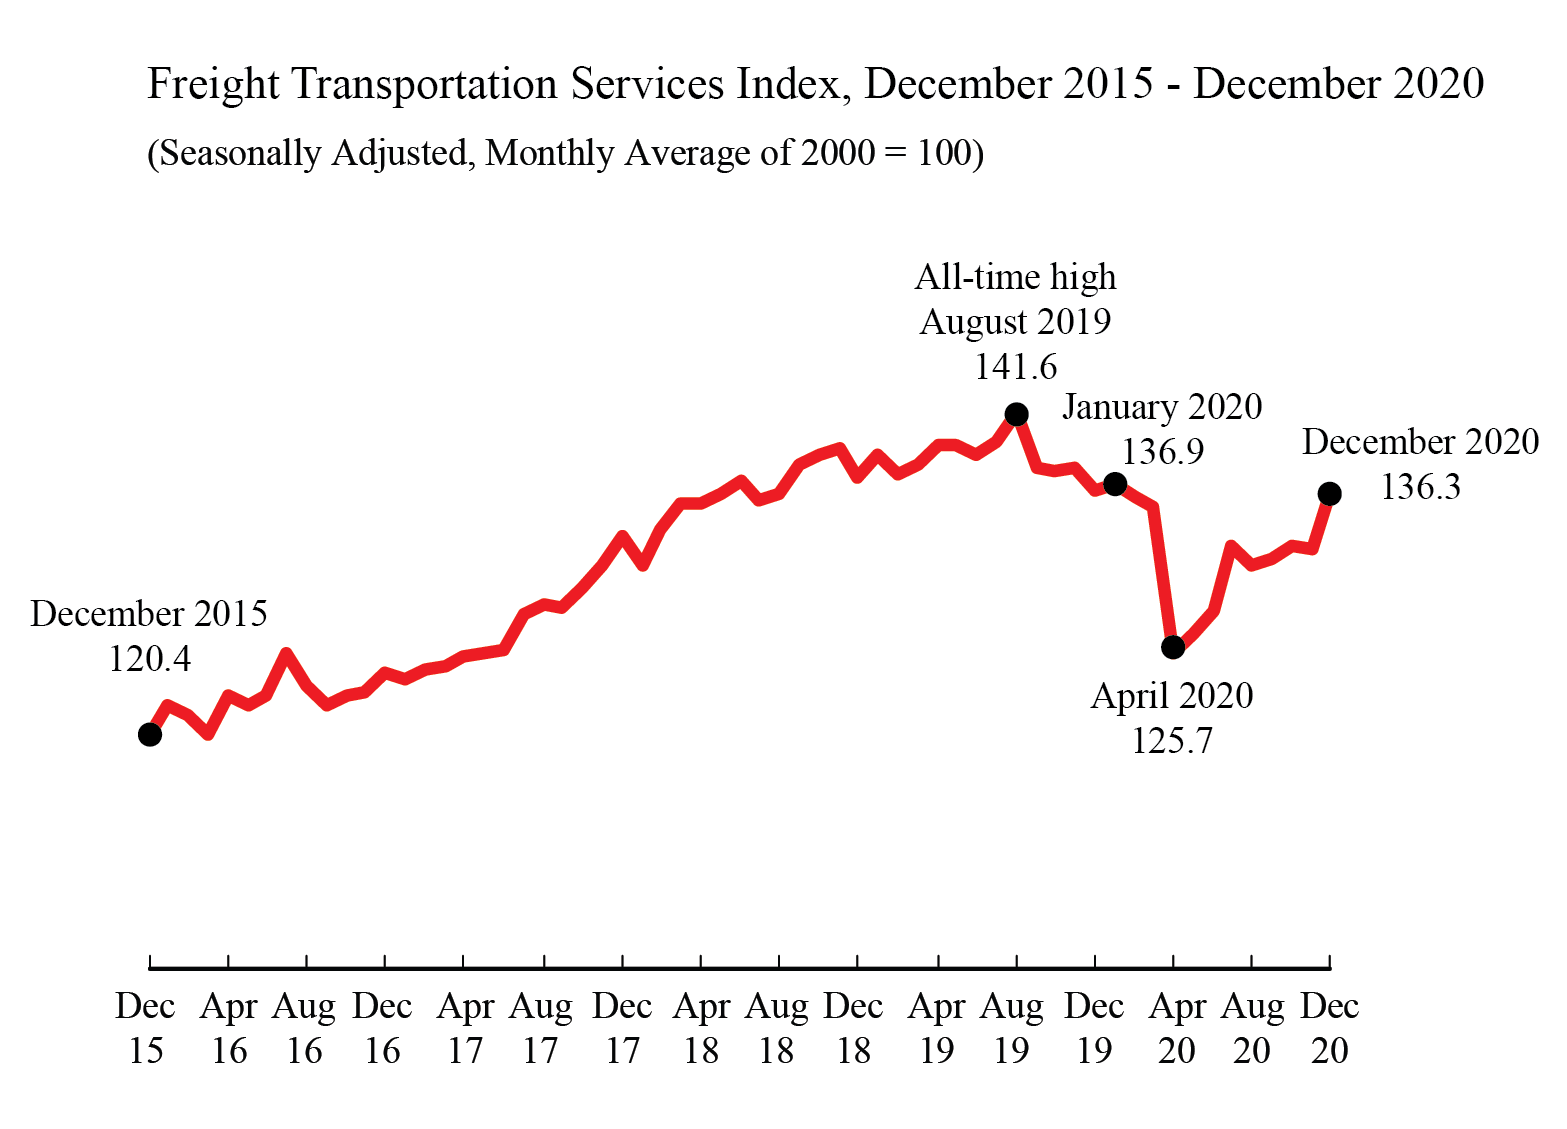
The level of for-hire freight shipments in December measured by the Freight TSI (136.3) was 3.7% below the all-time high level of 141.5 in August 2019 (Table 2A). BTS’ TSI records begin in 2000. See historical TSI data.
The November index (132.7) remains unchanged from last month’s release. June 2020 (128.6) was revised down slightly.
BTS is withholding the scheduled release of the passenger and combined indexes for December. The passenger index for December is a statistical estimate of airline passenger travel and other components based on historical trends up to November 2020. The statistical estimate does not fully account for the rapidly changing impacts of the coronavirus on the historical trend. Air freight for December is also a statistical estimate. Since air freight makes up a smaller part of the freight index, the freight TSI is being released as scheduled with the air freight estimate included. The November passenger and combined indexes are available on the BTS website.
The Freight TSI measures the month-to-month changes in for-hire freight shipments by mode of transportation in tons and ton-miles, which are combined into one index. The index measures the output of the for-hire freight transportation industry and consists of data from for-hire trucking, rail, inland waterways, pipelines and air freight. The TSI is seasonally-adjusted to remove regular seasons from month-to-month comparisons.
Analysis: The Freight TSI increased 2.7% in December from November due to growth in water, pipeline, trucking, and air freight, despite declines in rail intermodal and rail carload. The December increase took place against the background of strong results in other indicators.
The Institute for Supply Management Manufacturing (ISM) index was up 3.2 points to 60.7, indicating accelerating growth in manufacturing. The Federal Reserve Board Industrial Production (IP) Index grew 1.6% in December reflecting increases of 0.9% in manufacturing, 1.6% in mining, and 6.2% in utilities. Housing starts grew 5.8%. Personal Income rose 0.6%.
The fourth-quarter TSI increase of 3.3% came in the context of continued but slowing quarterly GDP growth.
Although the December Passenger TSI is being withheld because of the difficulty of estimating air passenger miles and other modes, the November index is now being released. The index increased 17.9% from October to November, returning passenger TSI to growth after a month of decline. Passenger TSI has now grown in six of the last seven months. It remained below any level the Passenger TSI had been before the pandemic for the ninth consecutive month. Air passenger grew in November, but transit and rail passenger decreased.
Trend: The December increase in the Freight index was the largest since July, and the second largest since December 2011. The index has increased in six of the last eight months, following three months of decline. TSI’s course through the pandemic has been a decline of 8.2% from January to April, a 5.7% rebound from April to July, a subsequent 1.0% decline from July to August and then an increase of 3.6% from August to December. The index is now at its highest level since before the impact of the pandemic. For additional historical data, go to TSI data.
Index highs and lows: For-hire freight shipments in December 2020 (136.3) were 43.6% higher than the low in April 2009 during the recession (94.9). The December 2020 level was 3.7% below the historic peak reached in August 2019 (141.5).
Year-to-date: For-hire freight shipments measured by the index were down 0.1% in December compared to the end of 2019 (Table 3).
Long-term trend: For-hire freight shipments are up 13.2% in the five years from December 2015 and are up 25.3% in the 10 years from December 2010 (Table 5).
Same month of the previous year: December 2020 for-hire freight shipments were down 0.1% from December 2019 (Tables 4, 5).
The TSI has three seasonally adjusted indexes that measure changes from the monthly average of the base year of 2000. The three indexes are freight shipments, passenger travel and a combined measure that merges the freight and passenger indexes. See Seasonally-Adjusted Transportation Data for numbers for individual modes. TSI includes data from 2000 to the present. Release of the January 2021 index is scheduled for March 10.
Revisions: Monthly data has changed from previous releases due to the use of concurrent seasonal analysis, which results in seasonal analysis factors changing as each month’s data are added.
BTS research has shown a clear relationship between economic cycles and the Freight and Passenger Transportation Services Indexes. See a study of this relationship using smoothed and detrended TSI data. Researchers who wish to compare TSI over time with other economic indicators, can use the FRED database, which includes freight, passenger and combined TSI, and which makes it possible to easily graph TSI alongside the other series in that database. See TSI data on FRED.
For charts and discussion on the relationship of the TSI to the economy, see Transportation as an Economic Indicator: Transportation Services Index.
A BTS report explaining the TSI, Transportation Services Index and the Economy, is available for download.
|
Freight |
||||||
|
Index |
Pct. Change |
|||||
|
June |
128.6 |
1.3 |
||||
|
July |
132.9 |
3.3 |
||||
|
August |
131.6 |
-1.0 |
||||
|
September |
131.9 |
0.2 |
||||
|
October |
132.8 |
0.7 |
||||
|
November |
132.7 |
-0.1 |
||||
|
December |
136.3 |
2.7 |
||||
Table 1A: Annual High and Low Points in Freight Transportation Services Index, 2009-2020
|
Year |
|
Month |
Peak |
Month |
Bottom |
|
2009 |
December |
101.8 |
April |
94.9 |
|
|
2016 |
July |
125.7 |
March |
120.5 |
|
|
2017 |
December |
133.4 |
January |
124.1 |
|
|
2018 |
November |
139.3 |
November |
131.6 |
|
|
2019 |
August |
141.5 |
December |
136.5 |
|
|
2020 |
(thru December) |
January |
136.9 |
July |
125.7 |
SOURCE: Bureau of Transportation Statistics. See Transportation Services Index for documentation, data and other background information
|
2017 |
2018 |
2019 |
2020 |
|
|
|
% Change |
% Change |
% Change |
% Change |
|
January |
-0.2 |
-1.3 |
1.0 |
0.3 |
|
February |
0.5 |
1.7 |
-0.9 |
-0.6 |
|
March |
0.2 |
1.2 |
0.4 |
-0.6 |
|
April |
0.5 |
0.1 |
1.0 |
-7.1 |
|
May |
0.2 |
0.4 |
-0.1 |
1.0 |
|
June |
0.2 |
0.5 |
-0.4 |
1.3 |
|
July |
1.9 |
-0.8 |
0.6 |
3.3 |
|
August |
0.5 |
0.2 |
1.3 |
-1.0 |
|
September |
-0.2 |
1.4 |
-2.5 |
0.2 |
|
October |
0.9 |
0.4 |
-0.1 |
0.7 |
|
November |
1.2 |
0.4 |
0.1 |
-0.1 |
|
December |
1.4 |
-1.4 |
-1.1 |
2.7 |
SOURCE: Bureau of Transportation Statistics. See Transportation Services Index for documentation, data and other background information
Table 2A: Freight Transportation Services Index by Month, 2017-2020
|
|
2017 |
2018 |
2019 |
2020 |
|
January |
124.1 |
131.6 |
138.7 |
136.9 |
|
February |
124.7 |
133.9 |
137.5 |
136.1 |
|
March |
124.9 |
135.5 |
138.1 |
135.3 |
|
April |
125.5 |
135.7 |
139.5 |
125.7 |
|
May |
125.8 |
136.3 |
139.4 |
127.0 |
|
June |
126.0 |
137.0 |
138.8 |
128.6 |
|
July |
128.4 |
135.9 |
139.7 |
132.9 |
|
August |
129.0 |
136.2 |
141.5 |
131.6 |
|
September |
128.8 |
138.1 |
138.0 |
131.9 |
|
October |
130.0 |
138.7 |
137.8 |
132.8 |
|
November |
131.6 |
139.3 |
138.0 |
132.7 |
|
December |
133.4 |
137.3 |
136.5 |
136.3 |
SOURCE: Bureau of Transportation Statistics. See Transportation Services Index for documentation, data and other background information
|
Year |
Freight |
||
|
2011 |
5.6 |
||
|
2012 |
-2.3 |
||
|
2013 |
5.0 |
||
|
2014 |
4.4 |
||
|
2015 |
-2.1 |
||
|
2016 |
3.3 |
||
|
2017 |
7.2 |
||
|
2018 |
2.9 |
||
|
2019 |
-0.6 |
||
|
2020 |
-0.1 |
SOURCE: Bureau of Transportation Statistics. See Transportation Services Index for documentation, data and other background information
|
|
December Freight TSI |
Percent change from same month previous year |
|
2011 |
114.9 |
5.6 |
|
2012 |
112.2 |
-2.3 |
|
2013 |
117.8 |
5.0 |
|
2014 |
123.0 |
4.4 |
|
2015 |
120.4 |
-2.1 |
|
2016 |
124.4 |
3.3 |
|
2017 |
133.4 |
7.2 |
|
2018 |
137.3 |
2.9 |
|
2019 |
136.5 |
-0.6 |
|
2020 |
136.3 |
-0.1 |
Table 5: Freight Transportation Services Index from Previous Years
|
Since December . . . |
Duration in years |
Freight TSI Percent change to December 2020 |
||
|
2019 |
1 |
-0.1 |
||
|
2018 |
2 |
-0.7 |
||
|
2017 |
3 |
2.2 |
||
|
2016 |
4 |
9.6 |
||
|
2015 |
5 |
13.2 |
||
|
2014 |
6 |
10.8 |
||
|
2013 |
7 |
15.7 |
||
|
2012 |
8 |
21.5 |
||
|
2011 |
9 |
18.6 |
||
|
2010 |
10 |
25.3 |
SOURCE: Bureau of Transportation Statistics. See Transportation Services Index for documentation, data and other background information
|
Year |
1st Quarter (Jan-Mar) % Growth |
2nd Quarter (Apr-Jun) % Growth |
3rd Quarter (Jul-Sep) % Growth |
4th Quarter (Oct-Dec) % Growth |
|
|
2011 |
2.0 |
-0.6 |
0.9 |
3.2 |
|
|
2012 |
-2.7 |
1.8 |
-1.5 |
0.1 |
|
|
2013 |
3.3 |
0.5 |
0.1 |
1.0 |
|
|
2014 |
1.9 |
-0.2 |
1.8 |
0.9 |
|
|
2015 |
0.0 |
-1.1 |
1.5 |
-2.4 |
|
|
2016 |
0.1 |
2.1 |
-0.5 |
1.6 |
|
|
2017 |
0.4 |
0.9 |
2.2 |
3.6 |
|
|
2018 |
1.6 |
1.1 |
0.8 |
-0.6 |
|
|
2019 |
0.6 |
0.5 |
-0.6 |
-1.1 |
|
|
2020 |
-0.9 |
-5.0 |
2.6 |
3.3 |
SOURCE: Bureau of Transportation Statistics. See Transportation Services Index for documentation, data and other background information
Brief Explanation of the TSI
The Transportation Services Index (TSI) is a measure of the month-to-month changes in the output of services provided by the for-hire transportation industries. The freight index measure changes in freight shipments while the passenger index measures changes in passenger travel.
The TSI tells us how the output of transportation services has increased or decreased from month to month. The index can be examined together with other economic indicators to produce a better understanding of the current and future course of the economy. The movement of the index over time can be compared with other economic measures to understand the relationship of changes in transportation output to changes in Gross Domestic Product (GDP).
The freight transportation index consists of:
The index does not include international or coastal waterborne movements, private trucking, courier services, or the US Postal Service.
The passenger transportation index consists of:
The index does not include intercity bus, sightseeing services, ferry services, taxi service, private automobile usage, or bicycling and other non-motorized transportation.
The TSI includes only domestic "for-hire" freight and passenger transportation. For-hire transportation consists of freight or passenger transport services provided by a firm to external customers for a fee. The TSI does not include taxi services, paid ride services in personal motor vehicles (e.g., Uber, Lyft, etc.), intercity bus services, in-house transportation (vehicles owned and operated by private firms for their own use), or noncommercial passenger travel (e.g., trips in the household car).
|
You are subscribed to DOT email updates. Subscriber Services: Manage Preferences |
|
||||||||||||
