BTS 2-Week Outlook
Bureau of Transportation Statistics Upcoming Releases
December 8 - 18
Upcoming from December 8
Tuesday, December 8 2020
Tuesday, December 8, 2020 - 11:00am ET
U.S. Airlines Passengers, October 2020 (preliminary)
Wednesday, December 9, 2020 - 10:00am ET
Transportation Services Index, October 2020
Thursday, December 10, 2020 - 11:00am ET
Airline Traffic Data, September 2020 Reported
Thursday, December 10, 2020 – 2:00pm ET
U.S. Airlines Cargo, October 2020 (preliminary)
Friday, December 11, 2020 - 11:00am ET
Passenger Airline Employment, October 2020
Tuesday, December 15, 2020
Previously Released
November 25 – Airline On-Time/Tarmac Data, September 2020
December 2 - Airline Fuel Cost and Consumption, October 2020
December 3 - Airline Full-Time/Part-Time Employment, October 2020
December 7 – U.S. Airlines Financial Data, 3rd Quarter 2020
BTS Releases in the Next Two Weeks
-
U.S. Airlines Passengers, October 2020 (Preliminary)
Tuesday, December 8, 2020 - 11:00am ET
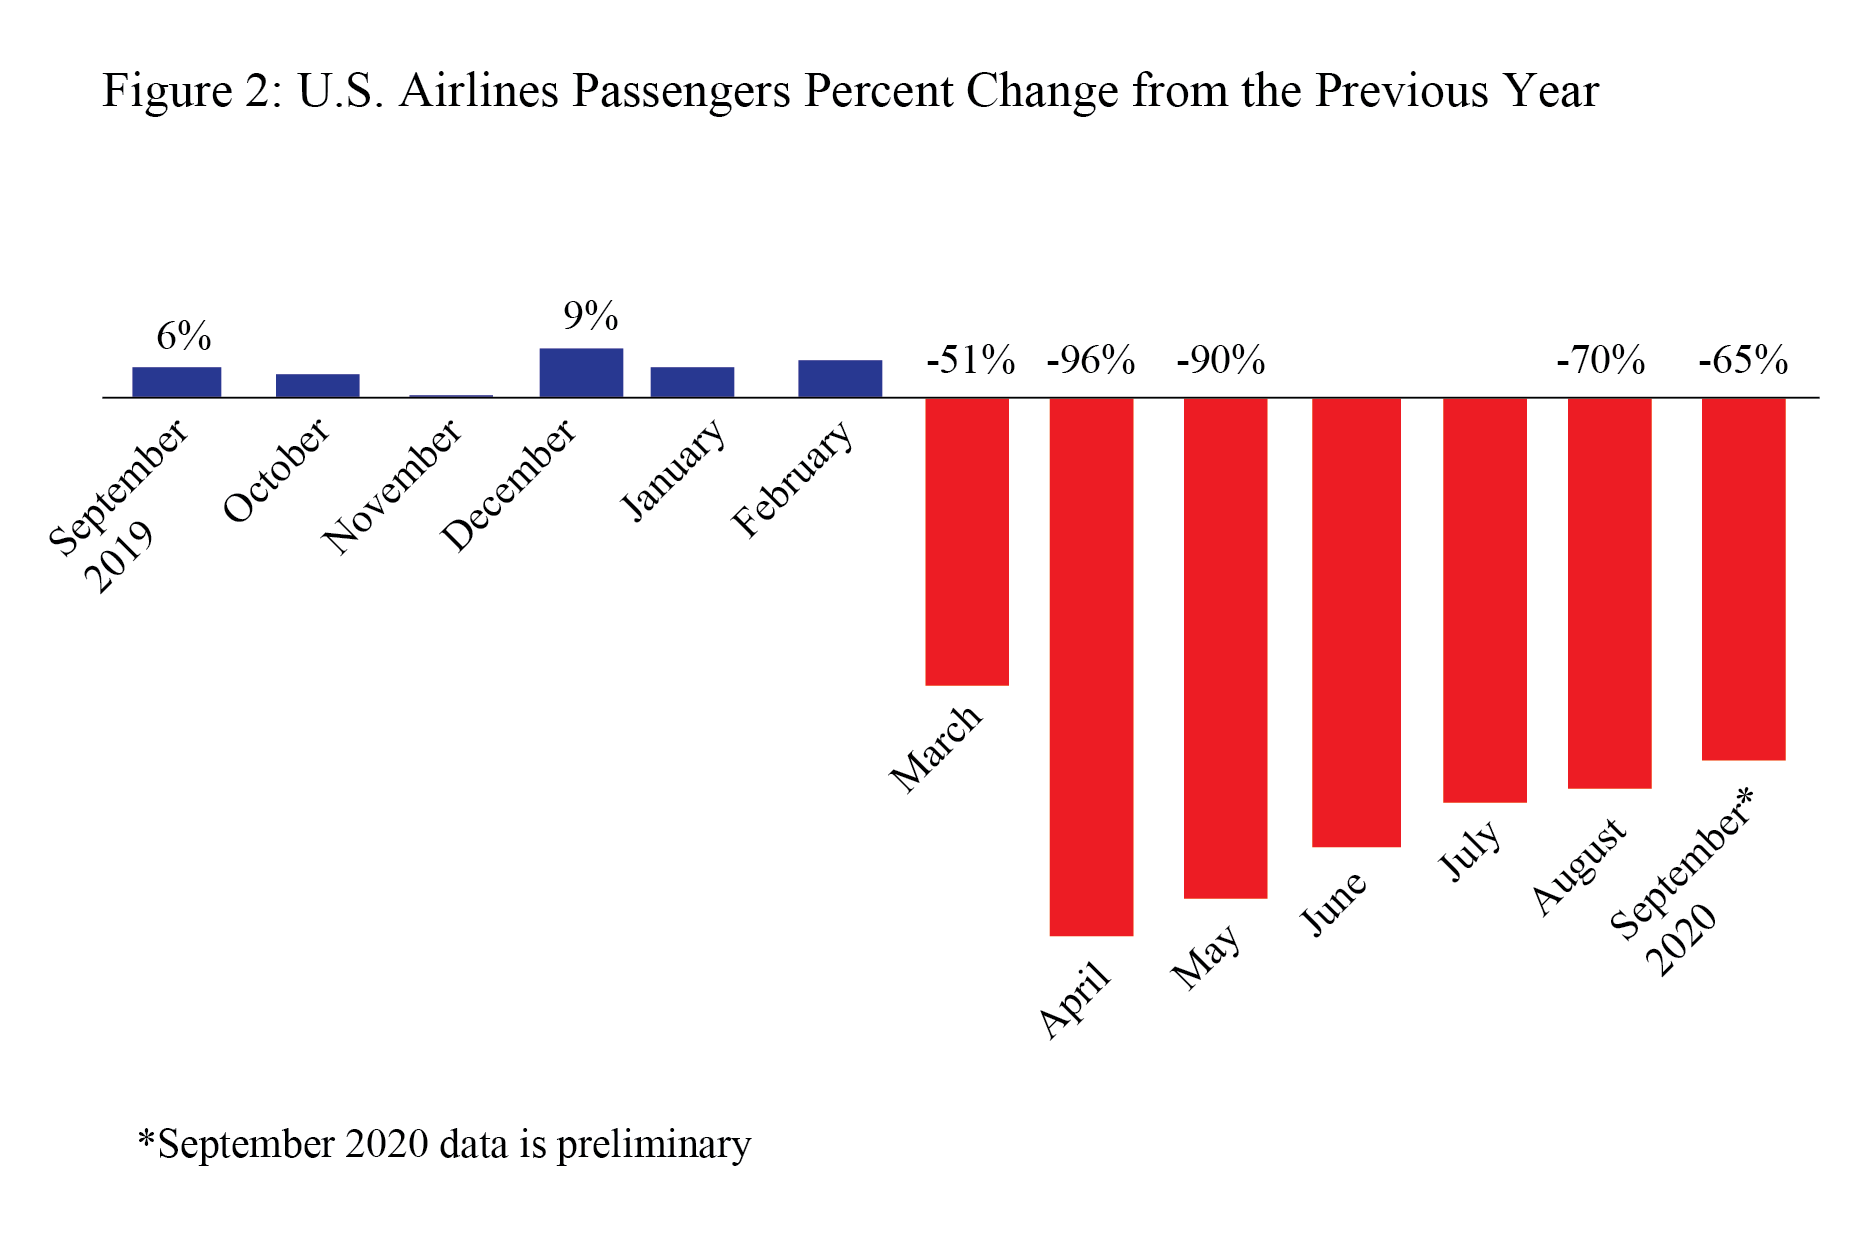
This release provides preliminary monthly passenger data from the U.S. airlines that carry the most passengers. These airlines carry 99% to scheduled service passengers on U.S. airlines. From the previous month’s release, U.S. airlines U.S. airlines carried 65% fewer scheduled service passengers in September 2020 than in September 2019. The 65% decline from September 2019 was the smallest annual decrease since March.
The large airlines carried 25.1 million passengers in September 2020 (preliminary), compared to 71.5 million passengers on all U.S. airlines in September 2019 and up from 3.0 million in April 2020, which was the lowest monthly total in BTS records dating back to 1974. The previous low was 14.6 million passengers in February 1975.
-
Freight Transportation Services Index (TSI), October 2020
Wednesday, December 9, 2020 - 10:00am ET
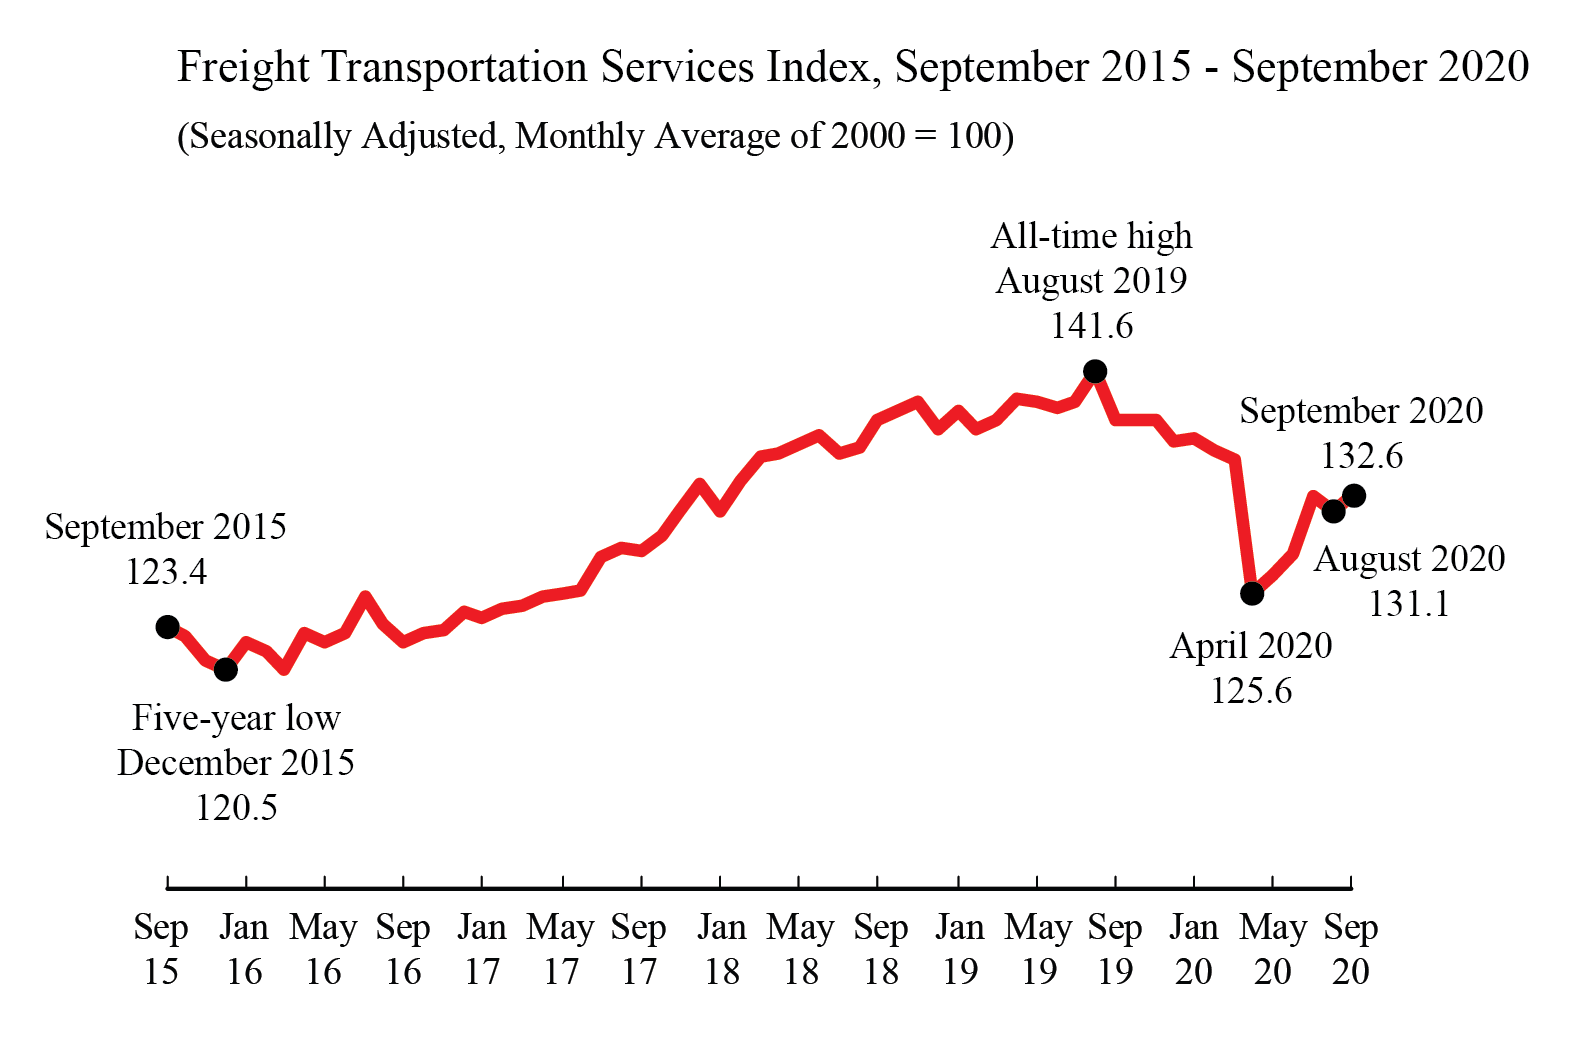
The Freight TSI measures the month-to-month changes in for-hire freight shipments by mode of transportation. In the previous release for September, the Freight TSI rose 0.8% in September from August, rising after a one-month decline. From September 2019 to September 2020, the index fell 3.9% compared to a decline of 0.1% from September 2018 to September 2019 and a rise of 7.2% from September 2017 to September 2018.
-
Airline Traffic Data, September 2020 final
Thursday, December 10, 2020 - 11:00am ET
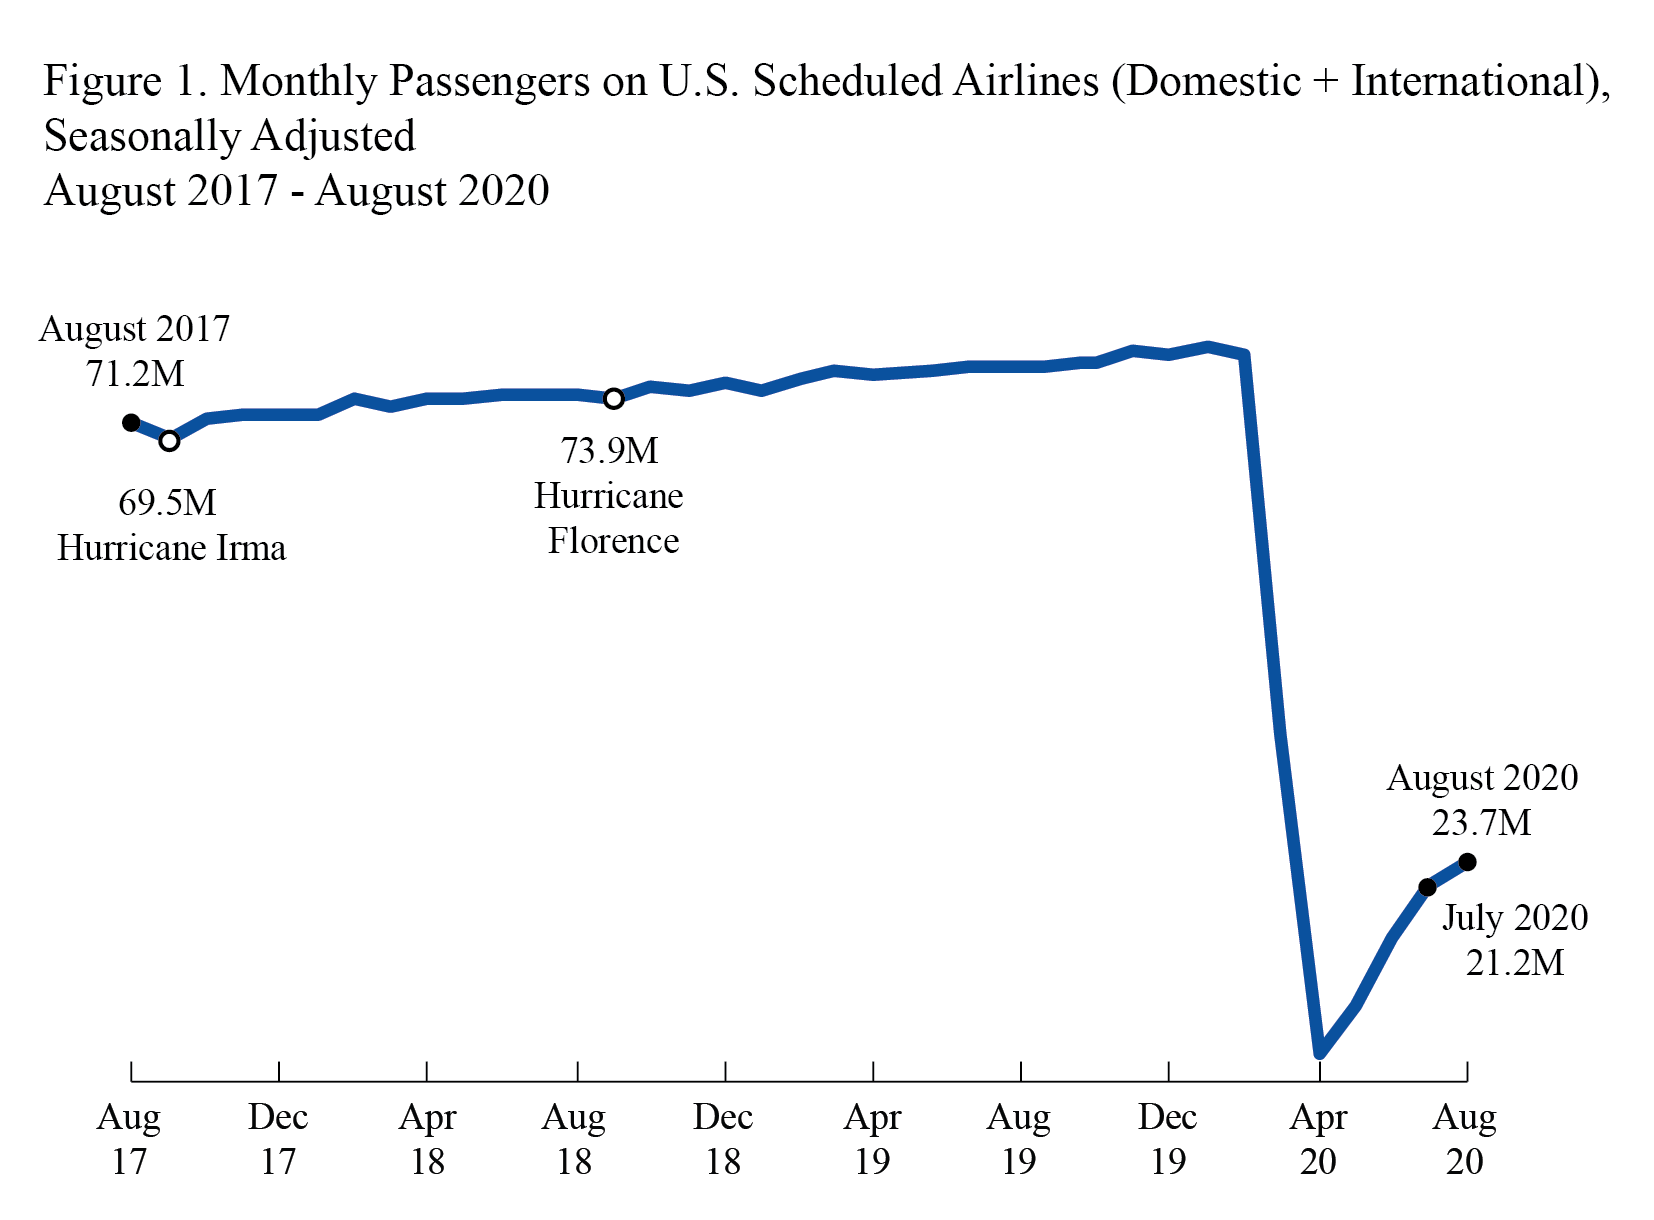
BTS release of reported airline data through September. Data are for U.S. airlines monthly passengers, revenue passenger-miles, available seat-miles and load factor for systemwide, domestic and international. Numbers are seasonally-adjusted and unadjusted. In the previous release, U.S. airlines carried 23.7 million systemwide (domestic and international) scheduled service passengers in August 2020, seasonally adjusted, up 11.8% from July. There were 22.5 million domestic passengers and 1.2 million international passengers on U.S. airlines flights in August.
-
U.S. Airlines Cargo, October 2020 (Preliminary)
Thursday, December 10, 2020 – 2:00pm ET
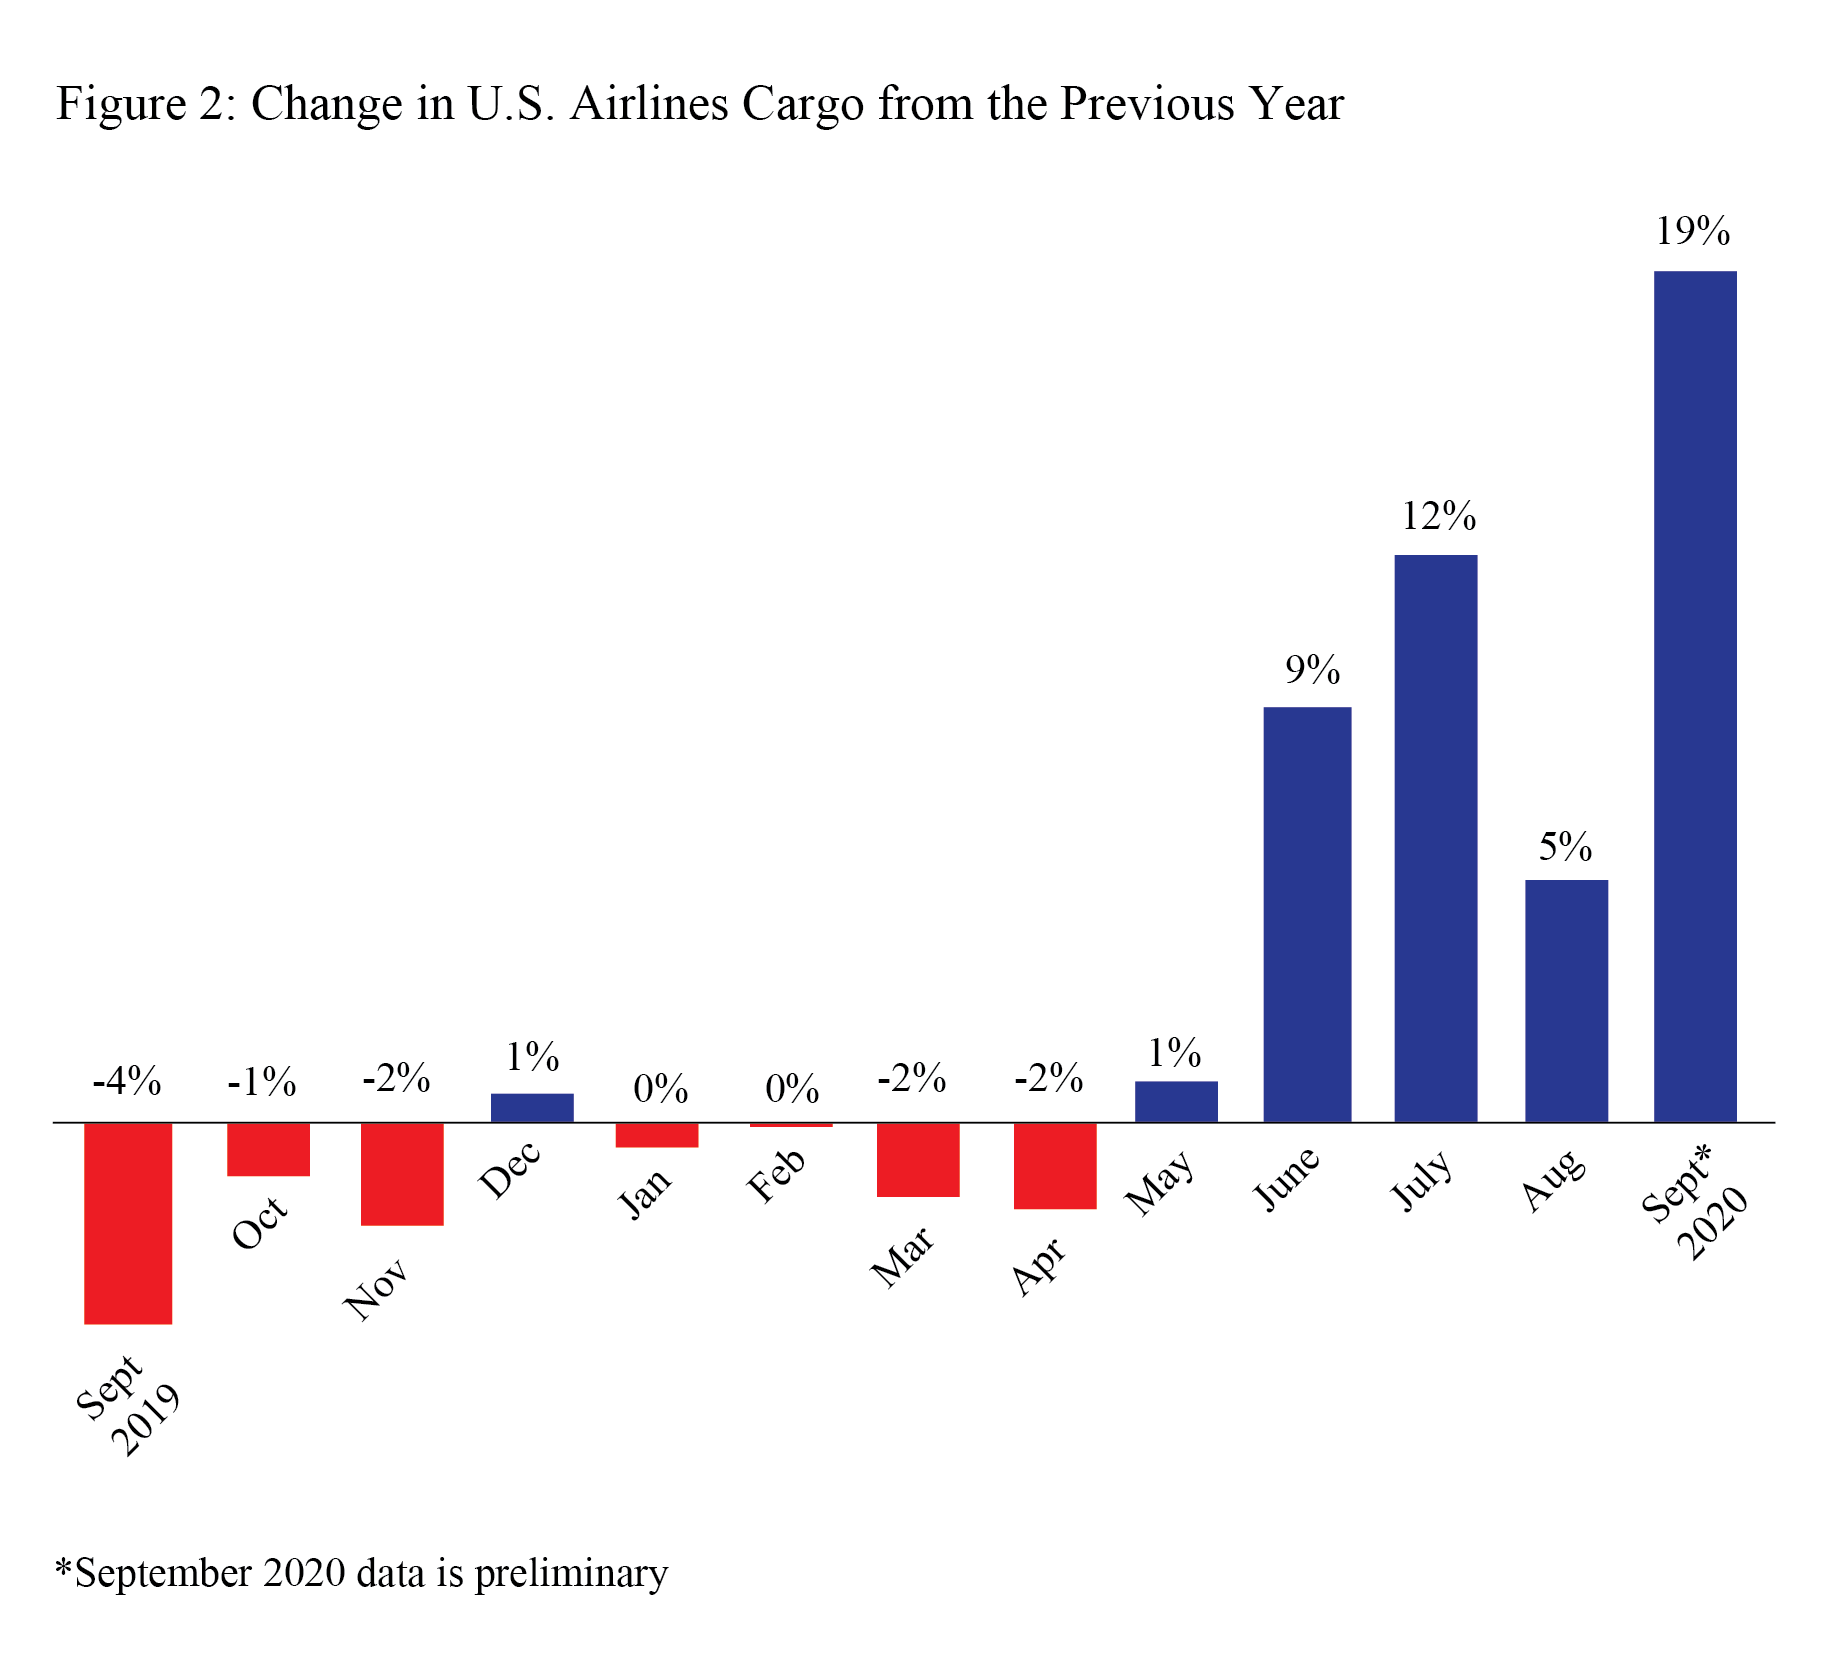
This release provides preliminary monthly cargo data from the U.S. airlines that carry the most cargo. These airlines carry 95% of the cargo (freight + mail) on U.S. airlines. From the previous month’s release, U.S. airlines carried 19% more cargo by weight in September 2020 (preliminary) than in September 2019. The rise was fueled by a gain of 22% in domestic cargo and a 10% rise in international cargo.
-
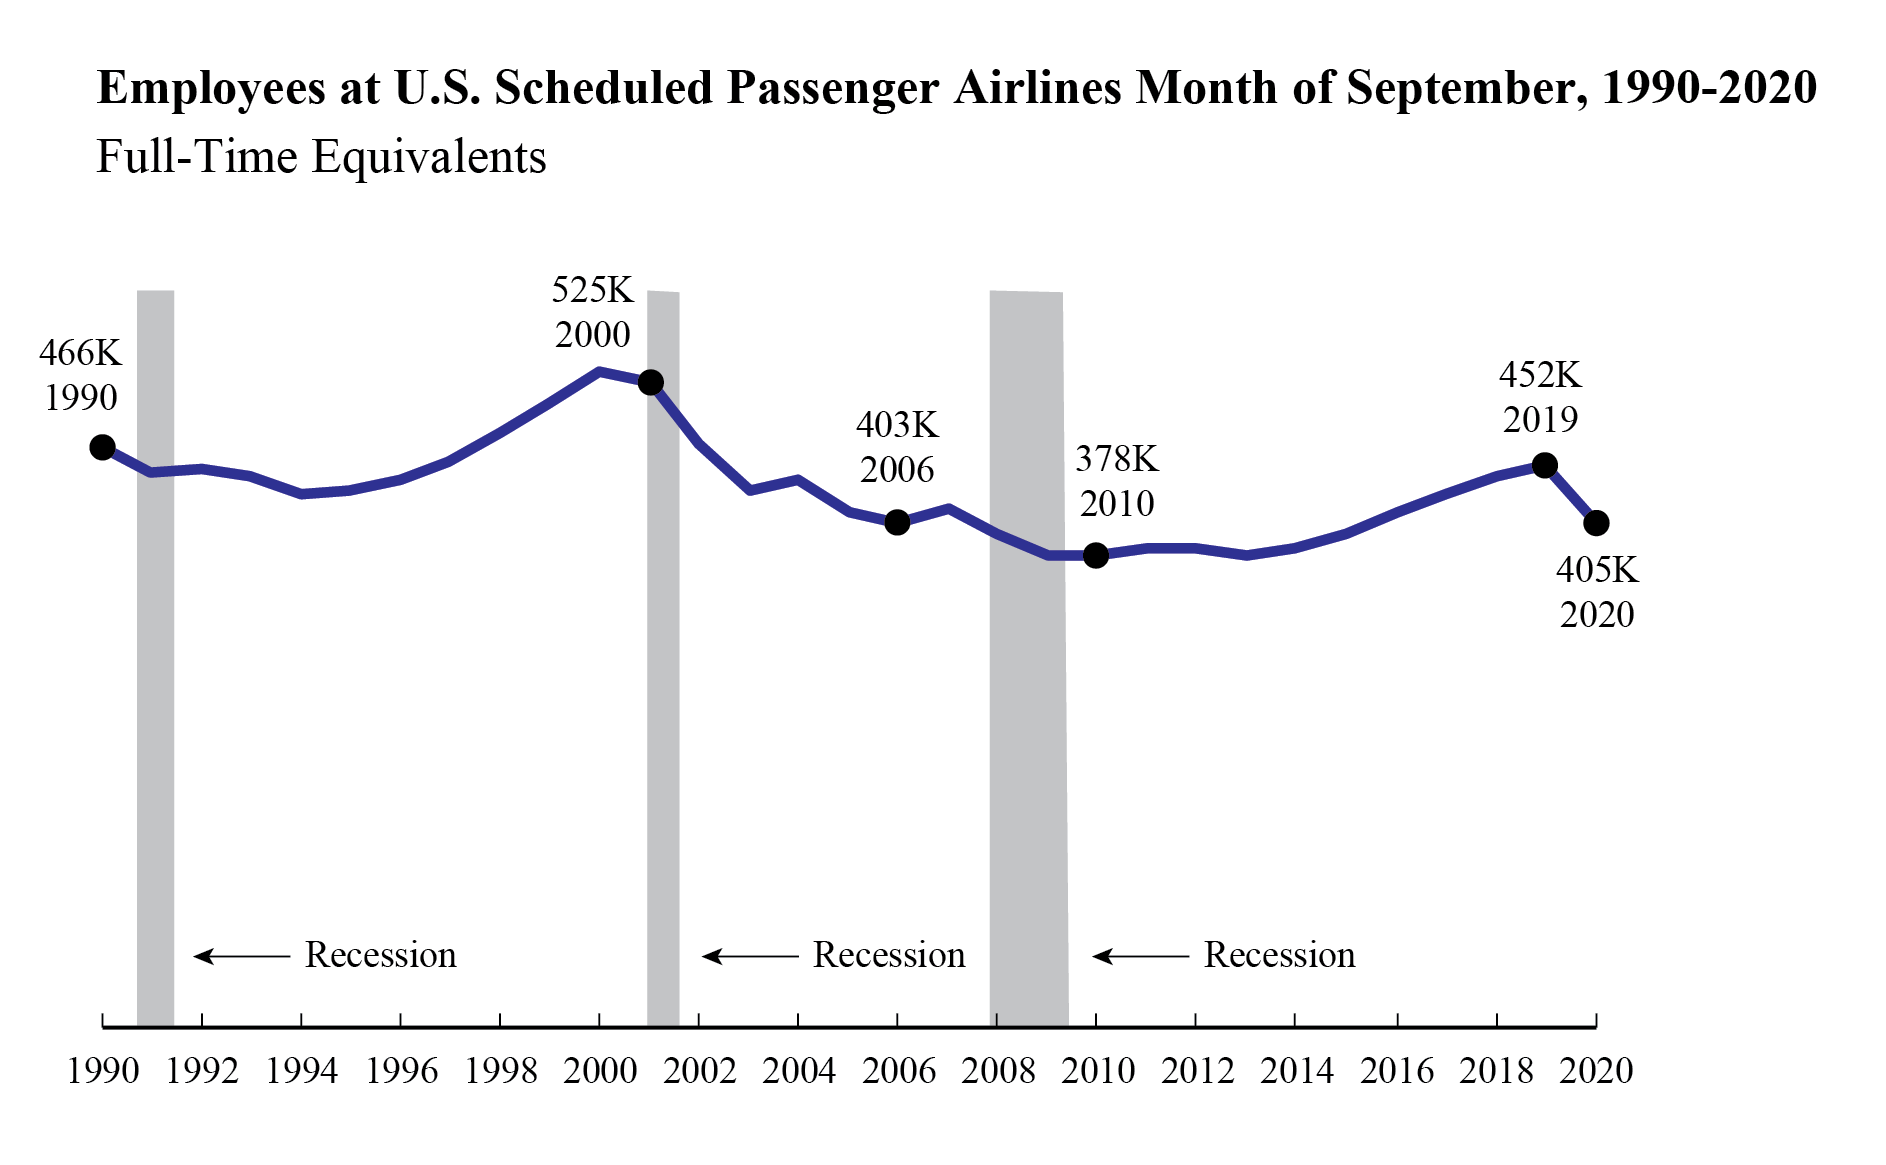
Passenger Airline Employment, October 2020
Friday, December 11, 2020 - 11:00am ET
The release details full-time equivalent (FTE) employment numbers for U.S. scheduled service passenger airlines. Previously, BTS reported that U.S. scheduled passenger airlines employed 1.5% fewer full-time equivalents (FTEs) in mid-September 2020 than in mid-August 2020. Mid-September’s total number of FTEs (404,869) was down 6,307 FTEs from mid-August 2020 (411,176 FTEs) and down nearly 56,728 FTEs from mid-March 2020. Mid-September was the lowest FTE total for any month since February 2016 (403,917 FTEs). Mid-September FTEs were down more than 47,000 FTEs, a 10.5% drop from mid-September 2019 (452,138 FTEs). Regulations require airlines to report employment numbers for a pay period near the 15th of the month.
BTS Previously
BTS has released the following:
-
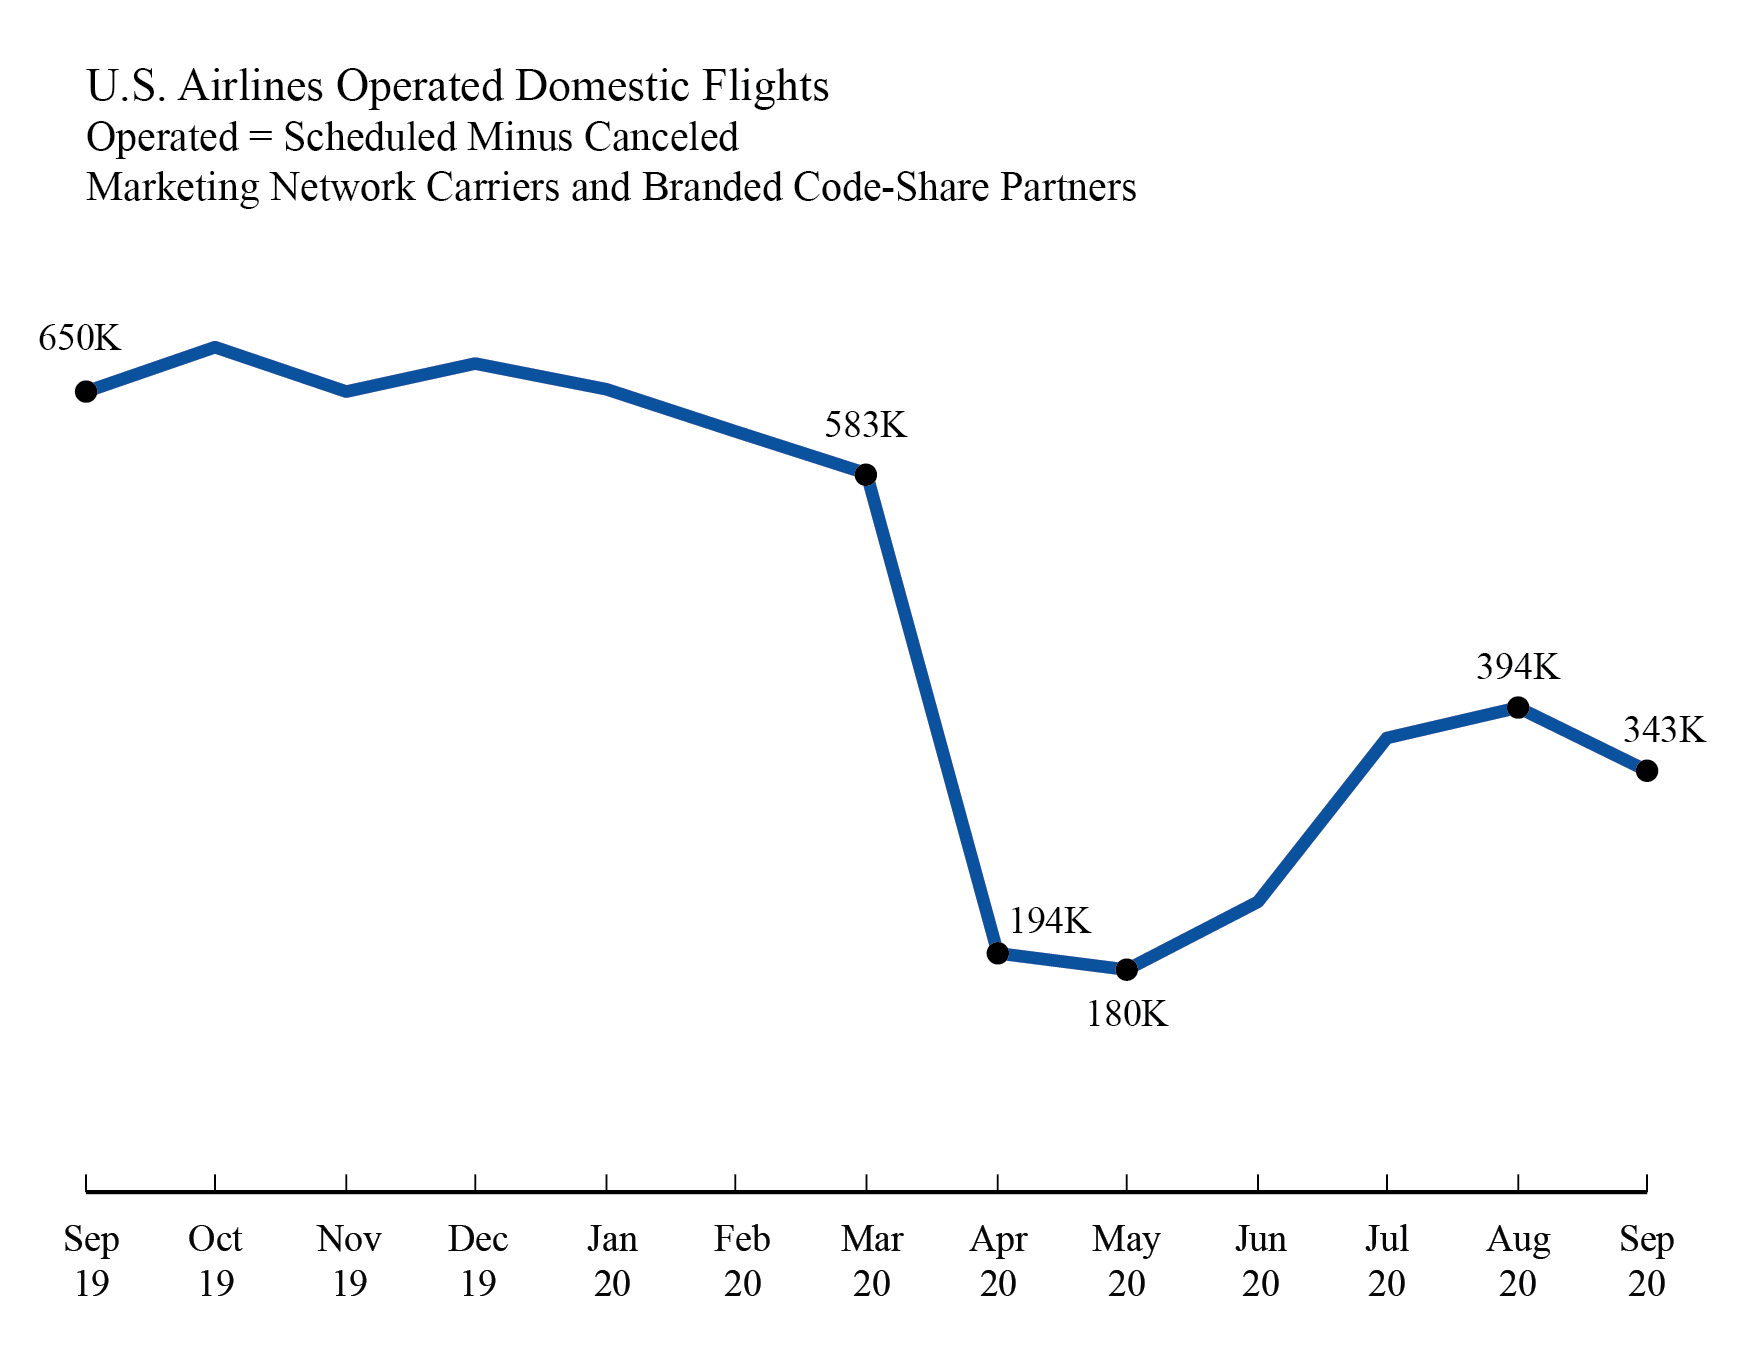
Airline On-Time/Cancellation Data, September 2020
Released November 25
The 10 marketing network carriers reported 345,294 scheduled domestic flights in September 2020 compared to 398,470 flights in August 2020 and 660,712 flights in September 2019. Of those 345,294 scheduled flights, 0.7%, 2,523 flights, were canceled. As a result of schedule reductions and cancellations, the carriers reported operating 342,771 flights in September 2020, compared to 394,143 flights in August 2020 and the all-time monthly low of 180,151 flights in May 2020.. The marketing carriers include branded code-share partners of mainline carriers.
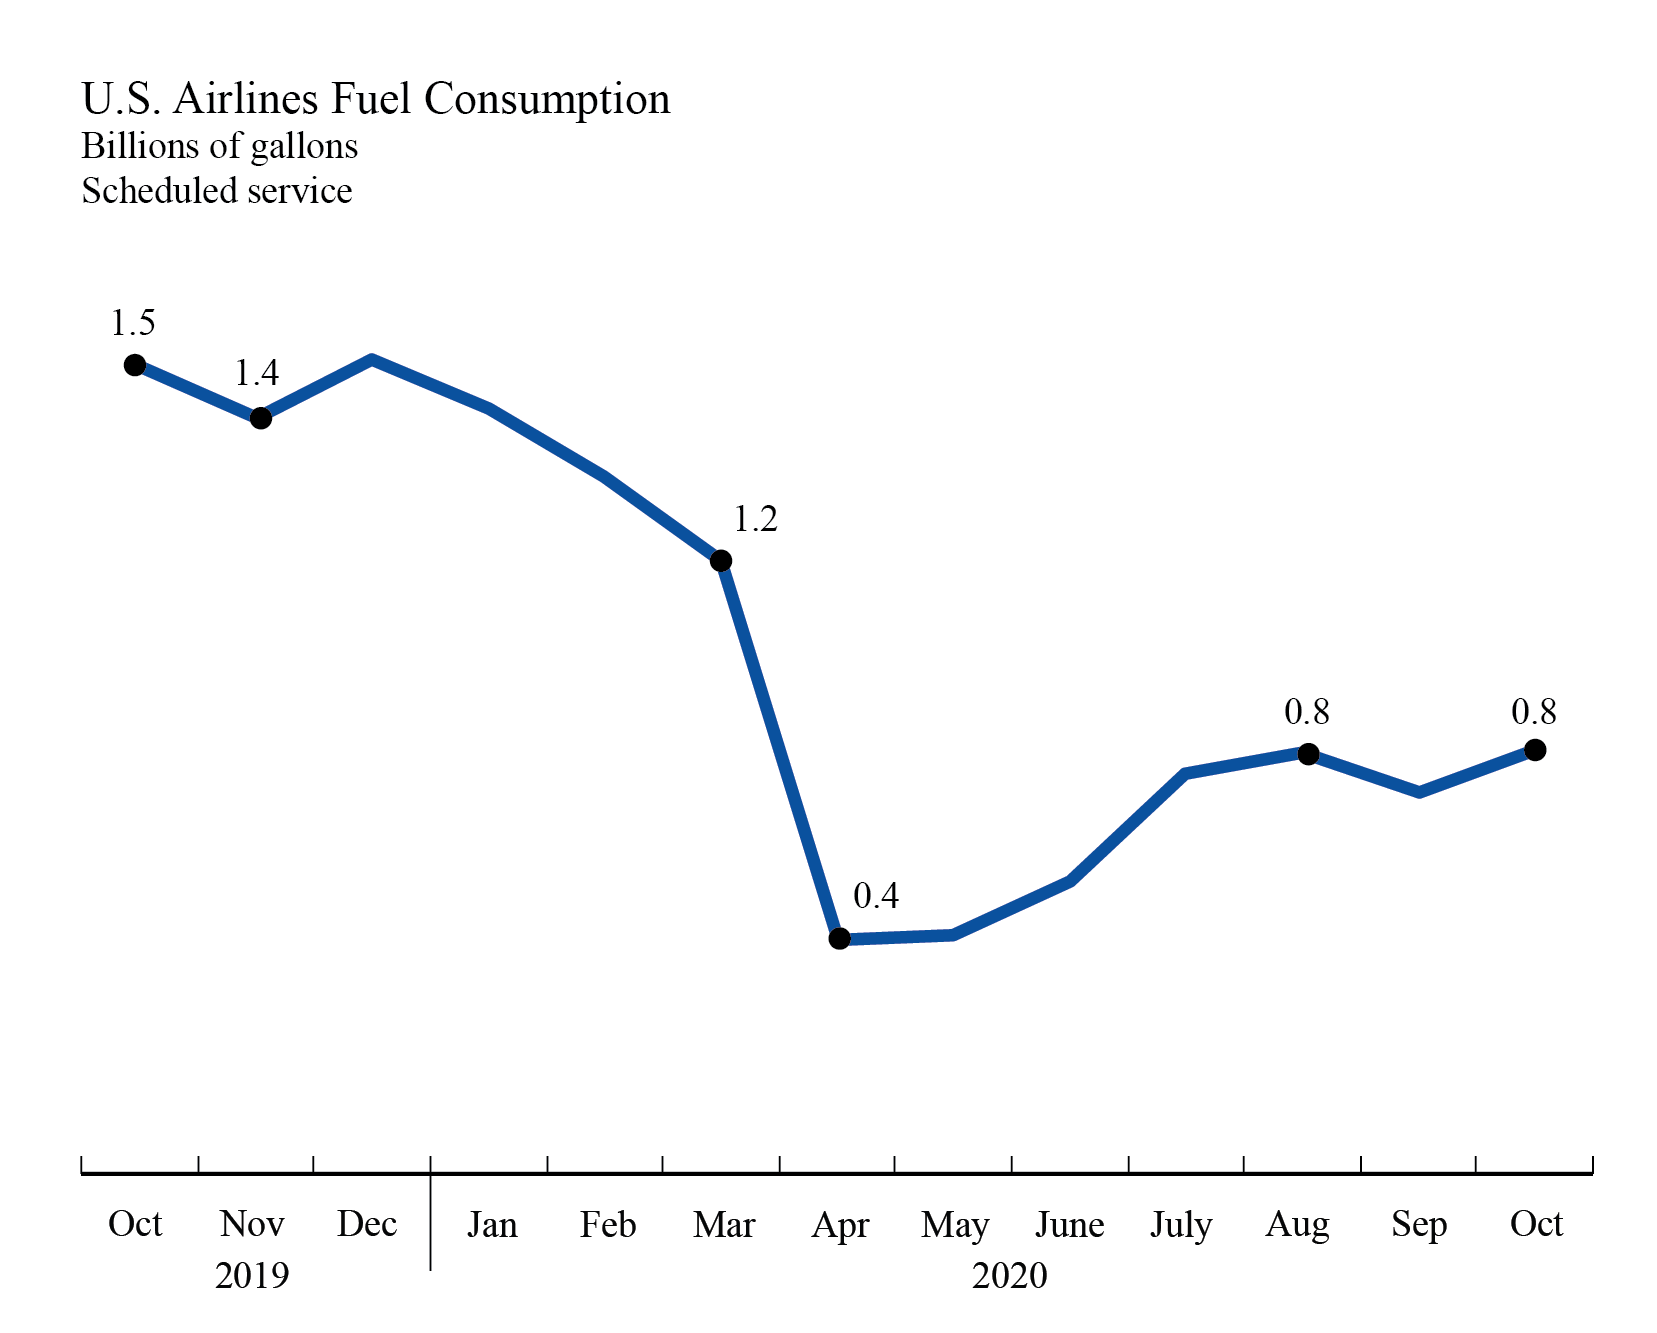
- Airline Fuel Cost and Consumption, October 2020
Released Dec. 2
U.S. airlines October 2020 fuel consumption was 11% higher than September 2020, 0.7% higher than August 2020, and 81% higher than April 2020. April was the lowest monthly fuel usage on record (447M gallons), dating back to 2000. October 2020 fuel consumption was down 48% from October 2019.
Fuel consumed by U.S. airlines’ scheduled services:
October 2019 1.5 billion gallons
September 2020 728 million gallons
October 2020 807 million gallons
Individual airline numbers through September are available on the
BTS website.
-
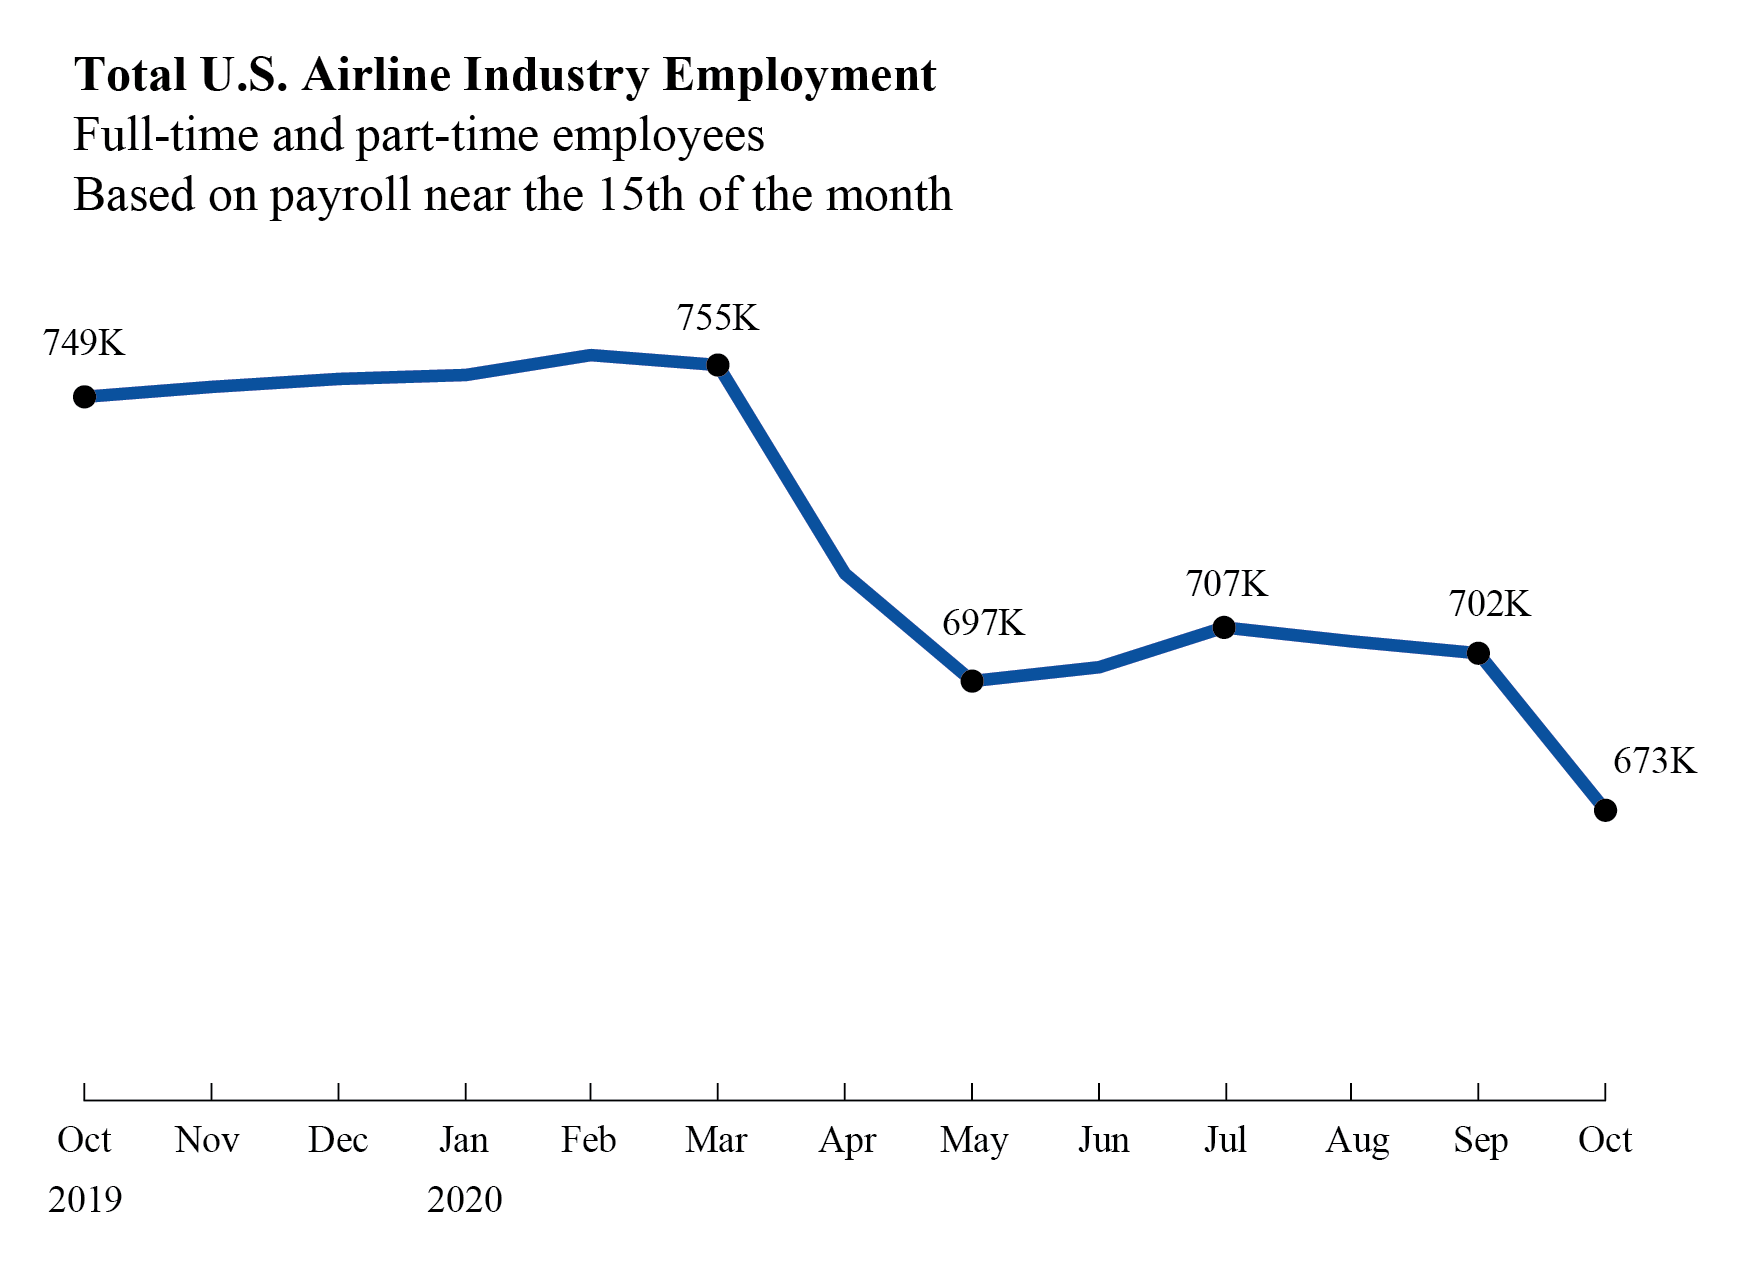
Airline Industry Full-Time/Part-Time Employment, October 2020
Released Dec. 3
U.S. airlines employed 673,278 workers in the middle of October 2020, 28,790 fewer than in mid-September 2020 and 81,749 fewer than in March 2020. The October numbers consist of 562,570 full-time and 110,708 part-time workers.
U.S. airlines employment:
October 2019 749,382
September 2020 702,068
October 2020 673,278
Regulations require airlines to report employment numbers for a pay period near the 15th of the month. Monthly full-time and part-time employment statistics are reported by U.S. airlines that operate at least one aircraft that has more than 60 seats or the capacity to carry a payload of passengers, cargo and fuel weighing more than 18,000 pounds.
-
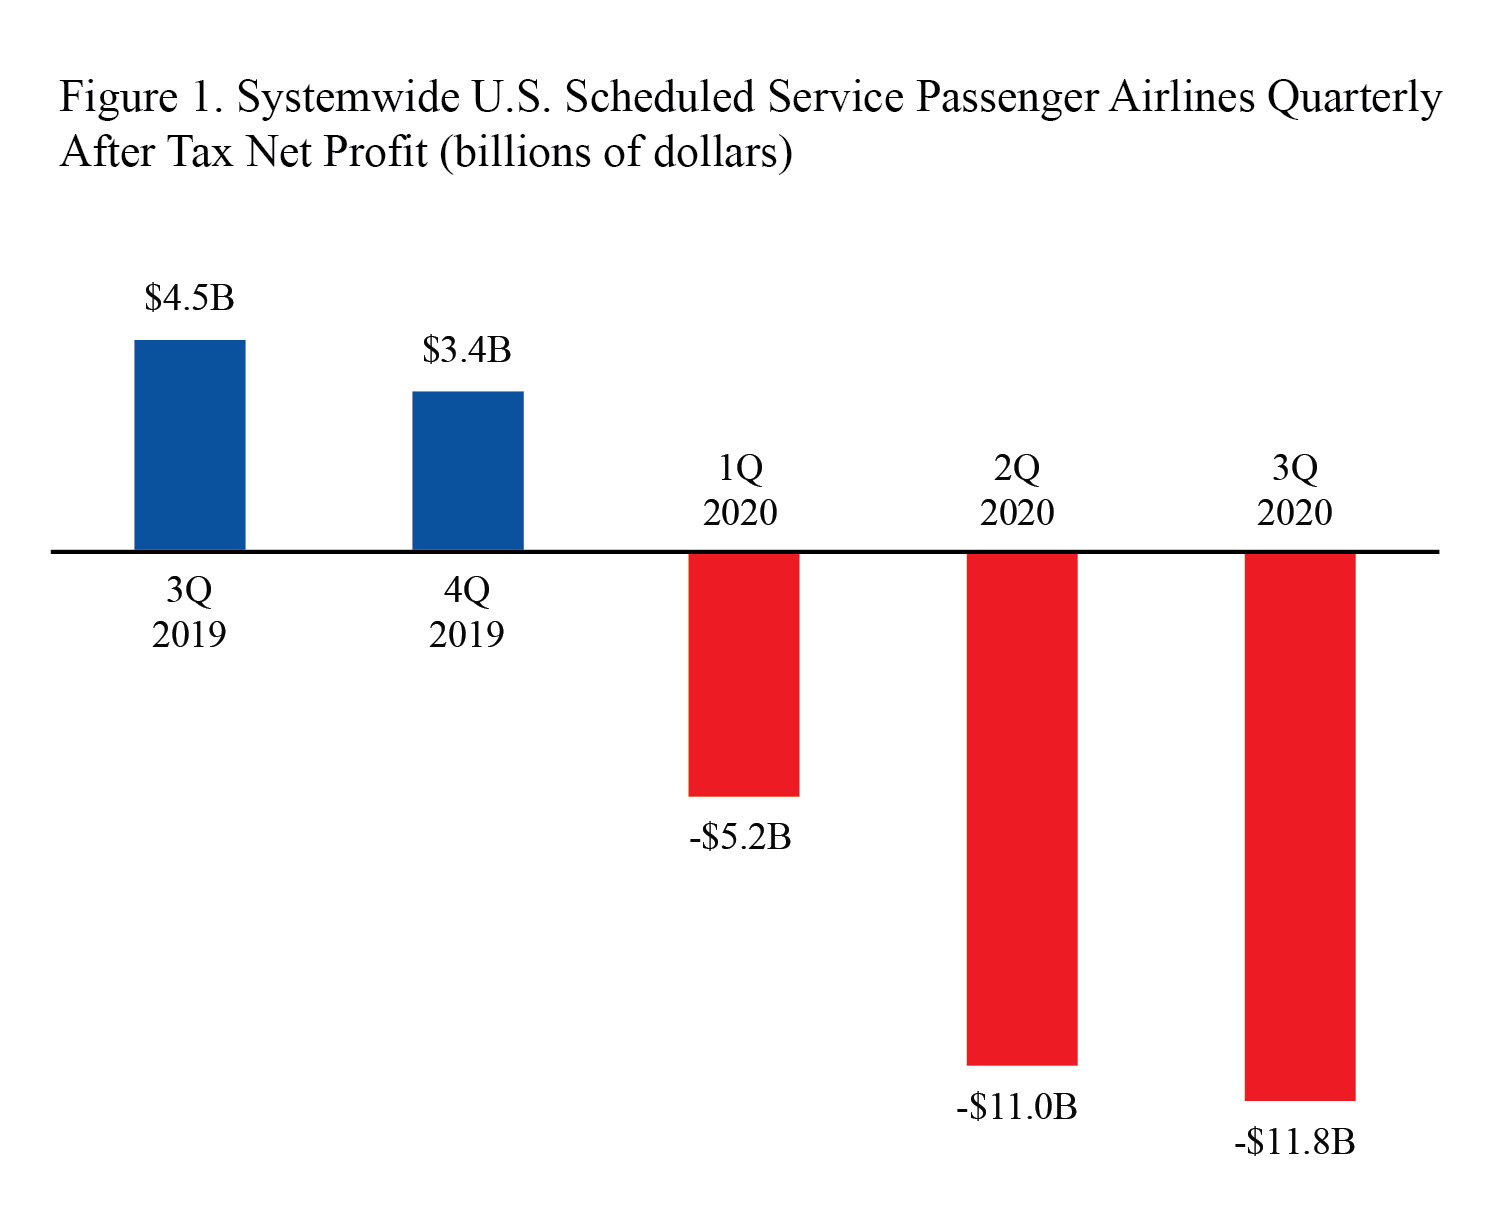
U.S. Airline Financial Data, Third Quarter 2020
Released Dec. 7
U.S. scheduled passenger airlines reported a third-quarter 2020 after-tax net loss of $11.8 billion and a pre-tax operating loss of $15.9 billion. These third-quarter losses are the third consecutive quarterly losses following 27 consecutive quarterly after-tax net profits and 35 consecutive quarterly pre-tax operating profits. One year earlier, in the third quarter of 2019, the airlines reported an after-tax net profit of $4.6 billion and a pre-tax operating profit of $6.4 billion. Additional financial numbers for all airlines are available on the BTS financial databases.
See BTS Release Schedule
BTS Contact: Dave Smallen
202-366-5568


