
Under a Quarter of Population Exposed to Office-Type Transportation Noise
U.S. Department of Transportation sent this bulletin at 11/18/2020 10:17 AM EST |
|
Having trouble viewing this email? View it as a Web page.
|
 |
U.S. Department of Transportation
Office of Public Affairs
1200 New Jersey Avenue, SE
Washington, DC 20590
BTS Data |
Under a Quarter of Population Exposed to Office-Type Transportation Noise
Fewer than one-fourth of the 2018 U.S. population was potentially exposed to aviation and road noise, ranging from the equivalent of what people normally experience in offices at the low end (10% of population exposed) to a lawn mower or garbage disposal at the high end (0.1% exposure), according to the updated interactive National Transportation Noise Map released today by the U.S. Department of Transportation’s Bureau of Transportation Statistics (BTS).
At these noise levels, 74 million people were potentially exposed to at least the noise of an office, 3.4% more than were potentially exposed in 2016, as defined by a 24-hour average sound level.
|
Decibel Range |
Population exposed, 2018 (millions) |
Percent of total population 2018 |
Population exposed, percent change, 2016-2018 |
|
45 to 49 (office) |
33.0 |
10.2% |
3.1% |
|
50 to 54 (conversation) |
20.9 |
6.5% |
3.6% |
|
55 to 59 (restaurant) |
11.3 |
3.5% |
1.5% |
|
60 to 69 (vacuum cleaner) |
7.5 |
2.3% |
6.2% |
|
70 to 79 (garbage disposal |
1.7 |
0.5% |
5.9% |
|
80+ (power lawn mower) |
0.3 |
0.1% |
15.4% |
|
Total combined noise above 45 |
74.7 |
23.1% |
3.4% |
Numbers in the table are the total population that had the potential to be exposed to the average sound levels for the day (A-weighted 24-hour equivalent sound levels (LAEQ)).
Today’s release is the first biennial update of a tool that allows the public to view geographic trends of transportation-related noise. This map highlights the changes in transportation noise since the release of the inaugural map in 2017. The updated map includes passenger rail-related noise which was not part of the previous version and, therefore, cannot be used to compare changes.
The multi-modal National Transportation Noise Map facilitates the tracking of trends in transportation-related noise produced by both individual modes – whether aviation, highway, or passenger rail, the newest addition to the tool – and collectively across all three modes. Passenger rail noise includes commuter rail mainline, high-speed electric, Light Rail Transit (LRT) and Rail Rapid Transit (RRT), and street cars.
For additional information, see the interactive web map and the interactive transportation noise map story.
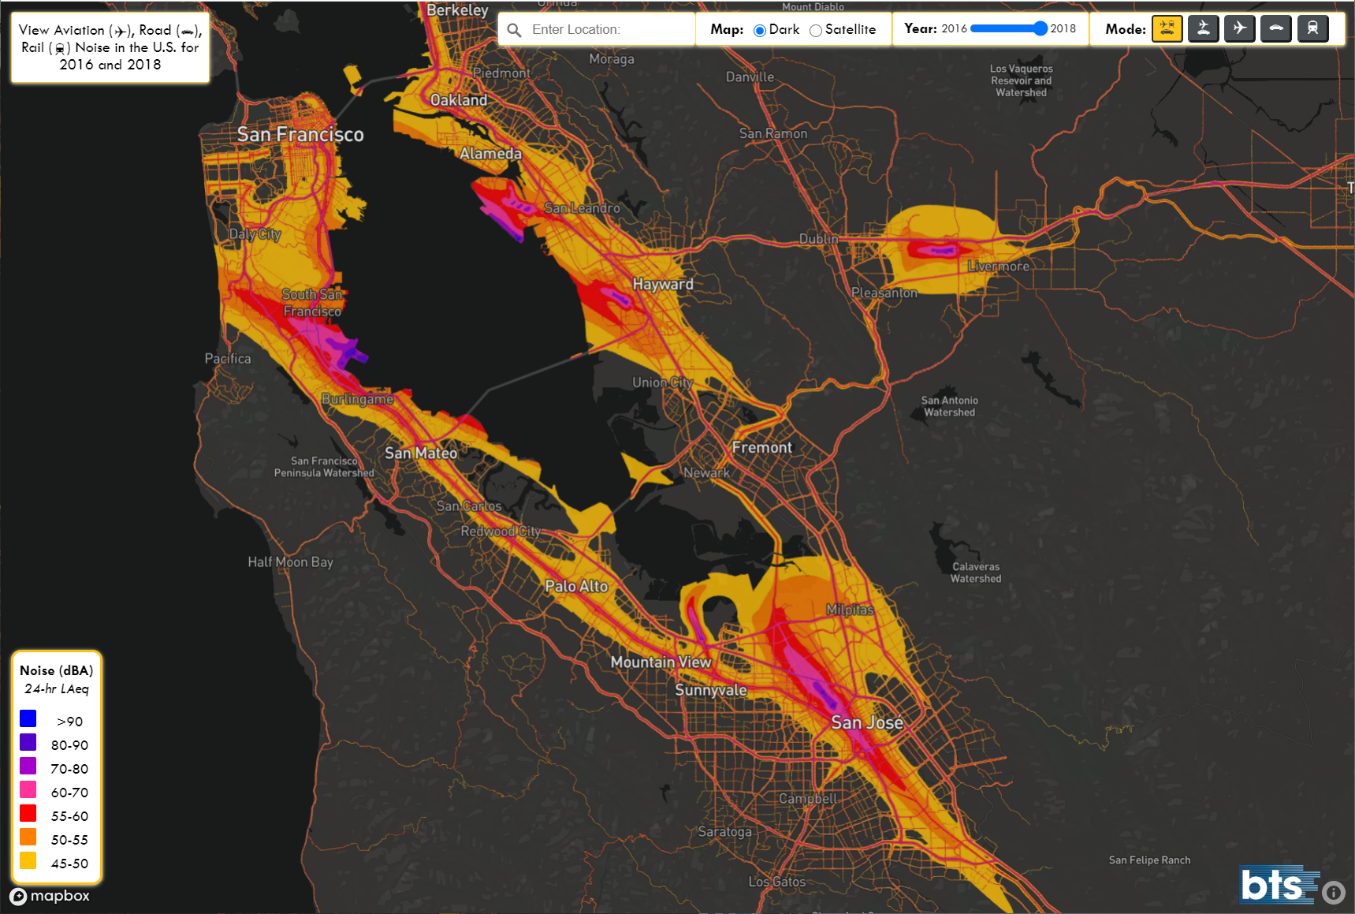
Map of aviation, highway and rail noise in the San Francisco Bay Area, from the new interactive web application.
This newest update enables users to interactively compare changes in potential noise between 2016 and 2018 for aviation and highway modes.
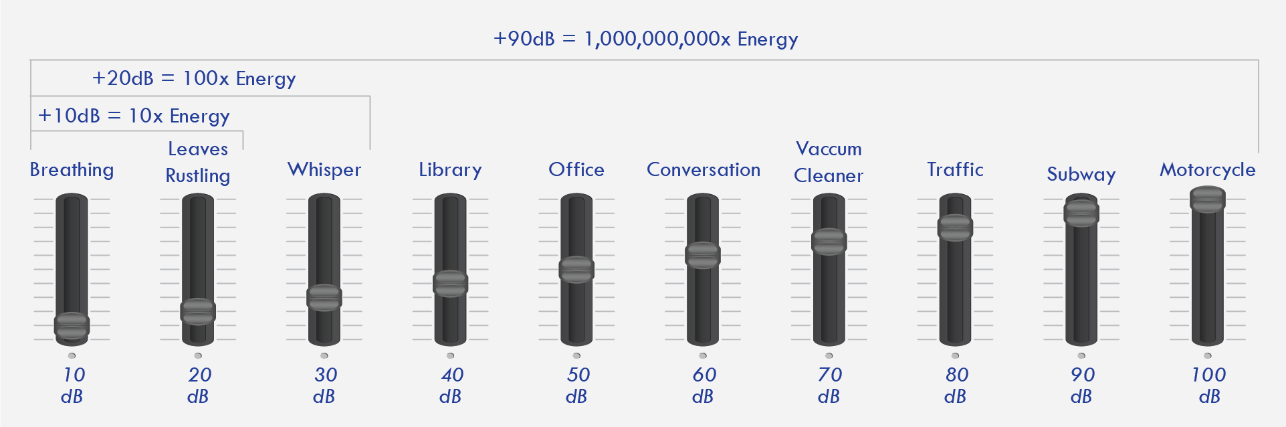
The decibels produced by a range of everyday objects, a reference for the sounds referenced on the Noise Map.
Decibels are the primary measurement of sound and the unit of the values depicted on the National Transportation Noise Map. A decibel indicates the amount of sound-producing energy emitted by an object. The decibel values shown on the Noise Map are therefore estimates of the average quantity of noise energy emitted by one or more modes of transportation at each location during a given 24-hour period.
This national multimodal transportation noise mapping initiative used data sources from the Federal Highway Administration (FHWA), the Federal Railroad Administration (FRA), and the Federal Aviation Administration (FAA) to create a comprehensive map of noise levels. The noise data visualized on the map should be used for the purpose of tracking trends, not for assessing impact. These maps are based on simplified noise modeling and cannot be used to evaluate noise levels in individual locations or at specific times and should not be used for regulatory purposes.
The National Transportation Noise Map will continue to be a part of the National Transportation Atlas Database (NTAD), a set of nationwide geographic databases of transportation facilities, networks, and associated infrastructure available from the BTS Geospatial Data Catalog. The layers will continue to be updated on a bi-annual basis, and future versions of the National Transportation Noise Map may include noise emitted by other modes of transportation, such as maritime.
|
You are subscribed to DOT email updates. Subscriber Services: Manage Preferences |
|
||||||||||||
