BTS 2-Week Outlook
Bureau of Transportation Statistics Upcoming Releases
November 9 - 20
Upcoming from November 9
Tuesday, November 10, 2020
Tuesday, November 10, 2020
U.S. Airlines Cargo, September 2020 (preliminary)
Thursday, November 12, 2020 - 10:00am ET
Transportation Services Index, September 2020
Friday, November 13, 2020 - 11:00am ET
Airline Traffic Data, August 2020 Reported
Tuesday, November 17, 2020
Monday, November 16, 2020 - 11:00am ET
Passenger Airline Employment, September 2020
Friday, November 20, 2020 - 11:00am ET
North American Freight Data, September 2020
TBD
Airline On-Time/Tarmac Data, August 2020
Previously Released
October 26 – Average Domestic Air Fares, Second Quarter 2020
October 27 – North American Freight Data, August 2020
November 4 - Airline Fuel Cost and Consumption, September 2020
November 5 - Airline Full-Time/Part-Time Employment, September 2020
BTS Releases in the Next Two Weeks
-
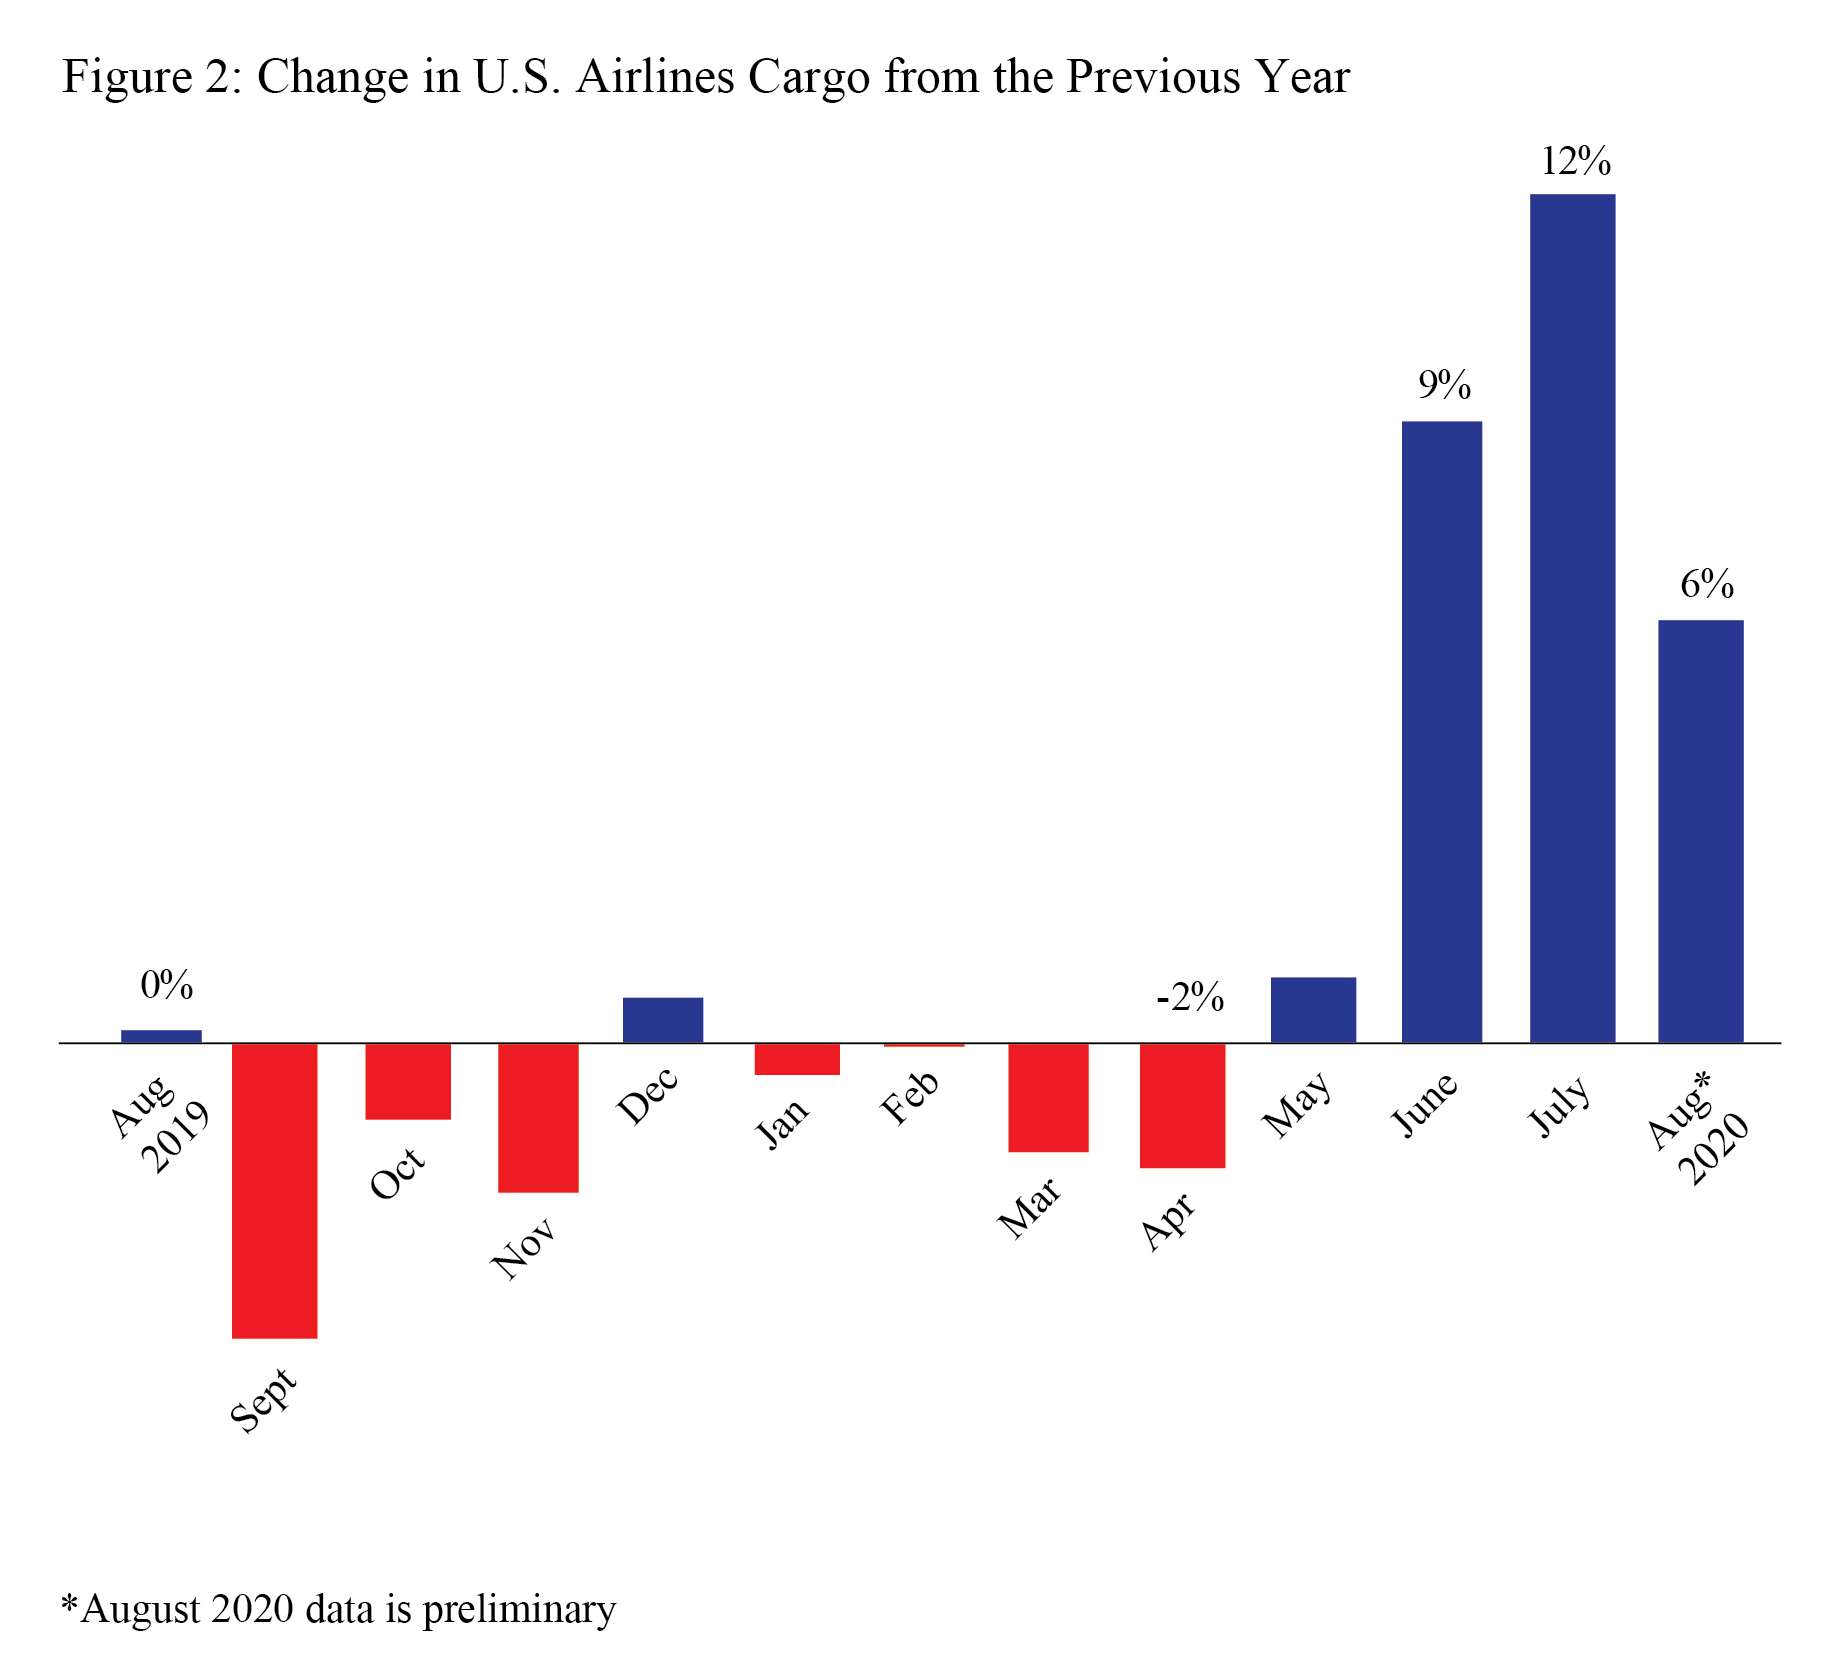
U.S. Airlines Cargo, September 2020 (Preliminary)
Tuesday, November 10, 2020
This release provides preliminary monthly cargo data from the U.S. airlines that carry the most cargo. These airlines carry 95% of the cargo (freight + mail) on U.S. airlines. From the previous month’s release, U.S. airlines carried 6% more cargo by weight in August 2020 (preliminary) than in August 2019. The rise was fueled by a gain of 8% in domestic cargo with a 1% rise in international cargo.
-
Freight Transportation Services Index (TSI), September 2020
Thursday, November 12, 2020 - 10:00am ET
The Freight TSI measures the month-to-month changes in for-hire freight shipments by mode of transportation. In the previous release for August, the Freight TSI fell 1.3% in August from revised July, declining after two months of increases. From August 2019 to August 2020, the index fell 7.4% compared to a rise of 3.9% from August 2018 to August 2019 and a rise of 5.7% from August 2017 to August 2018.
-
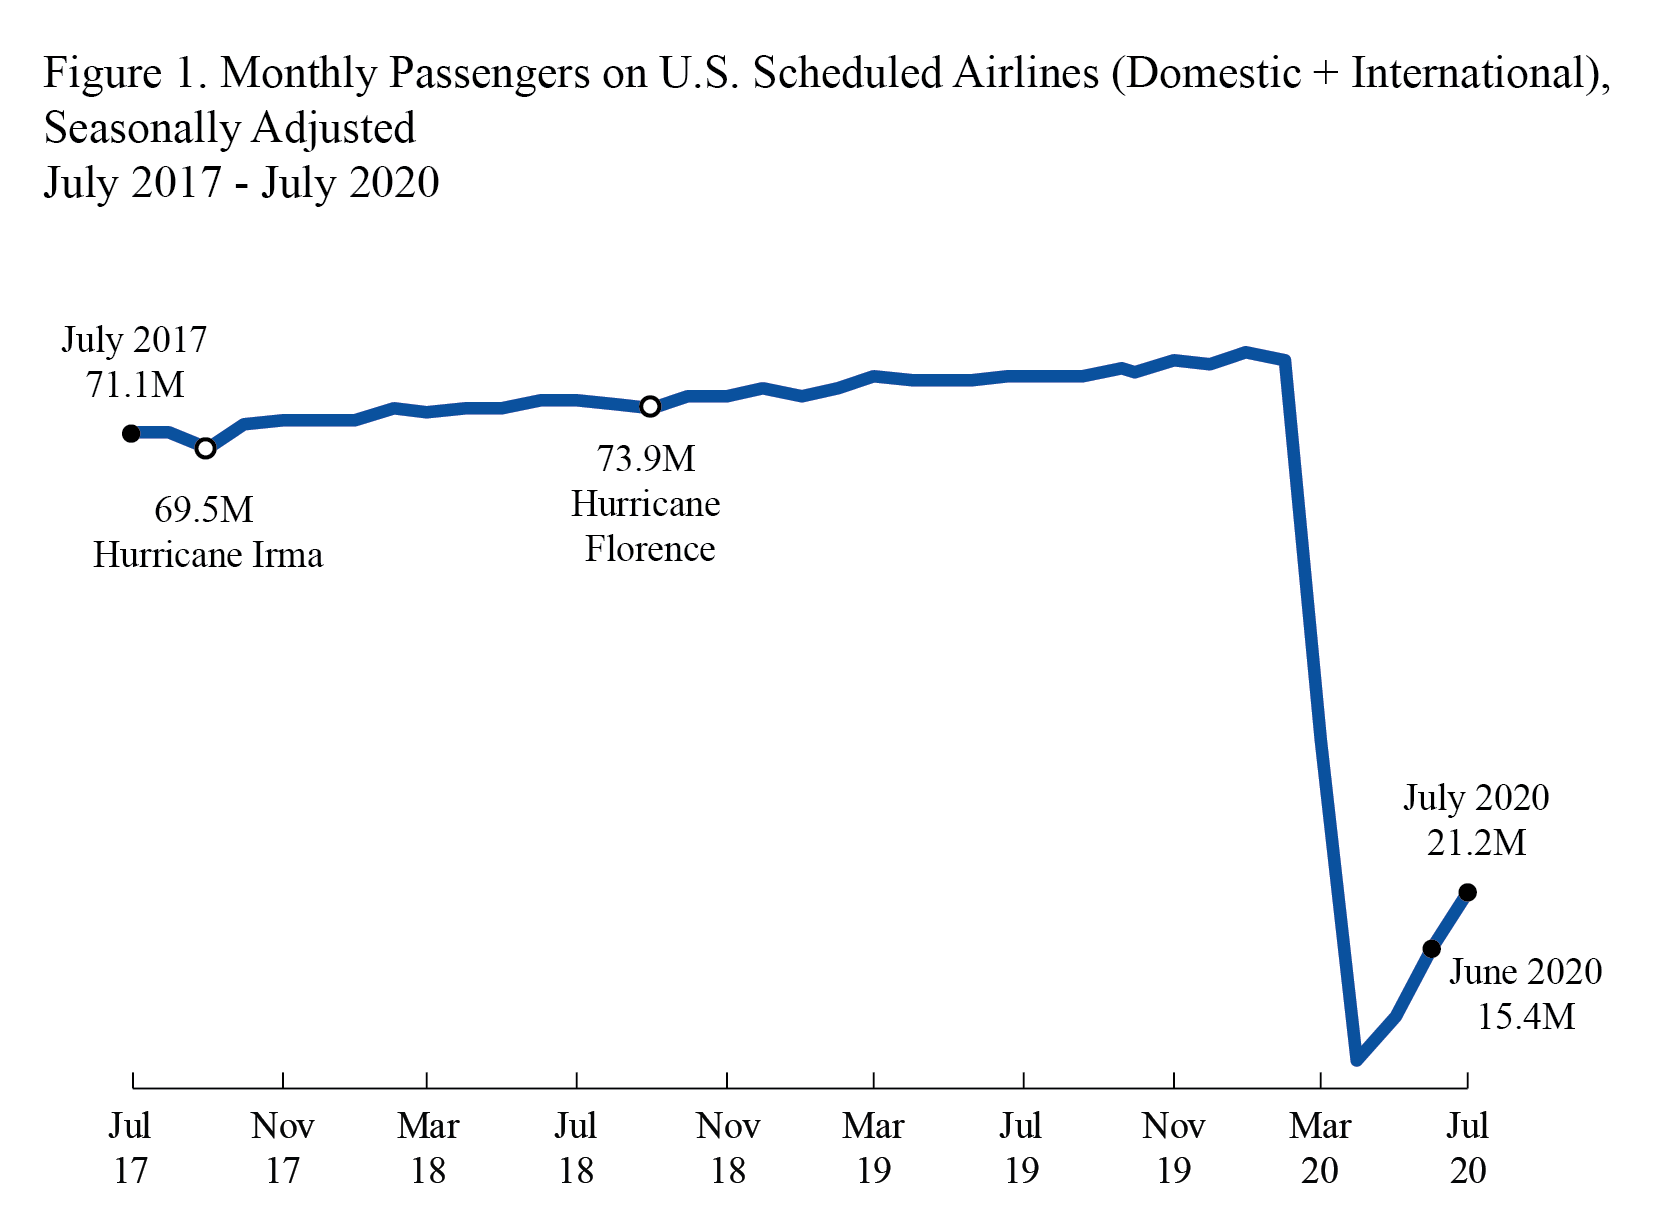
Airline Traffic Data, August 2019 final
Friday, November 13, 2020 - 11:00am ET
BTS release of reported airline data through August. Data are for U.S. airlines monthly passengers, revenue passenger-miles, available seat-miles and load factor for systemwide, domestic and international. Numbers are seasonally-adjusted and unadjusted. In the previous release, U.S. airlines carried 16.5 million systemwide (domestic and international) scheduled service passengers in June 2020 (unadjusted). There were 16.1 million domestic passengers and 0.4 million international passengers on U.S. airlines flights in June.
-
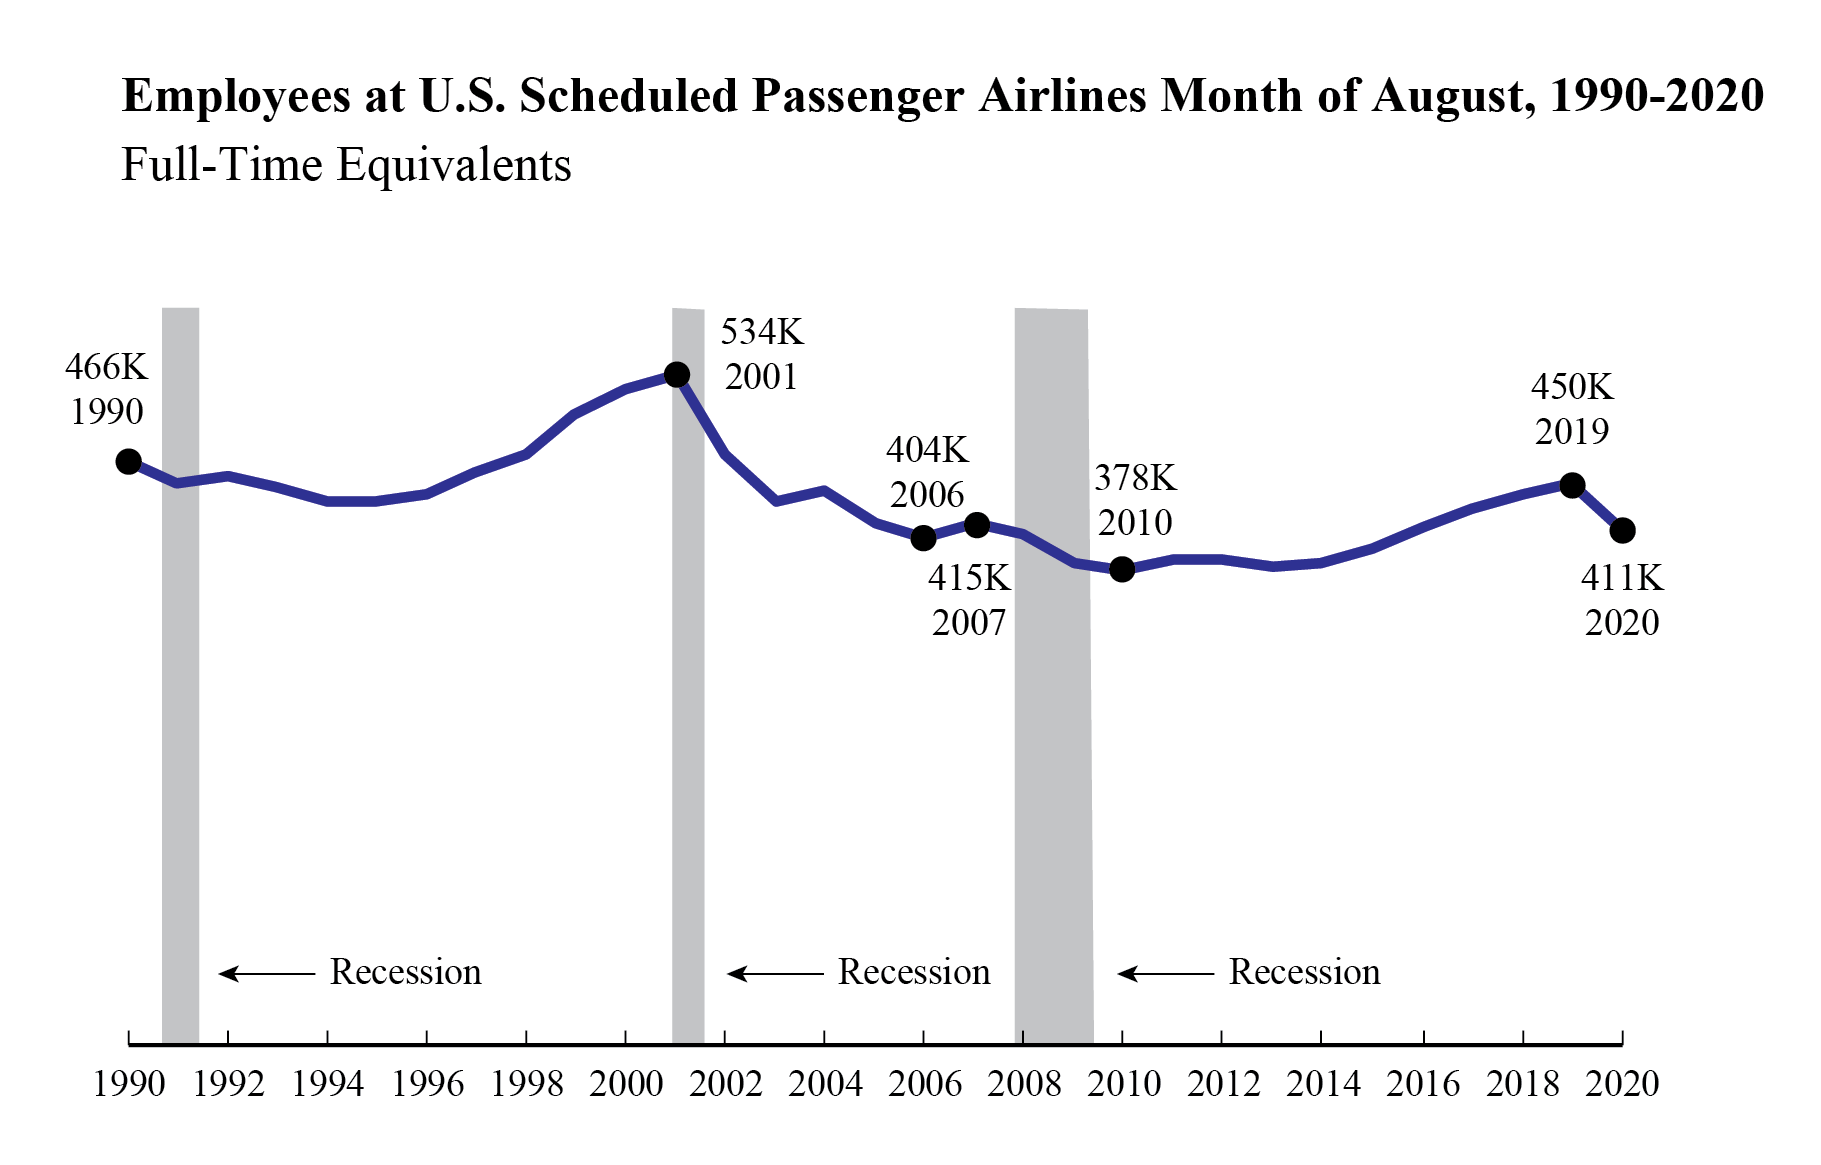
Passenger Airline Employment, September 2020
Monday, November 16, 2020 - 11:00am ET
The release details full-time equivalent (FTE) employment numbers for U.S. scheduled service passenger airlines. Previously, BTS reported that U.S. scheduled passenger airlines employed 1.0% fewer full-time equivalents (FTEs) in mid-August 2020 than in mid-July 2020. Mid-August’s total number of FTEs (411,176) was down 4,000 FTEs from mid-July 2020 (415,154 FTEs) and down nearly 49,000 FTEs from mid-March 2020. August 2020 was the lowest FTE total for any August since 2015 (397,007 FTEs). Mid-August 2020 FTEs were down more than 38,000 FTEs, down 8.5%, from August 2019 (449,550 FTEs). Regulations require airlines to report employment numbers for a pay period near the 15th of the month.
-
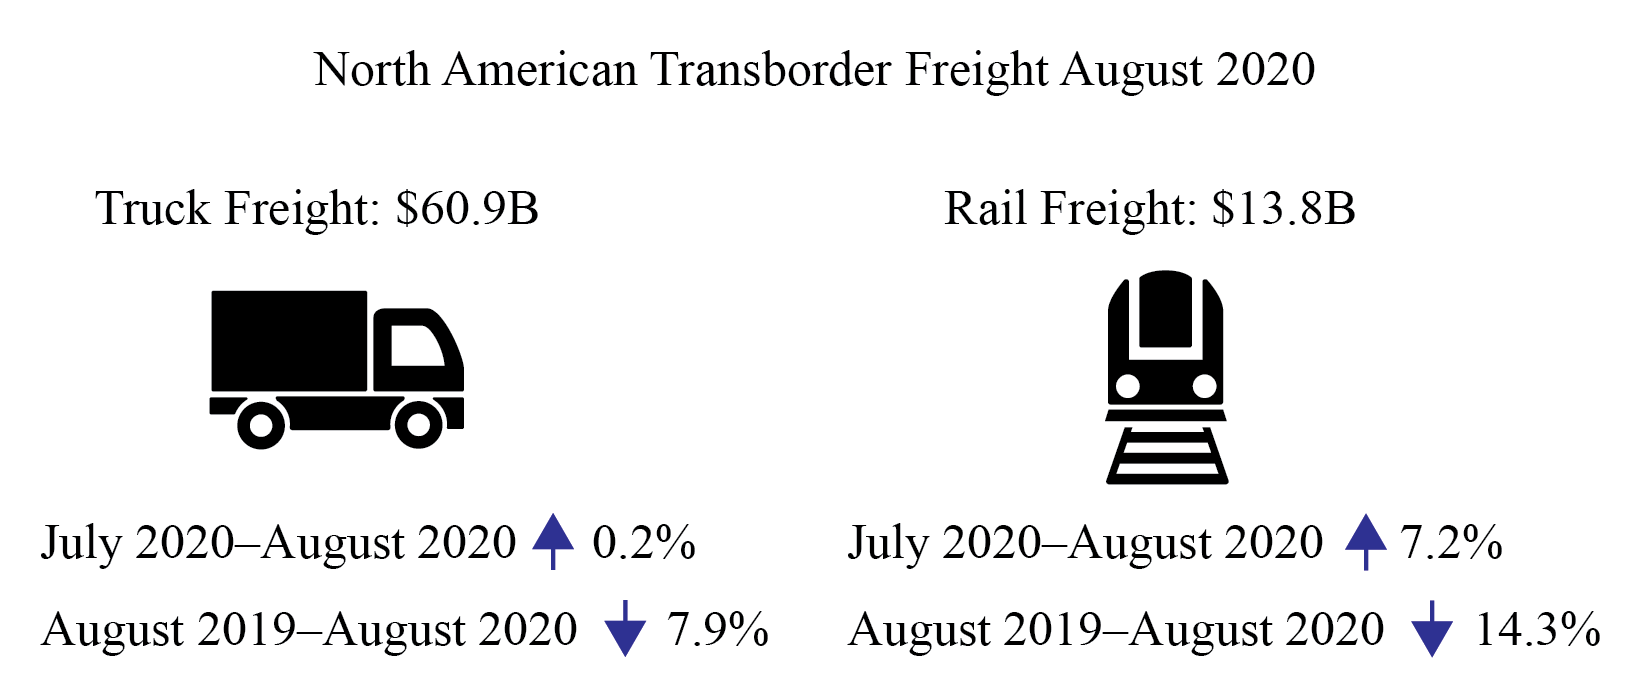
North American Transborder Freight Data, September 2020
Friday, November 20, 2020 - 11:00am ET
The release summarizes the monthly value of freight transported by truck, rail and other modes between the U.S. and Canada and the U.S. and Mexico with the top states, ports and commodities. Previously, BTS reported that the value of total Transborder freight in August 2020 was $93 billion, up 2.7% compared to July 2020 but down 11.1% compared to August 2019.
-
Air Travel Consumer Report: August 2020 Numbers
Date TBD
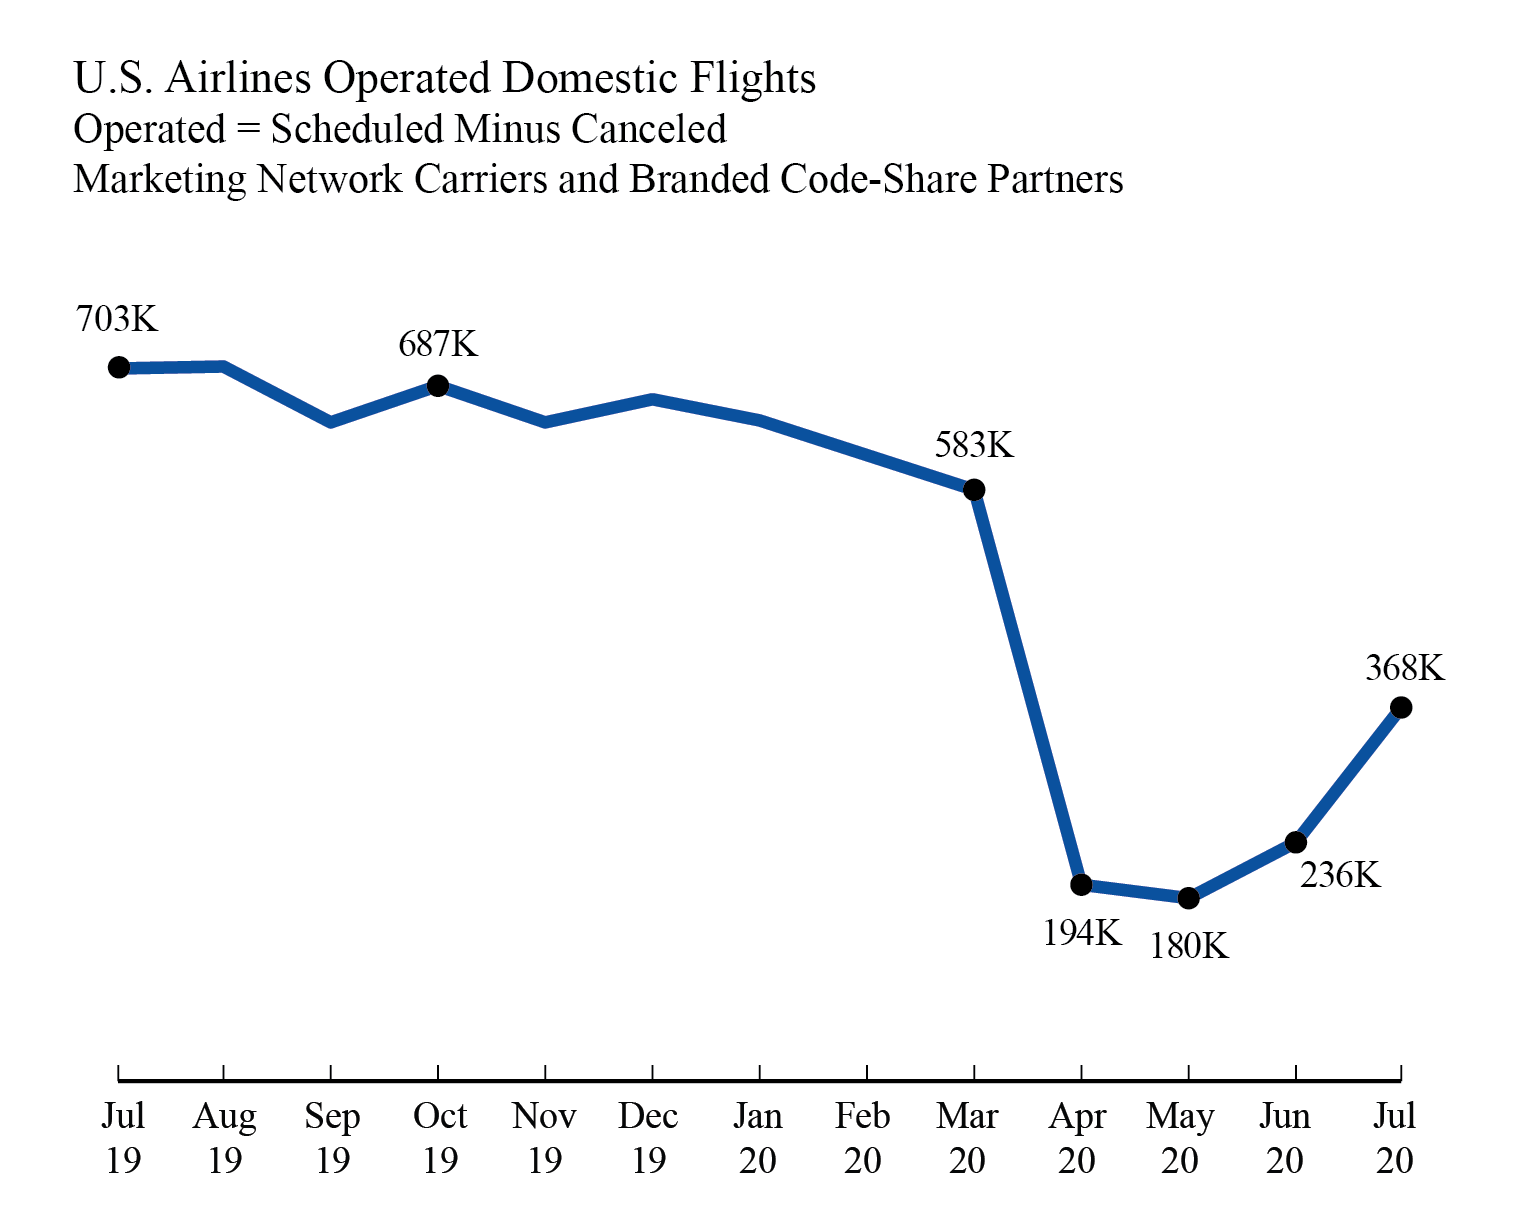
This release consists on U.S. airline domestic monthly on-time performance, cancellations, tarmac data, mishandled baggage released in coordination with the Department of Transportation’s release of the Air Travel Consumer Report. From the previous month’s release, the 10 reporting marketing network carriers reported 370,859 scheduled domestic flights in July 2020 compared to 237,264 flights in June 2020 and 717,684 flights in July 2019. Of those 370,859 scheduled flights, 0.8%, 2,926 flights, were canceled. As a result of schedule reductions and cancellations, the carriers reported operating 367,933 flights in July 2020, compared to 236,234 flights in June 2020, the all-time monthly low of 180,151 flights in May 2020 and 194,390 flights in April 2020. The marketing carriers include branded code-share partners of mainline carriers.
-
U.S. Airlines Passengers, September 2020 (Preliminary)
Release TBD
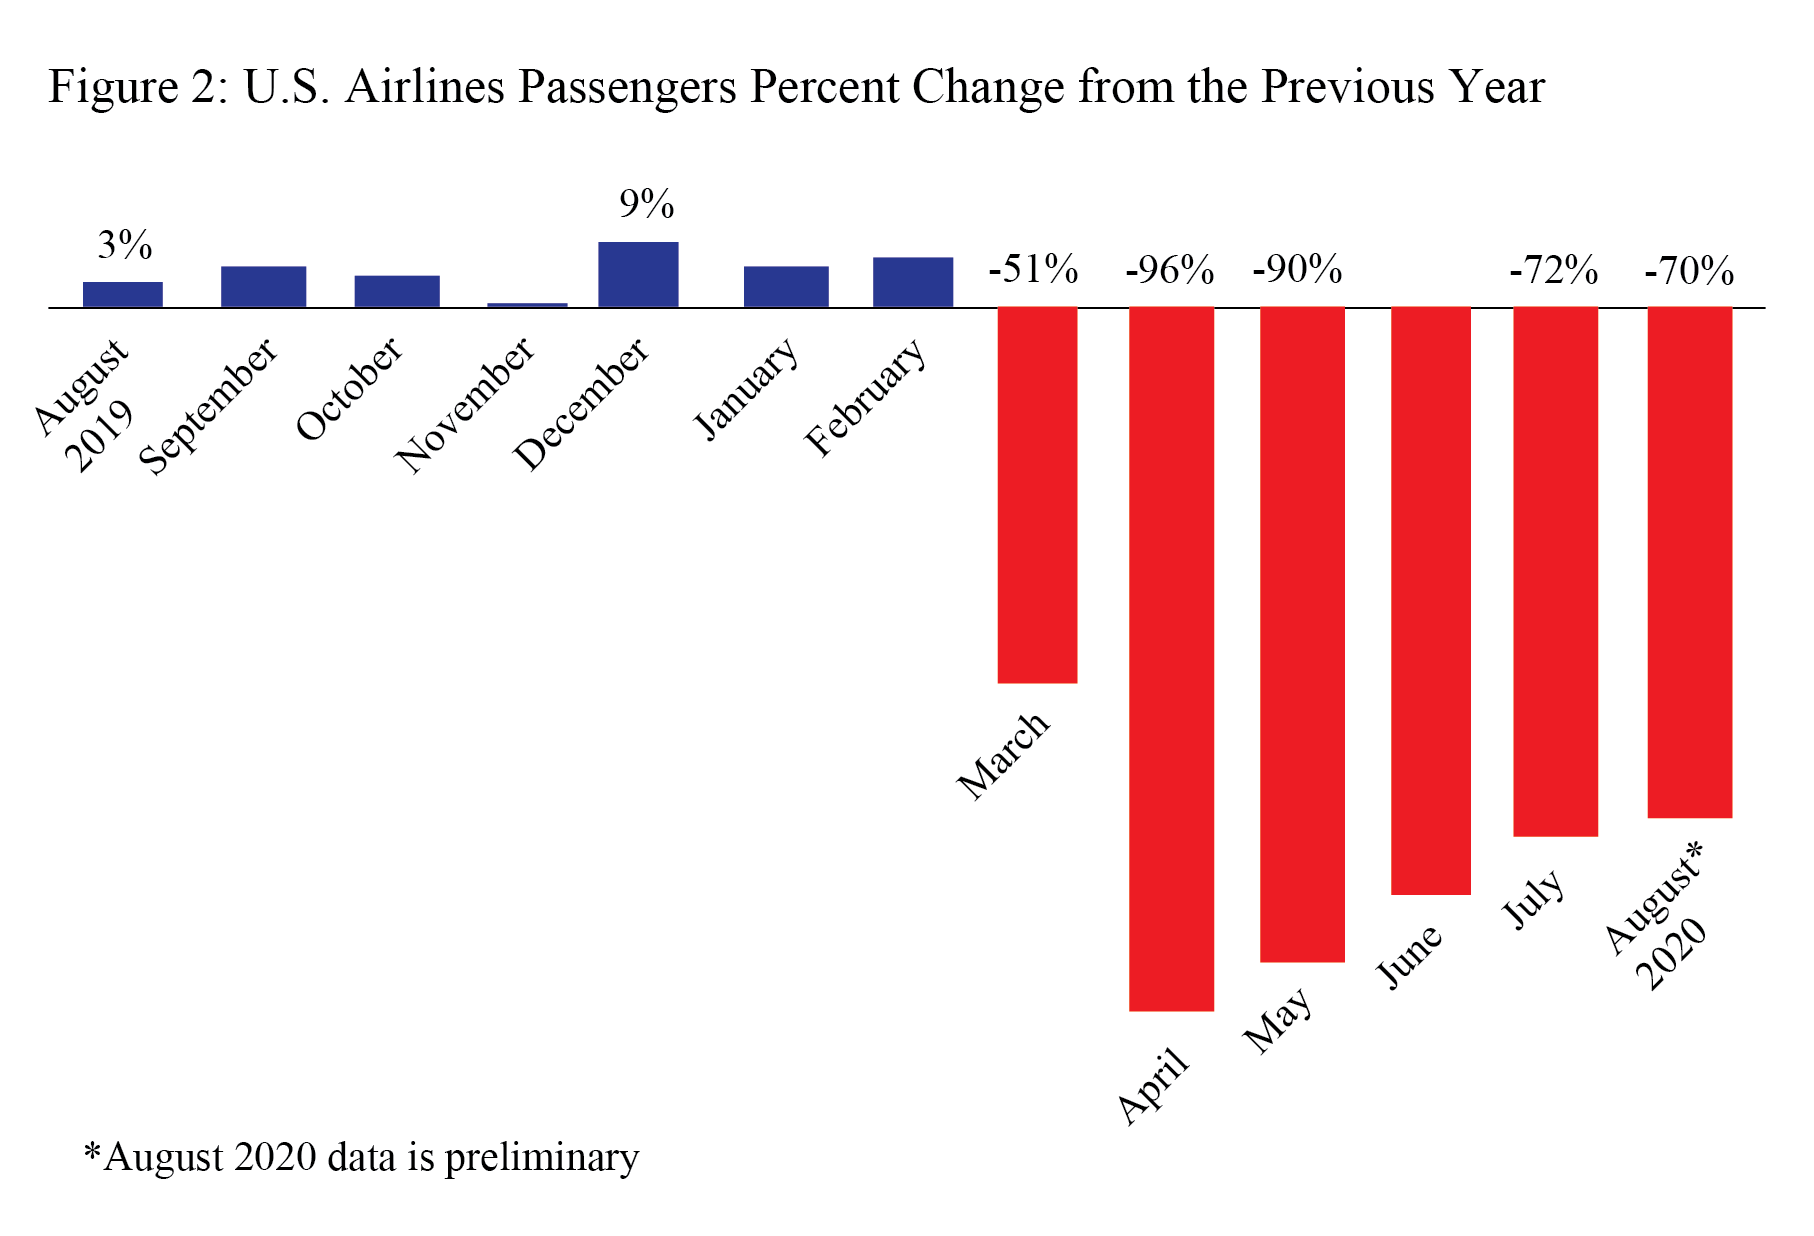
This release provides preliminary monthly passenger data from the U.S. airlines that carry the most passengers. These airlines carry 99% to scheduled service passengers on U.S. airlines. From the previous month’s release, U.S. airlines 70% fewer scheduled service passengers in August 2020 than in August 2019. Despite the large annual drop from pre-pandemic numbers a year earlier when compared to the previous month U.S. airlines carried 2% more passengers in August 2020 than in July 2020. The large airlines carried 24.4 million passengers in August 2020 (preliminary), up from 24.0 million passengers on all U.S. airlines in July 2020 and up from 3.0 million in April 2020, which was the lowest monthly total in BTS records dating back to 1974.
BTS Previously
BTS has released the following:
-
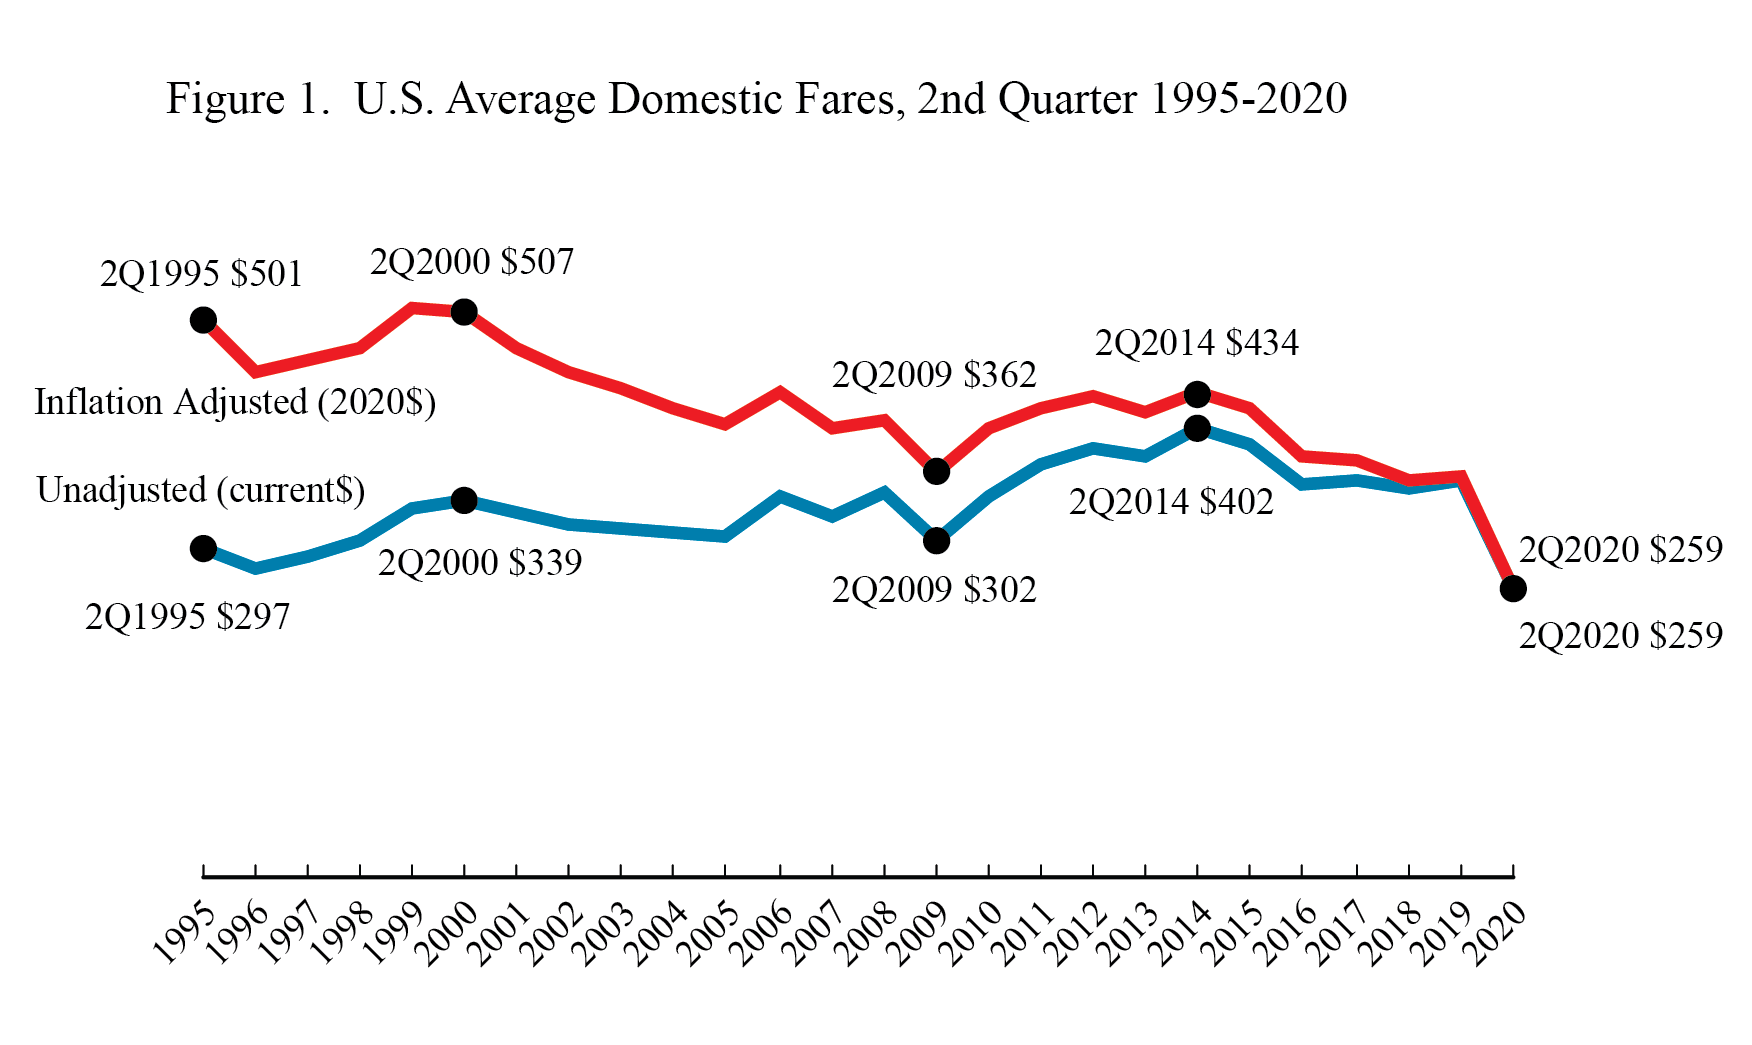
Average Air Fares, 2nd Quarter 2020
Released Oct. 26
U.S. domestic average air fares declined in the second quarter of 2020 to $259, the lowest inflation-adjusted quarterly air fare on record in Bureau of Transportation Statistics (BTS) records dating back to 1995. The previous low was $334 in the first quarter of 2020. Air fares declined along with passenger demand. Airlines reported 11.5 million originating passengers in the second quarter of 2020, down from 87.2 million passengers a year earlier.
-
North American Freight Data, August 2020
Released Oct. 27
See Upcoming releases for details
-
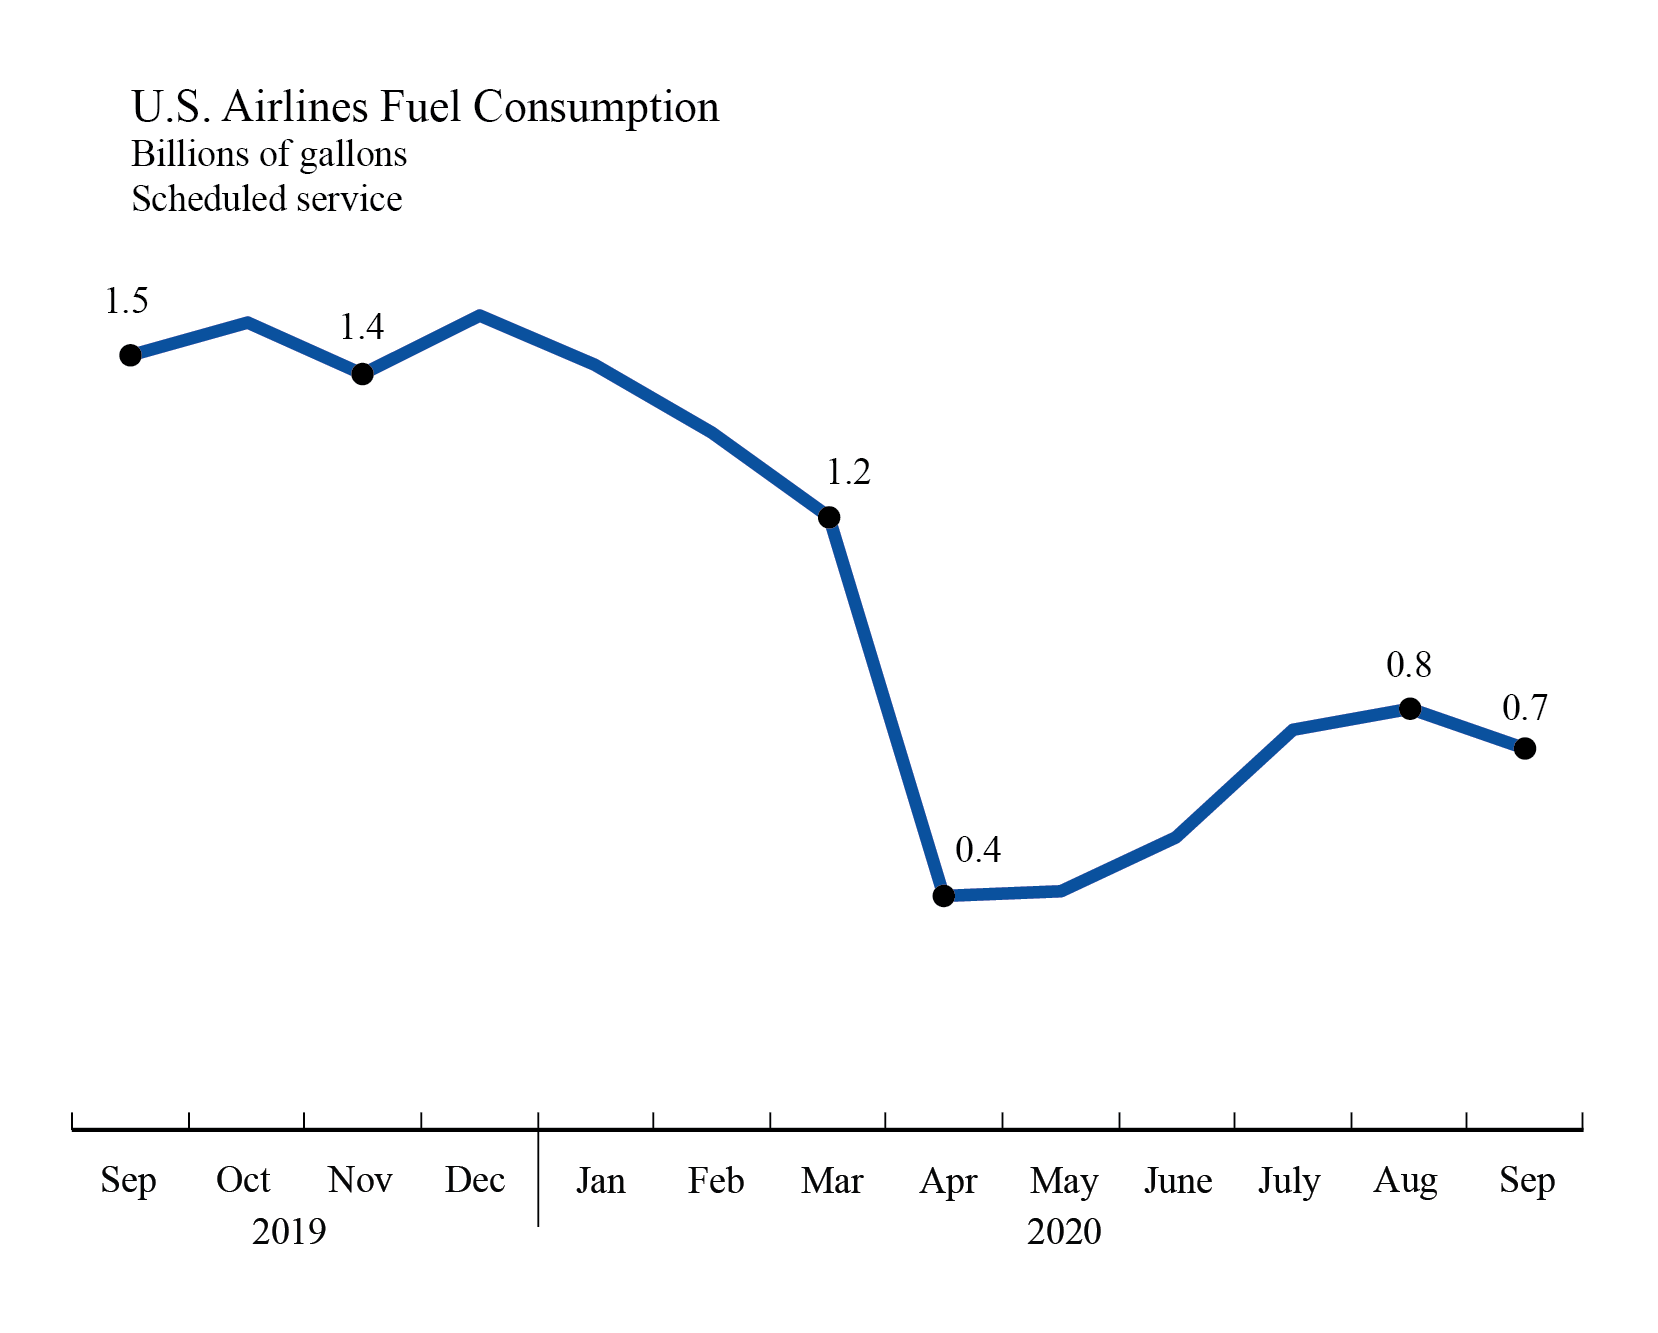
Airline Fuel Cost and Consumption, September 2020
Released Nov. 4
U.S. airlines September 2020 fuel consumption was 9% lower than August 2020, 5% lower than July 2020, 30% higher than June 2020, 61% higher than May 2020 and 63% higher than April 2020. April was the lowest monthly fuel usage on record (447M gallons), dating back to 2000. September 2020 fuel consumption was down 51% from September 2019.
Fuel consumed by U.S. airlines’ scheduled services:
September 2019 1.5 billion gallons
August 2020 801 million gallons
September 2020 728 million gallons
Individual airline numbers through June are available on the
BTS website.
-
Airline Industry Full-Time/Part-Time Employment, September 2020
Released Nov. 5
U.S. airlines employment:
September 2019 745,849
August 2020 704,486
September 2020 702,068
Regulations require airlines to report employment numbers for a pay period near the 15th of the month. Monthly full-time and part-time employment statistics are reported by U.S. airlines that operate at least one aircraft that has more than 60 seats or the capacity to carry a payload of passengers, cargo and fuel weighing more than 18,000 pounds.
See BTS Release Schedule
BTS Contact: Dave Smallen
202-366-5568


