
U.S. International Air Cargo Fell 6% in August 2020 from August 2019 while U.S.-Asia Cargo Rose 11% (Preliminary)
U.S. Department of Transportation sent this bulletin at 10/22/2020 10:09 AM EDT |
|
Having trouble viewing this email? View it as a Web page.
|
U.S. International Air Cargo Fell 6% in August 2020 from August 2019 while U.S.-Asia Cargo Rose 11% (Preliminary)
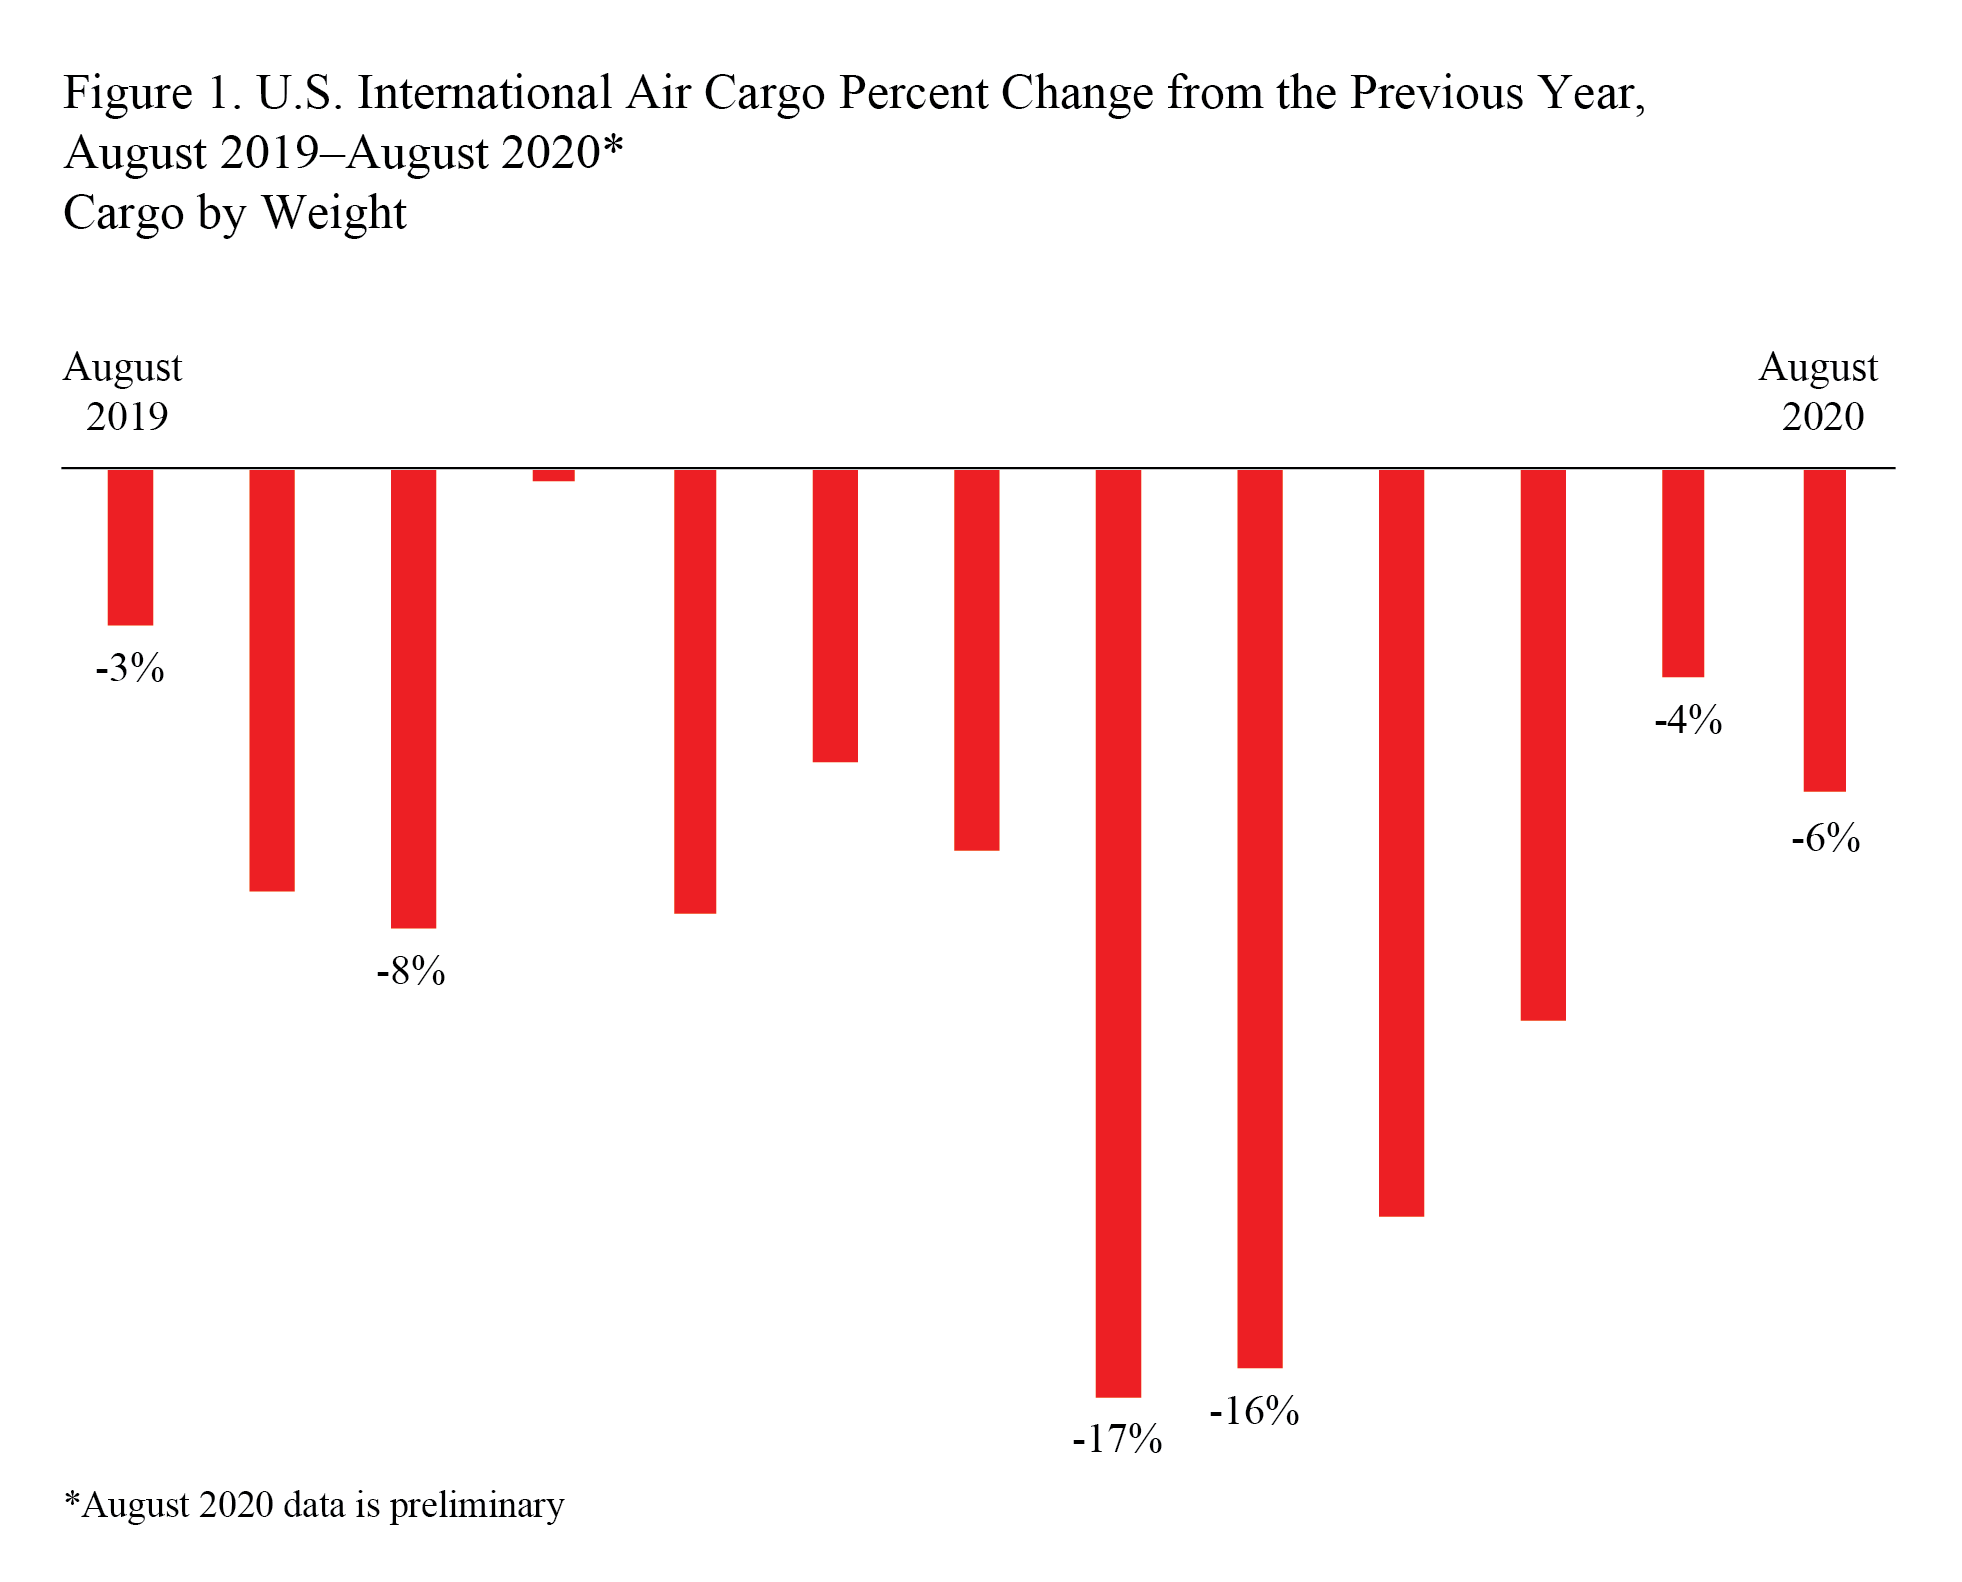
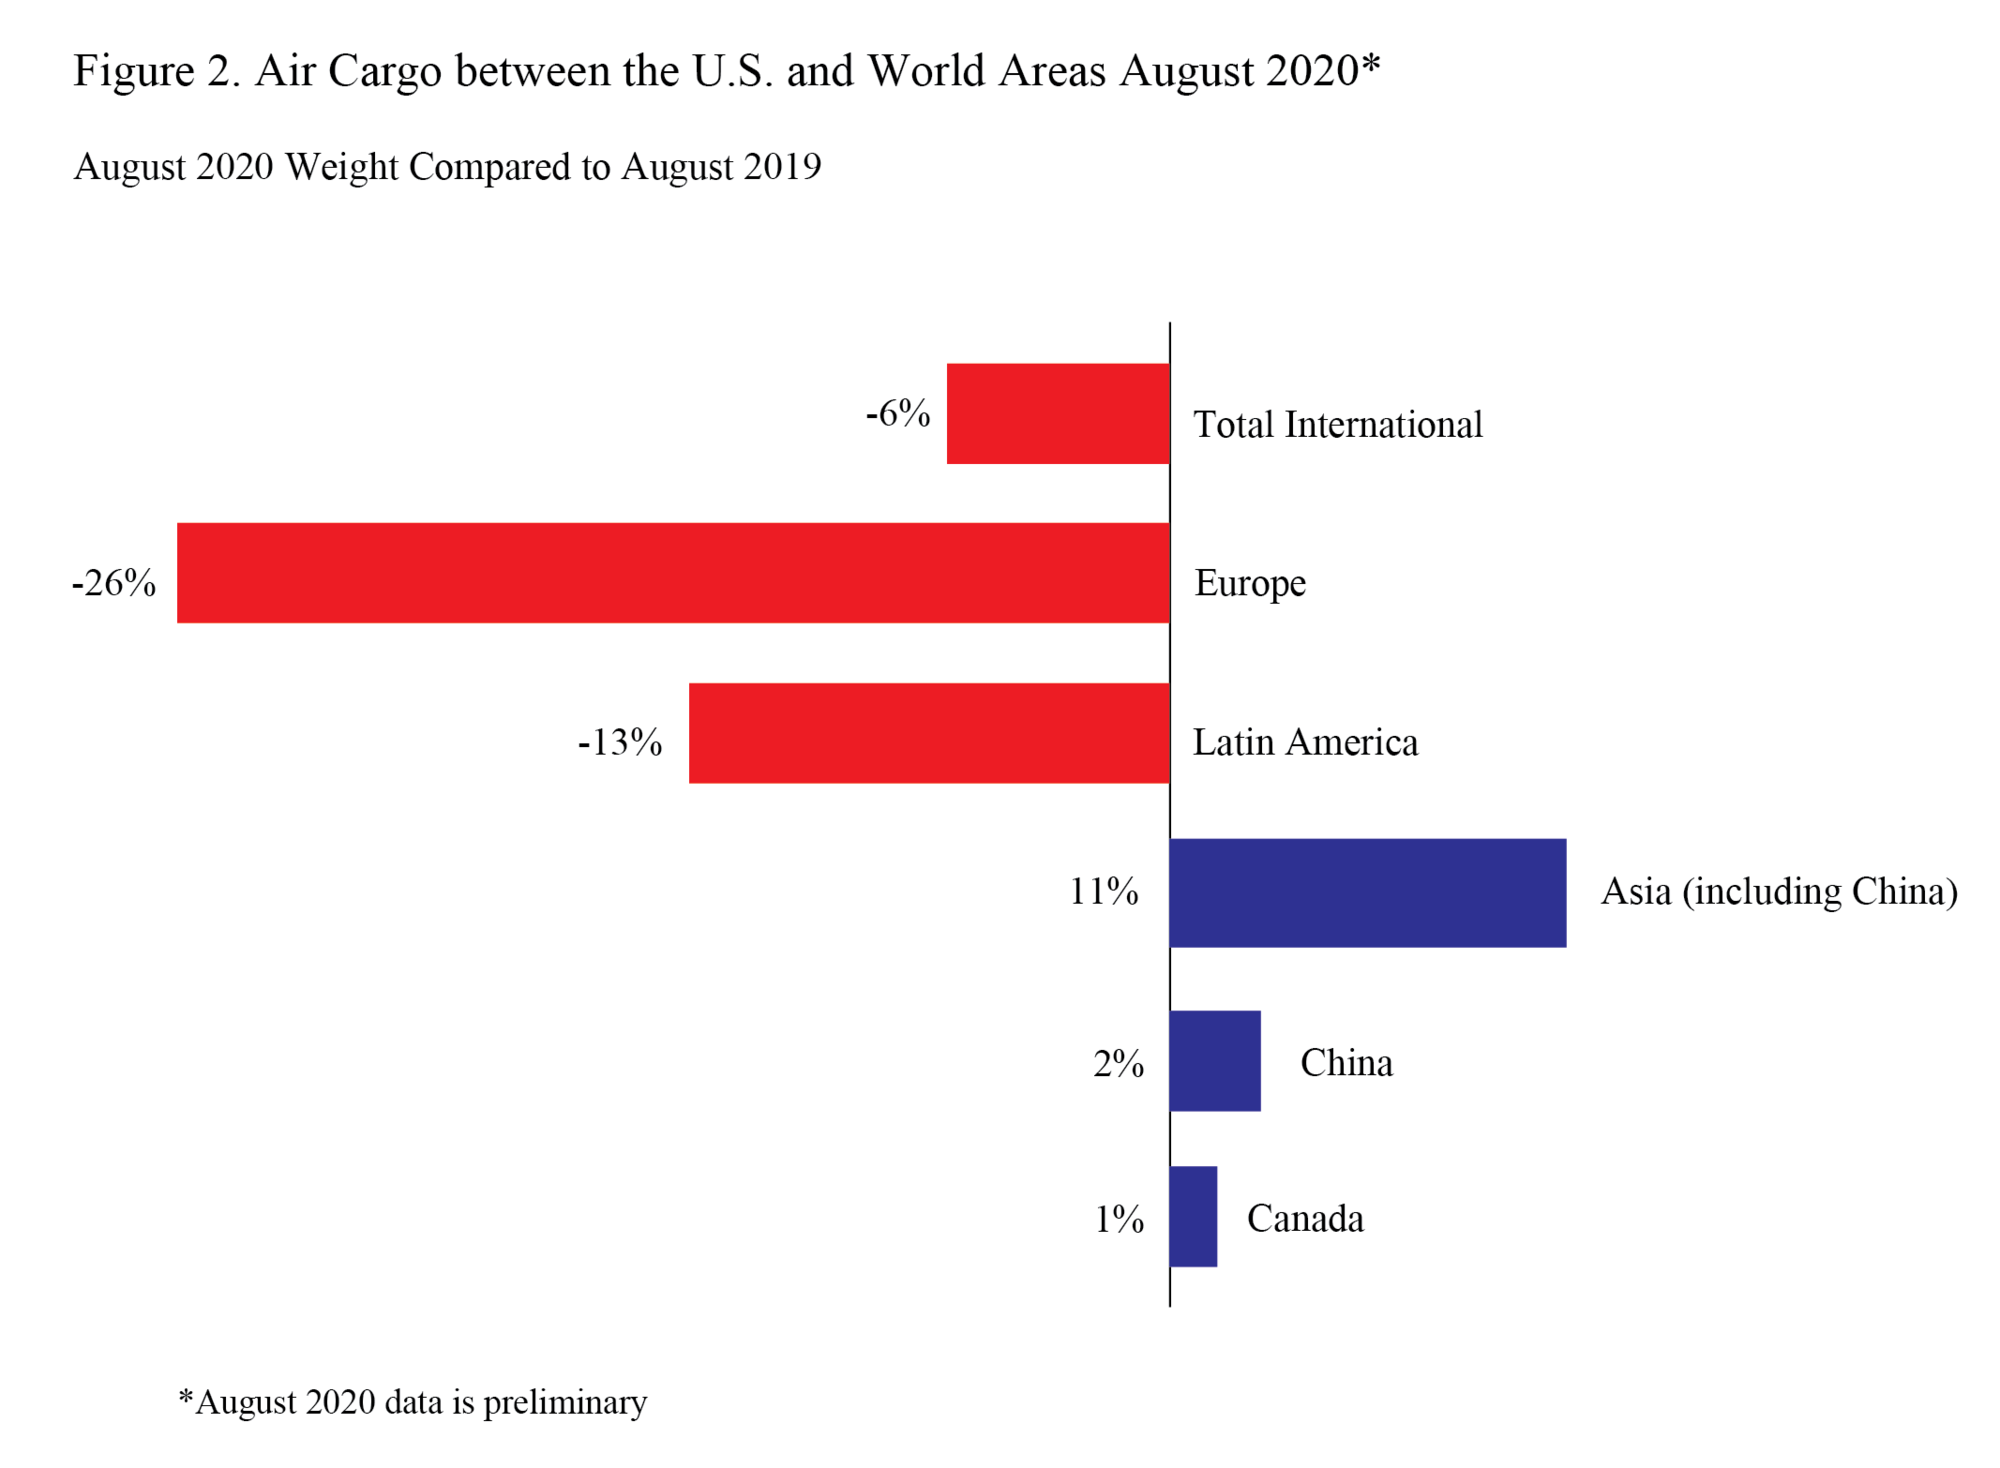
U.S. and foreign airlines carried 5.9% less cargo by weight (preliminary) between the U.S. and foreign points in August 2020 than in August 2019, despite a 10.5% rise in cargo between the U.S. and Asia, according to data filed with the Bureau of Transportation Statistics (BTS) by 33 large air carriers. The decline in August was larger than the 3.8% (revised) drop from July 2019 to July 2020.
The total to and from the U.S. includes world areas that are not shown separately.
Air cargo reports are filed monthly with BTS. August 2020 numbers in this release are preliminary with final data to be released on Nov. 13. Cargo data in this release are limited to shipments between U.S. and foreign points. Due to confidentiality requirements, public access to international origin and destination data of U.S. and foreign air carriers is restricted for a period of six months from the data date. Complete international data will be released on Feb. 11. Numbers in this release are based on world area codes.
|
Year-to-Year Percent Change |
||||
|
|
2016-2017 |
2017-2018 |
2018-2019 |
2019-2020 |
|
January |
8.5 |
13.8 |
-2.2 |
-5.4 |
|
February |
8.0 |
13.6 |
-5.4 |
-7.0 |
|
March |
10.2 |
11.6 |
-1.9 |
-17.0 |
|
April |
7.1 |
11.6 |
-8.2 |
-16.5 |
|
May |
12.5 |
11.3 |
-6.2 |
-13.7 |
|
June |
12.1 |
8.6 |
-6.8 |
-10.1 |
|
July |
13.5 |
3.2 |
-6.6 |
-3.8 |
|
August |
13.6 |
5.1 |
-2.9 |
-5.9* |
|
September |
10.0 |
5.7 |
-7.7 |
|
|
October |
12.2 |
2.0 |
-8.4 |
|
|
November |
17.9 |
-9.4 |
-0.2 |
|
|
December |
14.1 |
-1.7 |
-8.1 |
|
|
Annual |
11.8 |
5.7 |
-5.4 |
|
Source: Bureau of Transportation Statistics, T-100 International Market (All Carriers)
* August 2020 data is preliminary
See the tables that accompany this release on the BTS website for year-to-year changes since 2017 for Europe, Latin America, Asia (including China), China, and Canada.
Reporting Notes
Data are compiled from monthly reports filed with BTS by commercial U.S. air carriers detailing operations, passenger traffic, and cargo traffic. This release includes data received by BTS from 33 U.S. and foreign airlines as of Oct. 14.
See the BTS Airlines and Airports page for additional U.S. airlines numbers through July for U.S. airlines. International data by origin and destination is available through April.
None of the data are from samples. Measures of statistical significance do not apply to the complete air traffic data.
|
You are subscribed to DOT email updates. Subscriber Services: Manage Preferences |
|
||||||||||||
