
U.S. Airlines Carried 6% More Cargo in August 2020 than August 2019
U.S. Department of Transportation sent this bulletin at 10/15/2020 02:06 PM EDT |
|
Having trouble viewing this email? View it as a Web page.
|
U.S. Airlines Carried 6% More Cargo in August 2020 than August 2019
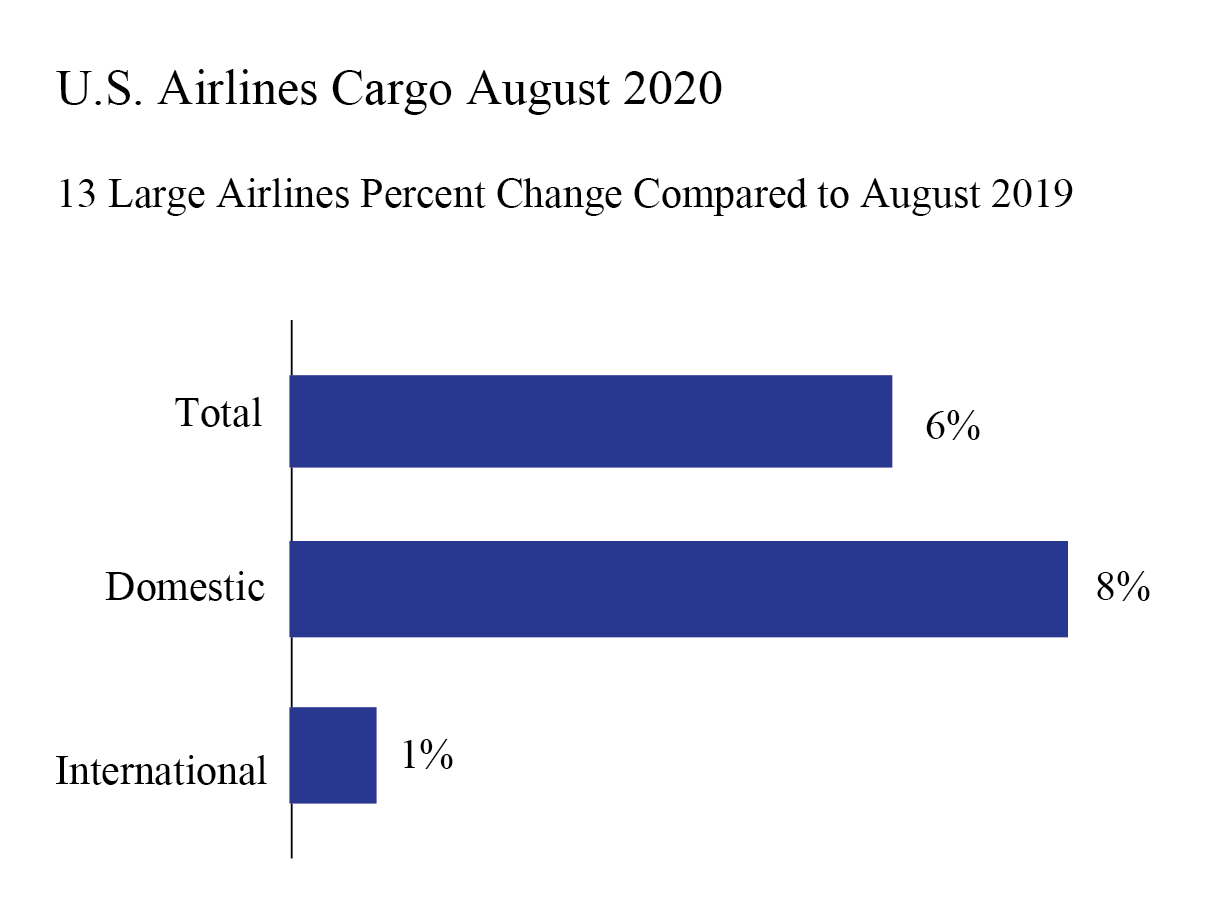
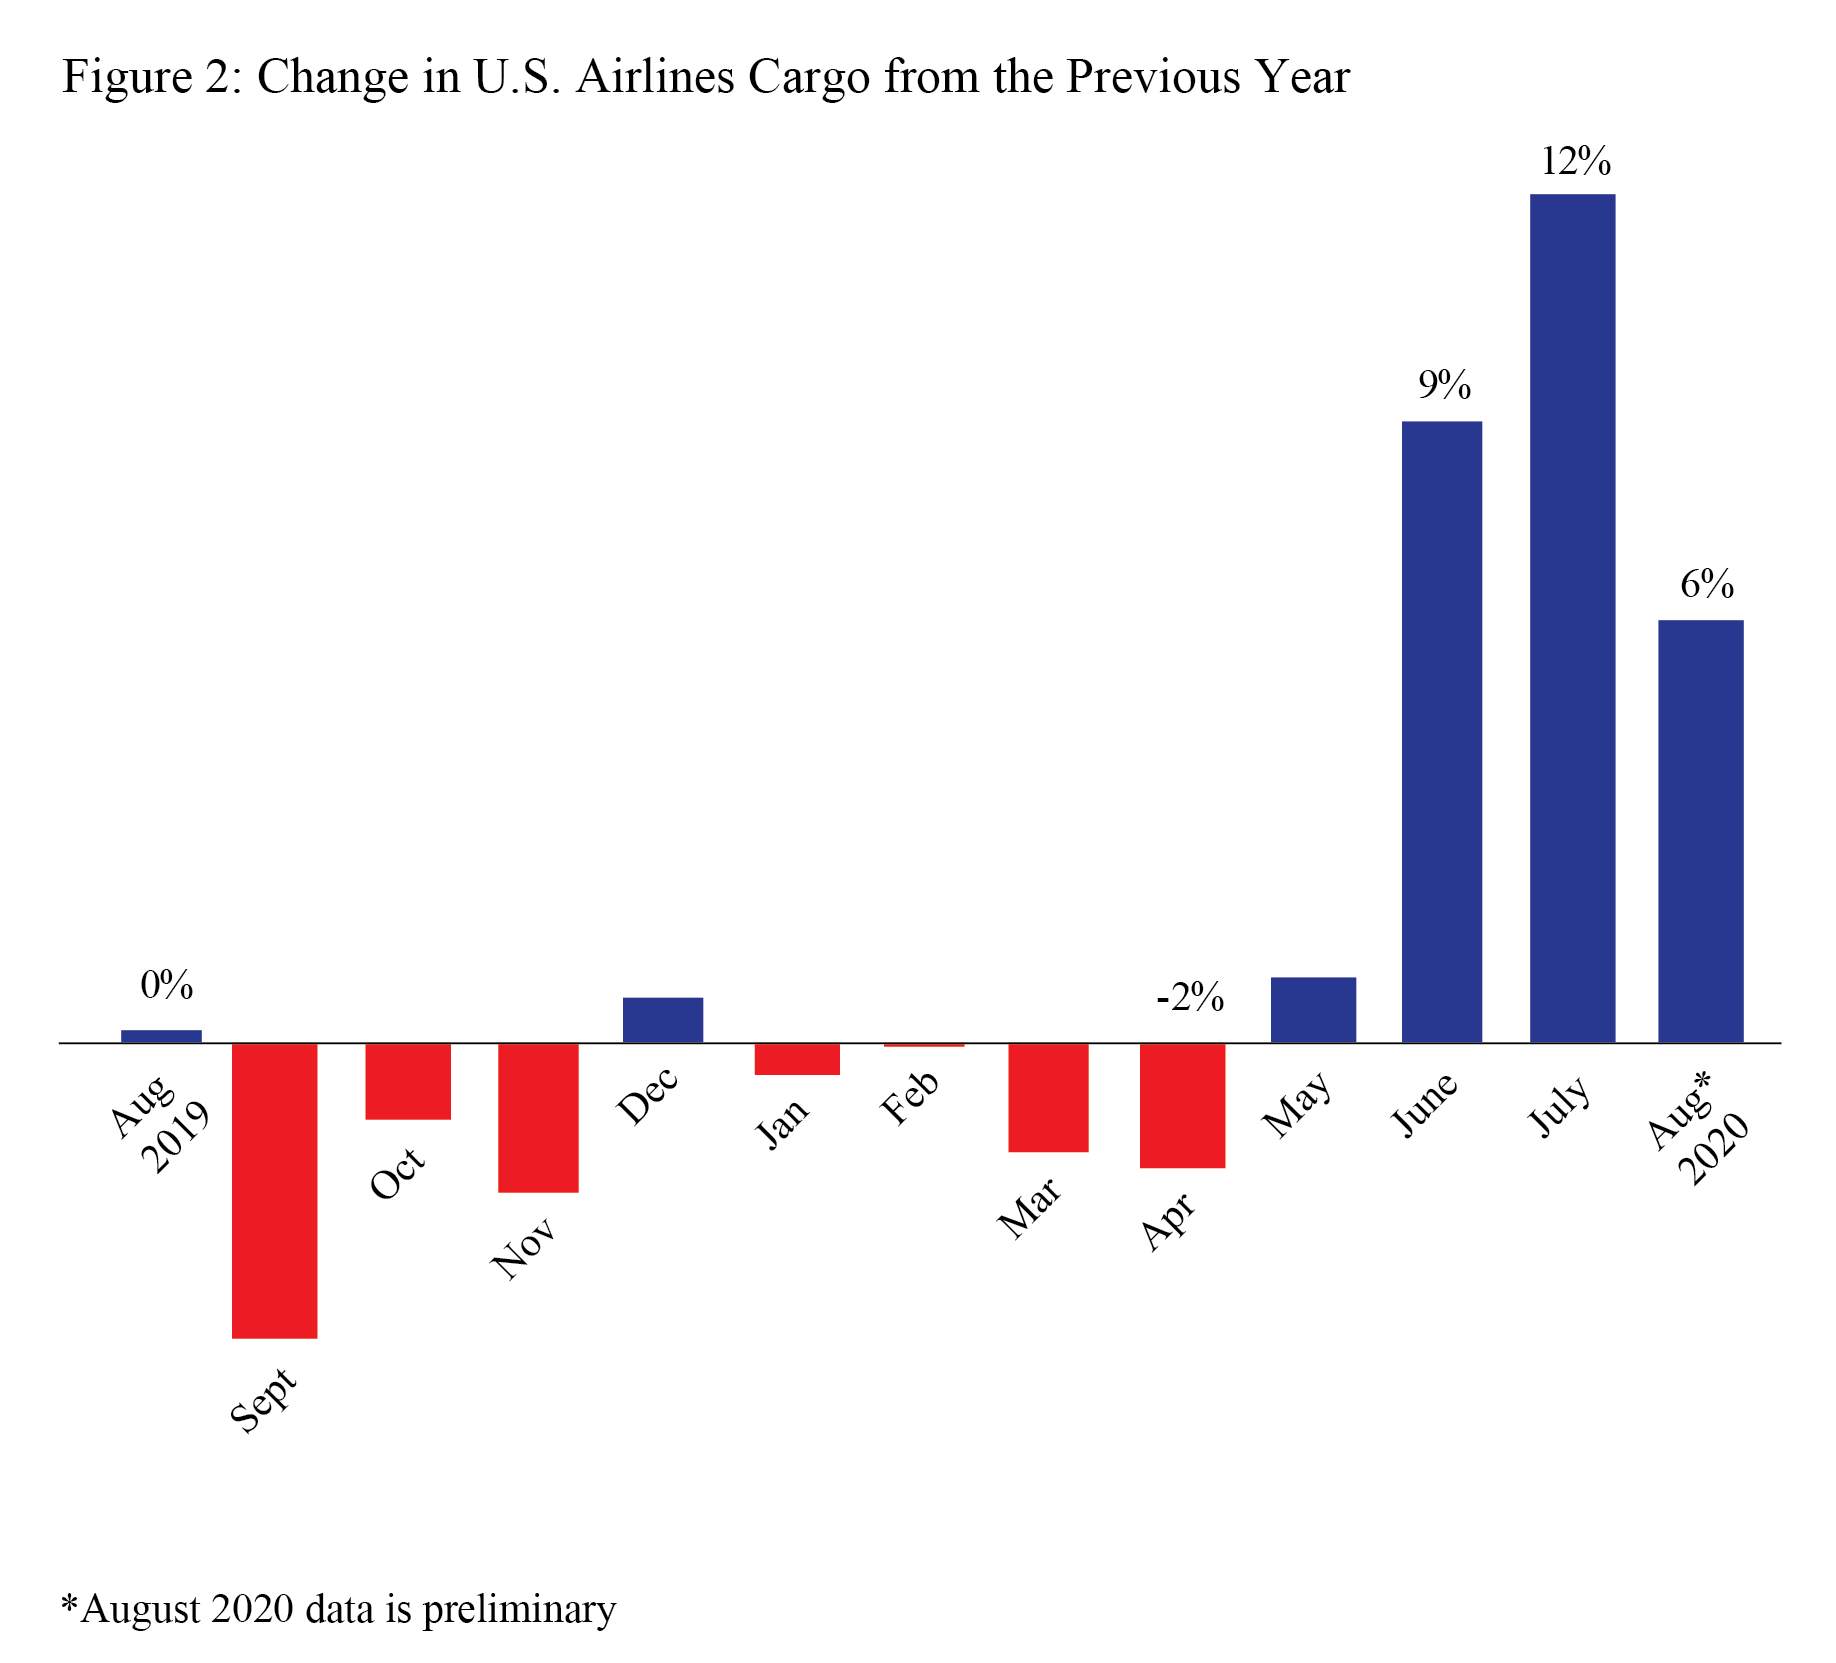
U.S. airlines carried 6% more cargo by weight in August 2020 (preliminary) than in August 2019. The rise was fueled by a gain of 8% in domestic cargo with a 1% rise in international cargo, according to data filed with the Bureau of Transportation Statistics (BTS) by 13 of the leading cargo airlines.
The 13 airlines carry 95% of the total cargo by weight on U.S. airlines. Cargo data consists of freight and mail carried within the U.S. and between the U.S. and foreign points.
August 2020 (preliminary) air cargo numbers for 13 U.S. carriers:
- Total: 1,511 thousand tons, up 6.2% from August 2019 (1,423T tons)
- Domestic: 1,146 thousand tons, up 8.0% from August 2019 (1,061T tons)
- International: 366 thousand tons, up 0.9% from August 2019 (362T tons)
U.S. airline traffic reports are filed monthly with BTS. Final August data will be released on Nov. 13. Complete international data by origin and destination, which is under a six-month confidentiality restriction, will be released on Feb. 11.
|
Year-to-Year Percent Change |
||||
|
|
2016-2017 |
2017-2018 |
2018-2019 |
2019-2020 |
|
January |
6.4 |
10.5 |
5.1 |
-0.5 |
|
February |
6.1 |
9.2 |
-0.3 |
-0.1 |
|
March |
8.0 |
5.8 |
-0.2 |
-1.6 |
|
April |
2.6 |
5.9 |
4.4 |
-1.9 |
|
May |
10.8 |
9.0 |
3.1 |
0.9 |
|
June |
6.8 |
5.5 |
-1.1 |
9.1 |
|
July |
6.9 |
6.7 |
3.5 |
12.5 |
|
August |
9.7 |
5.0 |
0.2 |
6.2* |
|
September |
4.3 |
5.0 |
-4.4 |
|
|
October |
10.6 |
5.5 |
-1.2 |
|
|
November |
10.6 |
-0.6 |
-2.3 |
|
|
December |
5.6 |
0.3 |
0.7 |
|
|
Jan-Aug |
7.2 |
7.1 |
1.8 |
3.1 |
|
Annual |
7.4 |
5.4 |
0.6 |
|
Source: Bureau of Transportation Statistics, T-100 Market
* August 2020 data is preliminary
|
Year-to-Year Percent Change |
||||
|
|
2016-2017 |
2017-2018 |
2018-2019 |
2019-2020 |
|
January |
4.6 |
10.4 |
6.1 |
2.8 |
|
February |
4.9 |
8.7 |
0.7 |
2.2 |
|
March |
7.1 |
4.0 |
-0.4 |
3.1 |
|
April |
1.5 |
4.9 |
7.7 |
3.1 |
|
May |
10.8 |
8.9 |
4.5 |
4.2 |
|
June |
5.4 |
4.5 |
0.5 |
12.7 |
|
July |
5.2 |
6.7 |
6.2 |
15.3 |
|
August |
9.4 |
4.8 |
0.1 |
8.0* |
|
September |
3.3 |
4.3 |
-2.9 |
|
|
October |
11.1 |
5.7 |
1.8 |
|
|
November |
11.3 |
-0.1 |
-1.8 |
|
|
December |
5.1 |
0.1 |
4.5 |
|
|
Jan-Aug |
6.2 |
6.5 |
3.1 |
6.5 |
|
Annual |
6.7 |
5.0 |
2.2 |
|
Source: Bureau of Transportation Statistics, T-100 Domestic Market
* August 2020 data is preliminary
|
Year-to-Year Percent Change |
||||
|
|
2016-2017 |
2017-2018 |
2018-2019 |
2019-2020 |
|
January |
11.4 |
10.6 |
2.2 |
-9.8 |
|
February |
9.6 |
10.4 |
-3.1 |
-6.3 |
|
March |
10.5 |
10.7 |
0.4 |
-13.9 |
|
April |
5.3 |
8.2 |
-3.9 |
-15.7 |
|
May |
11.0 |
9.2 |
-0.6 |
-8.3 |
|
June |
10.8 |
8.2 |
-5.2 |
-0.6 |
|
July |
11.3 |
6.7 |
-3.6 |
4.6 |
|
August |
10.6 |
5.6 |
0.4 |
0.9* |
|
September |
7.2 |
7.0 |
-8.3 |
|
|
October |
9.4 |
5.0 |
-8.7 |
|
|
November |
8.8 |
-1.8 |
-3.5 |
|
|
December |
7.2 |
0.9 |
-10.6 |
|
|
Jan-Aug |
10.0 |
8.6 |
-1.7 |
-6.3 |
|
Annual |
9.4 |
6.5 |
-3.8 |
|
Source: Bureau of Transportation Statistics, T-100 International Market
* August 2020 data is preliminary
Reporting Notes
Data are compiled from monthly reports filed with BTS by commercial U.S. air carriers detailing operations, passenger traffic and freight traffic. This release includes data received by BTS from 13 U.S. airlines as of Oct. 7.
See the BTS Airlines and Airports page for additional U.S. airlines numbers through July for U.S. airlines. International data by origin and destination is available through April.
None of the data are from samples. Measures of statistical significance do not apply to the complete air traffic data.
|
You are subscribed to DOT email updates. Subscriber Services: Manage Preferences |
|
||||||||||||
