BTS 2-Week Outlook
Bureau of Transportation Statistics Upcoming Releases
October 13 - 23
Upcoming from October 13
Tuesday, October 13, 2020
Thursday, October 15, 2020 - 10:00am ET
Transportation Services Index, August 2020
Friday, October 16, 2020 - 11:00am ET
Airline Traffic Data, July 2020 Reported
Tuesday, October 20, 2020 - 11:00am ET
Average Air Fares, 2nd Quarter 2020
Tuesday, October 20, 2020
Wednesday, October 21, 2020 - 11:00am ET
Passenger Airline Employment, August 2020
Friday, October 23, 2020 - 11:00am ET
National Transportation Atlas Database, Fall 2020 Update
TBD
Airline On-Time/Tarmac Data, July 2020
Previously Released
October 7 - Airline Fuel Cost and Consumption, August 2020
October 8 - Airline Full-Time/Part-Time Employment, July 2020
October 9 - U.S. Airlines Passengers, August 2020 (preliminary)
BTS Releases in the Next Two Weeks
-
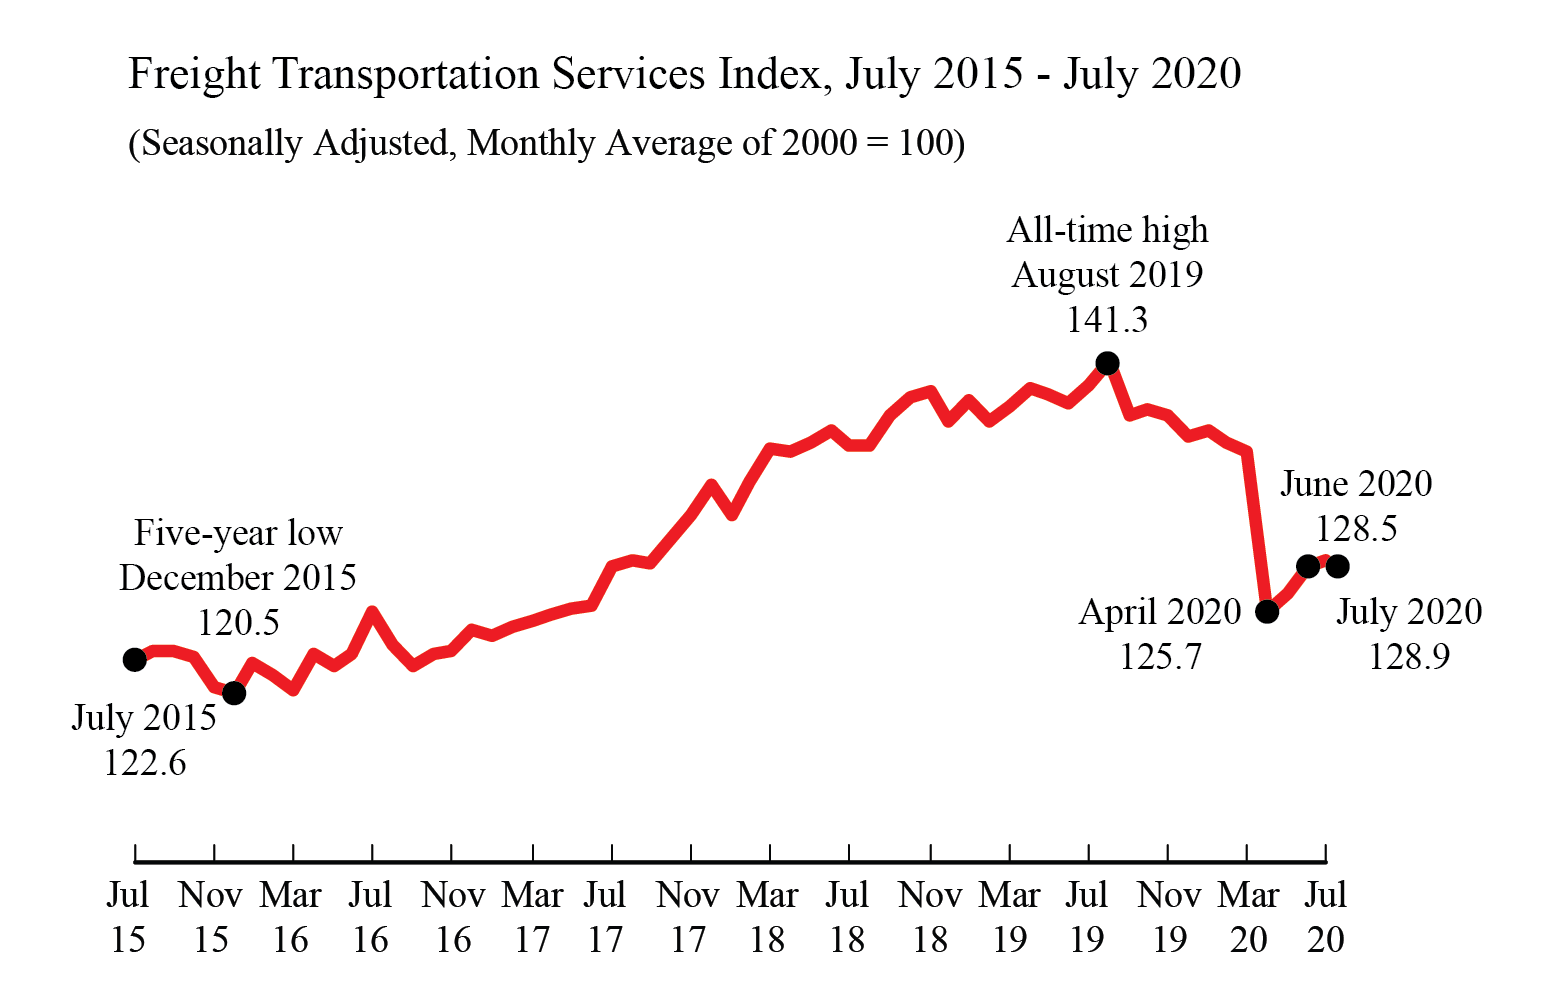
Freight Transportation Services Index (TSI), August 2020
Thursday, October 15, 2020 - 10:00am ET
The Freight TSI measures the month-to-month changes in for-hire freight shipments by mode of transportation. In the previous release for July, the Freight TSI rose 0.3% in July from June, rising for the third consecutive month. From July 2019 to July 2020, the index fell 7.8% compared to a rise of 2.9% from July 2018 to July 2019 and a rise of 5.8% from July 2017 to July 2018.
-
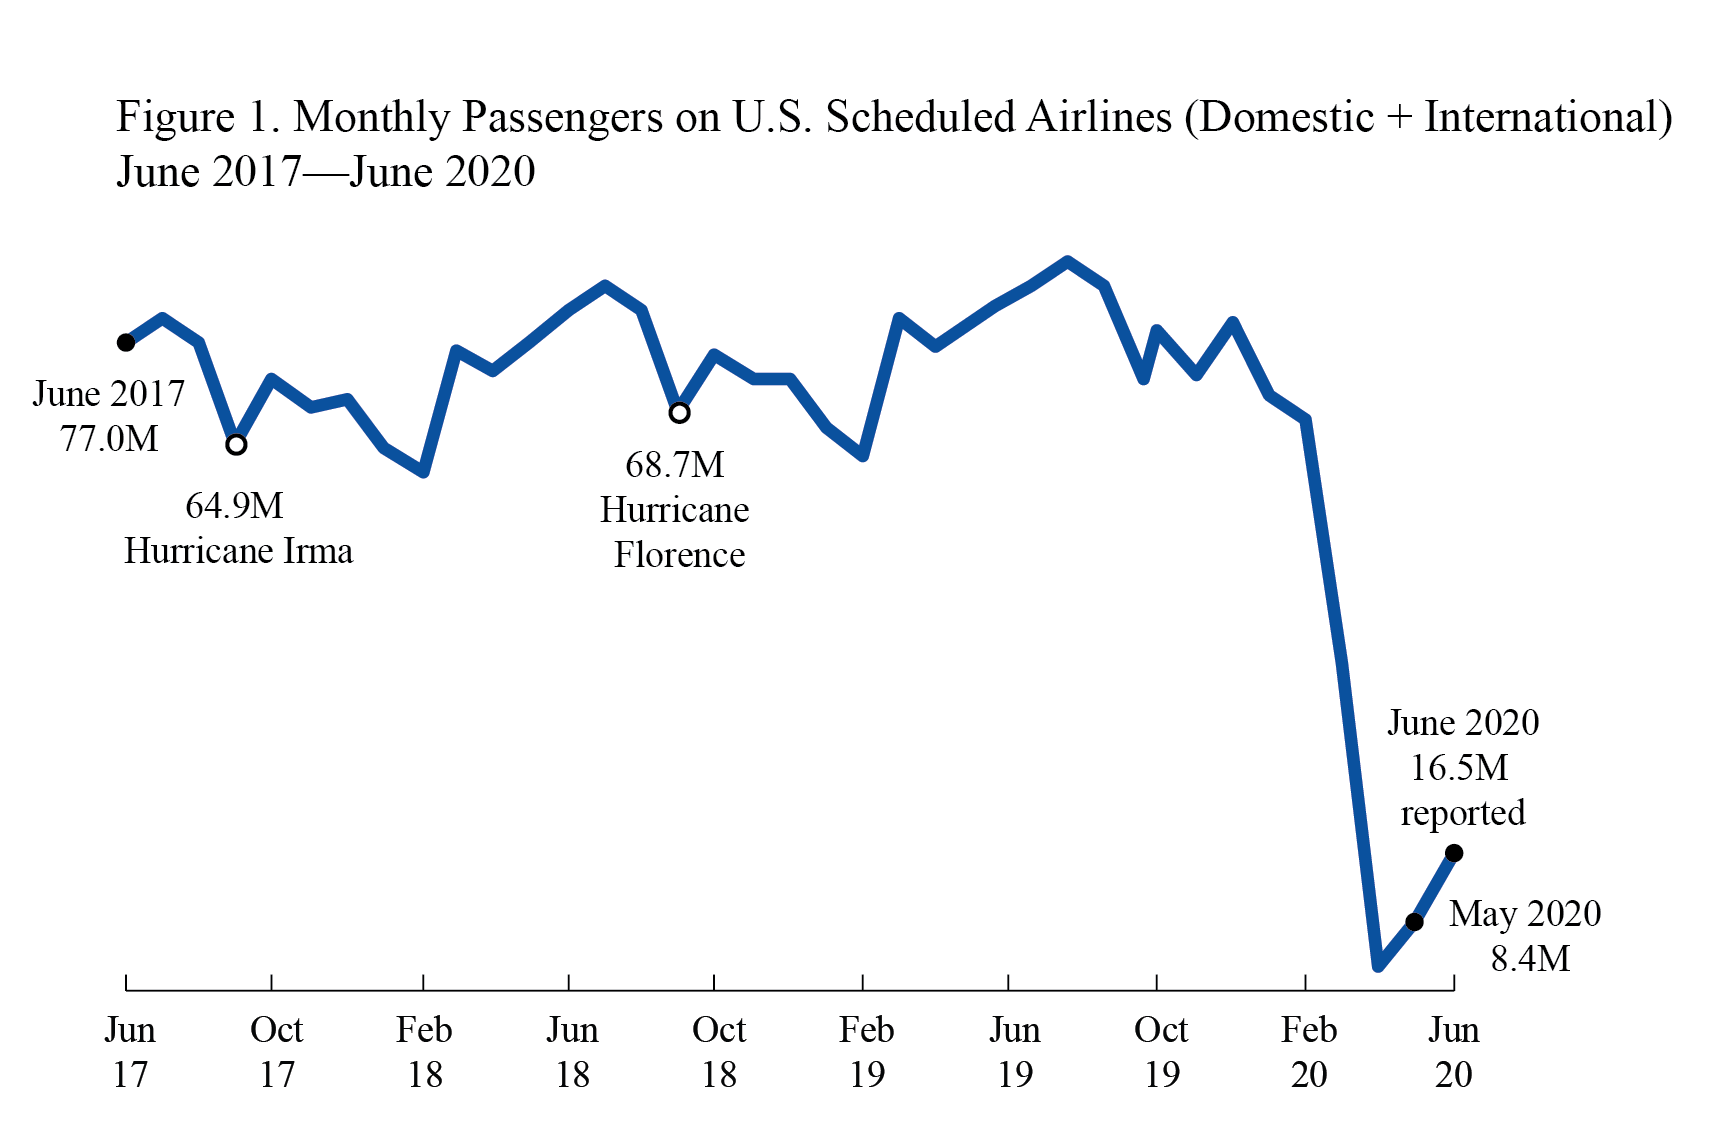
Airline Traffic Data, July 2019 final
Friday, October 16, 2020 - 11:00am ET
BTS release of reported data through July. Data are for U.S. airlines monthly passengers, revenue passenger-miles, available seat-miles, and load factor for systemwide, domestic and international. Numbers are seasonally-adjusted and unadjusted. In the previous release, U.S. airlines carried 16.5 million systemwide (domestic and international) scheduled service passengers in June 2020 (unadjusted). There were 16.1 million domestic passengers and 0.4 million international passengers on U.S. airlines flights in June.
-
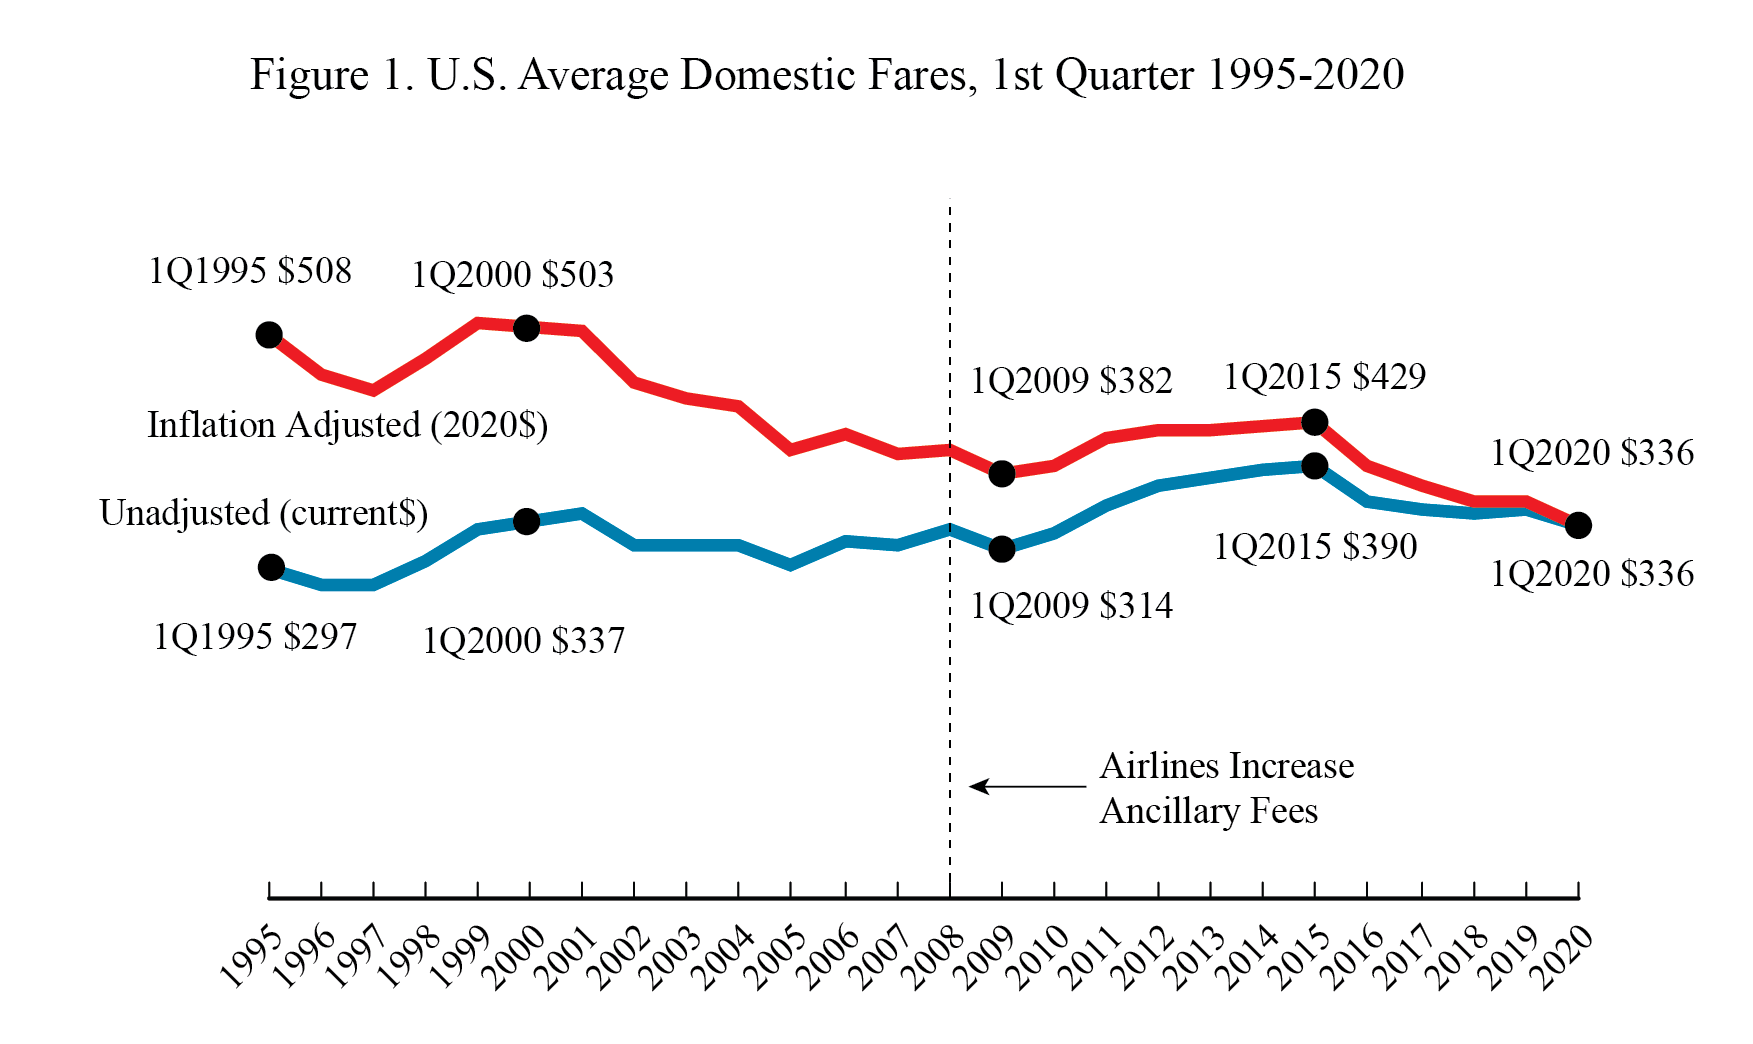
Average Air Fares, 2nd Quarter 2020
Tuesday, October 20, 2020 - 11:00am ET
This release consists of average domestic itinerary fares, both inflation-adjusted and unadjusted, derived from the Origin & Destination Survey, a 10% ticket sample. In the previous release, BTS reported that the average domestic itinerary air fare declined in the first quarter of 2020 to $336, the lowest inflation-adjusted quarterly air fare on record in Bureau of Transportation Statistics (BTS) records dating back to 1995. The previous low was $347 in the third quarter of 2019.
-
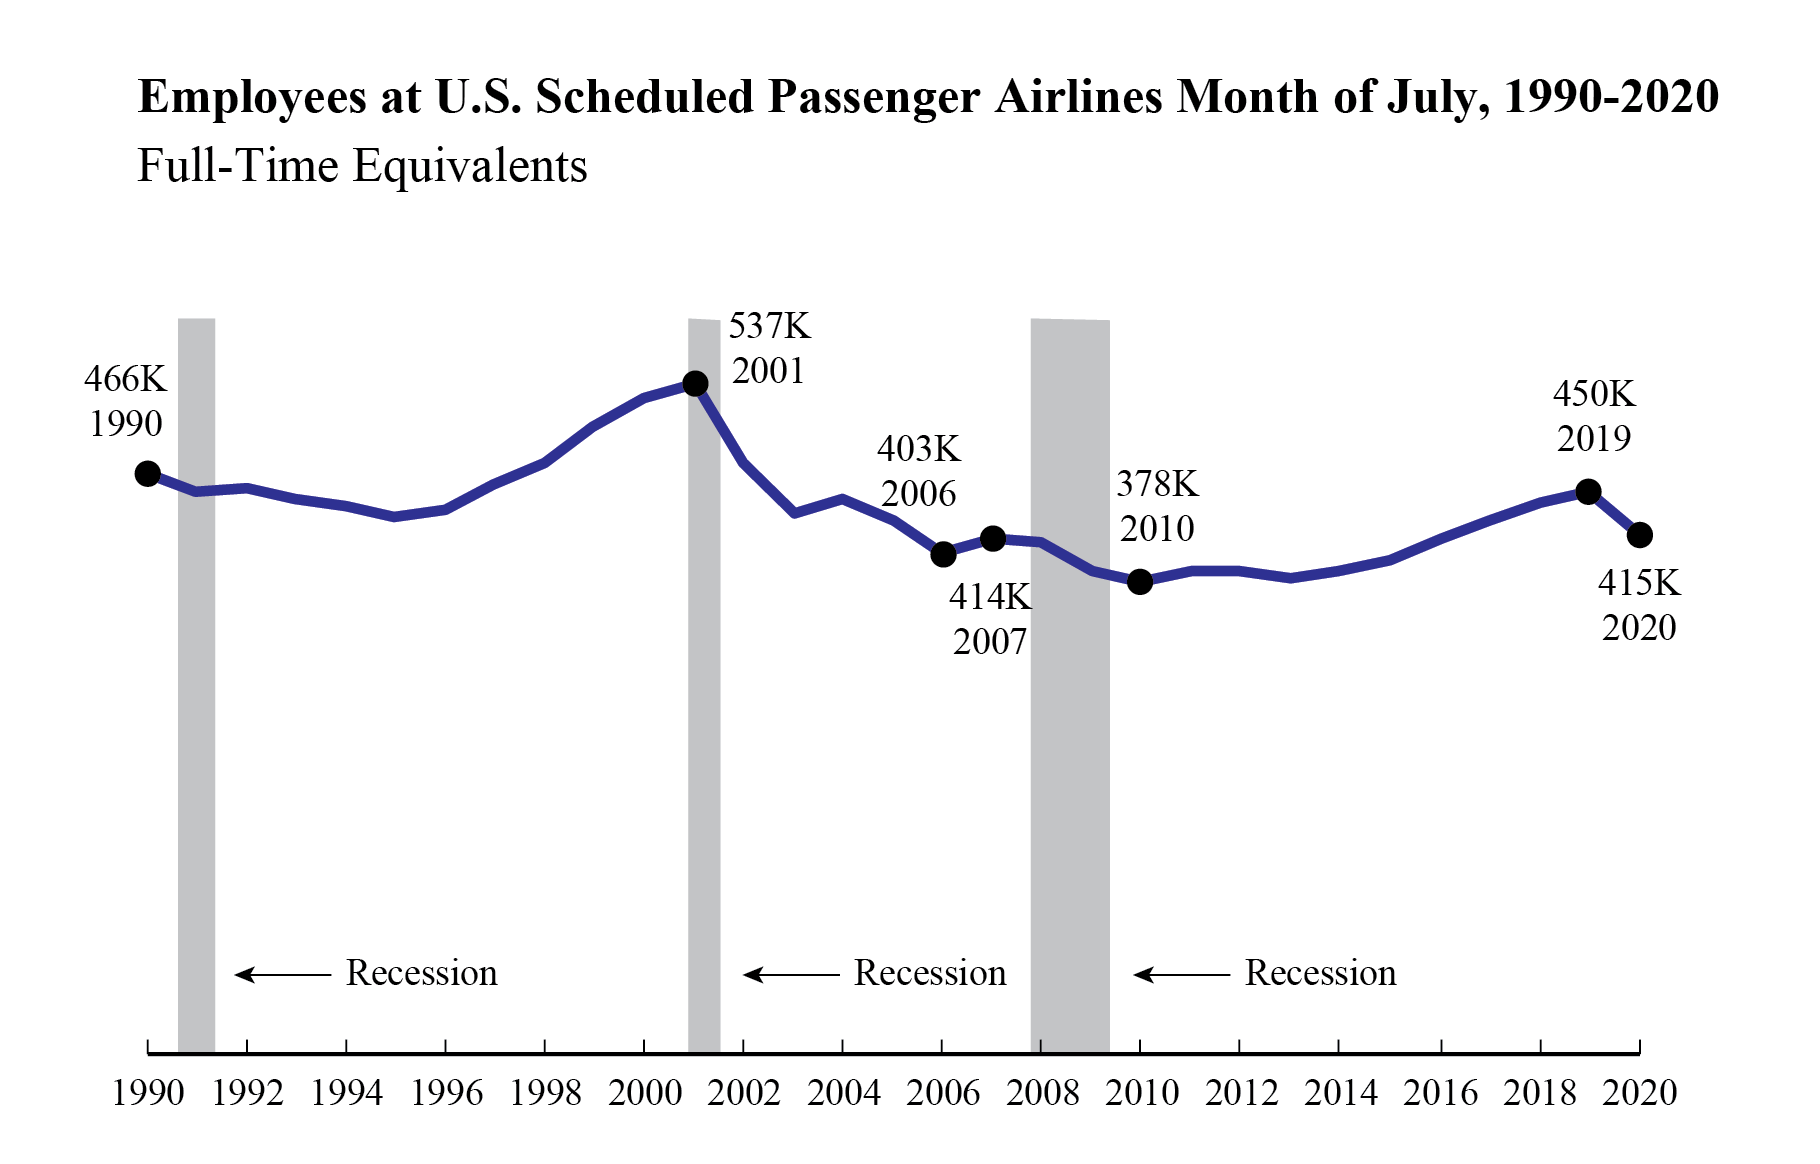
Passenger Airline Employment, August 2020
Wednesday, October 21, 2020 - 11:00 am ET
The release details full-time equivalent (FTE) employment numbers for U.S. scheduled service passenger airlines. Previously, BTS reported that U.S. scheduled passenger airlines employed 1.1% more full-time equivalents (FTEs) in mid-July 2020 than in mid-June 2020. Mid-July’s total number of FTEs (415,154) was up 4,600 FTEs from mid-June 2020 (410,557 FTEs) and down nearly 45,000 FTEs from mid-March 2020. July 2020 was the lowest FTE total for any July since 2016 (413,746 FTEs). Mid-July 2020 FTEs were down more than 34,000 FTEs, down 7.7%, from July 2019 (449,907 FTEs). Regulations require airlines to report employment numbers for a pay period near the 15th of the month.
-
National Transportation Atlas Database, Fall Update
Friday, October 23, 2020 - 11:00am ET
Previously, the
National Transportation Atlas Database (NTAD) summer update was released with eight updated datasets. NTAD is a Bureau of Transportation Statistics (BTS) compilation of geospatial datasets representing the nation’s transportation infrastructure, containing roadways, railways, waterways, and airports. The updates in this release include: rail data (North American Rail Lines and North American Rail Nodes); Highway Performance Monitoring System (HPMS) data from 2018; National Transit Map data; Metropolitan Planning Organization (MPO) Boundaries; Alternative Fueling Stations; Marine Highways; and National Parks.

-
Air Travel Consumer Report: July 2020 Numbers
Date TBD
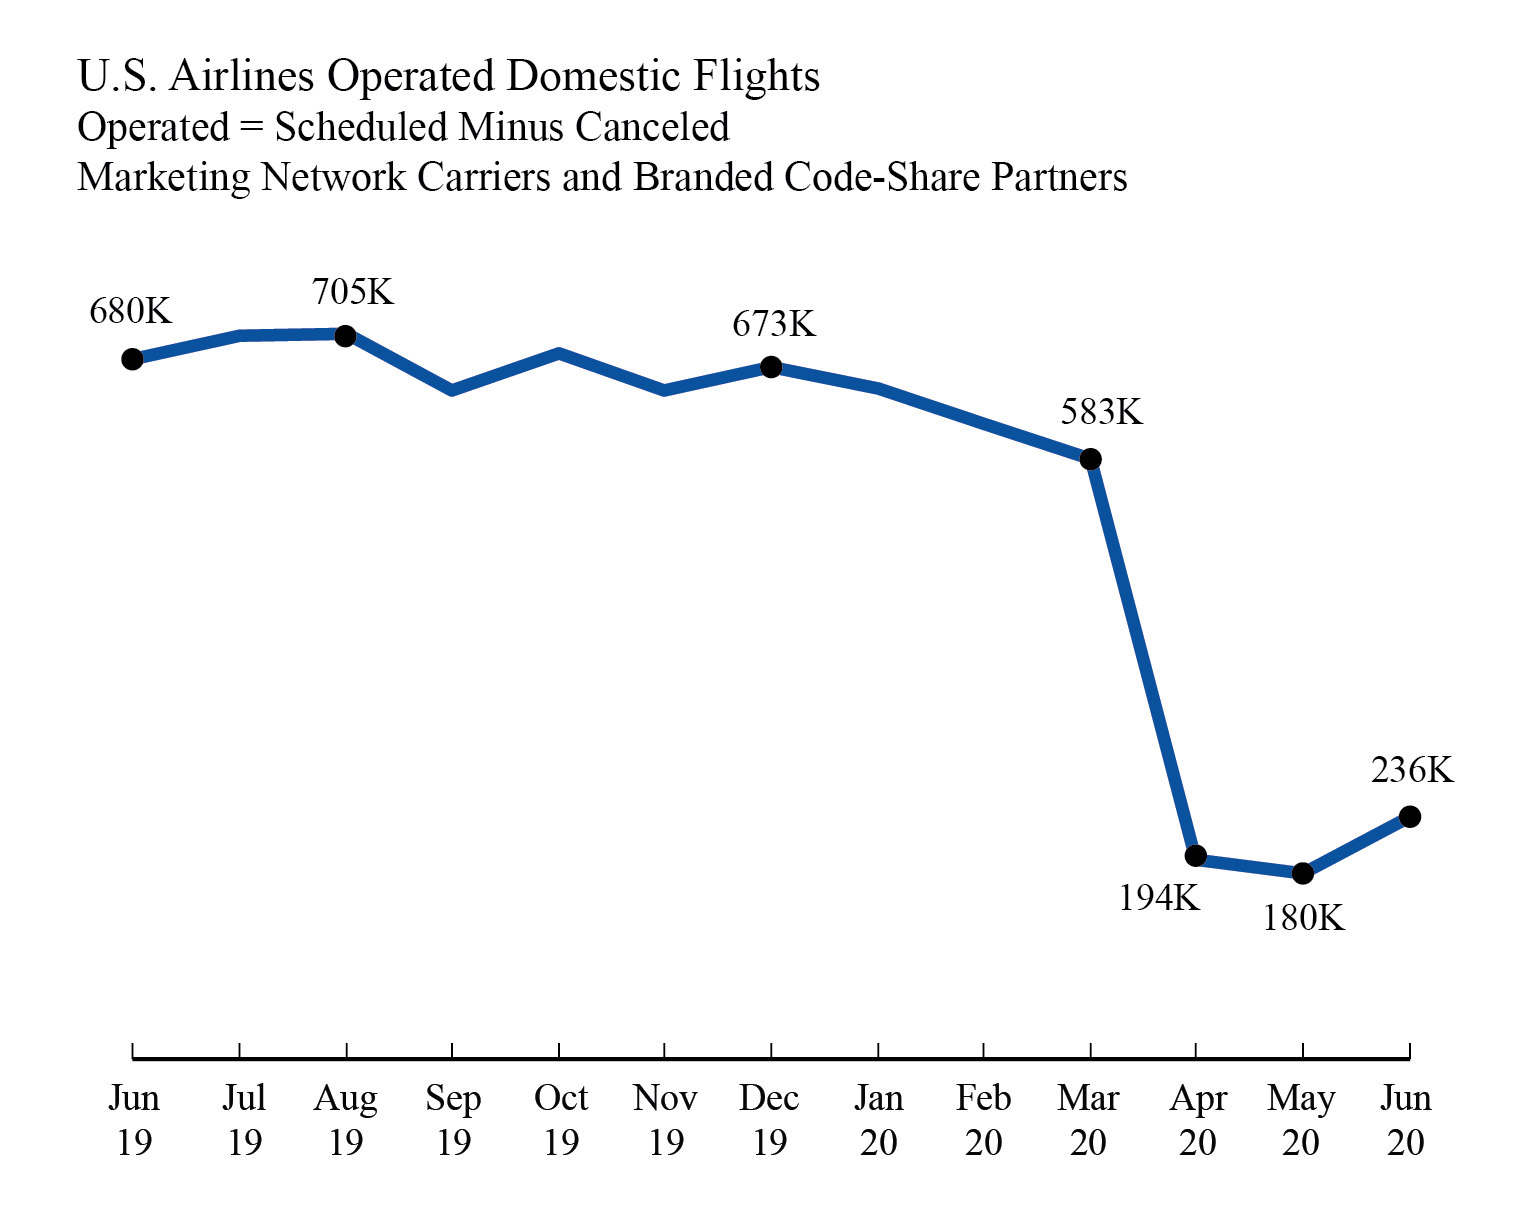
This release consists of U.S. airline domestic monthly on-time performance, cancellations, tarmac data, mishandled baggage released in coordination with the Department of Transportation’s release of the Air Travel Consumer Report. From the previous month’s release, the 10 reporting marketing network carriers reported 237,264 scheduled domestic flights in June 2020 compared to 192,412 flights in May 2020 and 694,469 flights in June 2019. Of those 237,264 scheduled flights, 0.43%, 1,030 flights, were canceled. As a result of schedule reductions and cancellations, the carriers reported operating 236,234 flights in June 2020, compared to the all-time monthly low of 180,151 flights in May 2020 and 194,390 flights in April 2020. The marketing carriers include branded code-share partners of mainline carriers.
-
U.S. Airline Cargo Data (Preliminary), August 2020
Date TBD
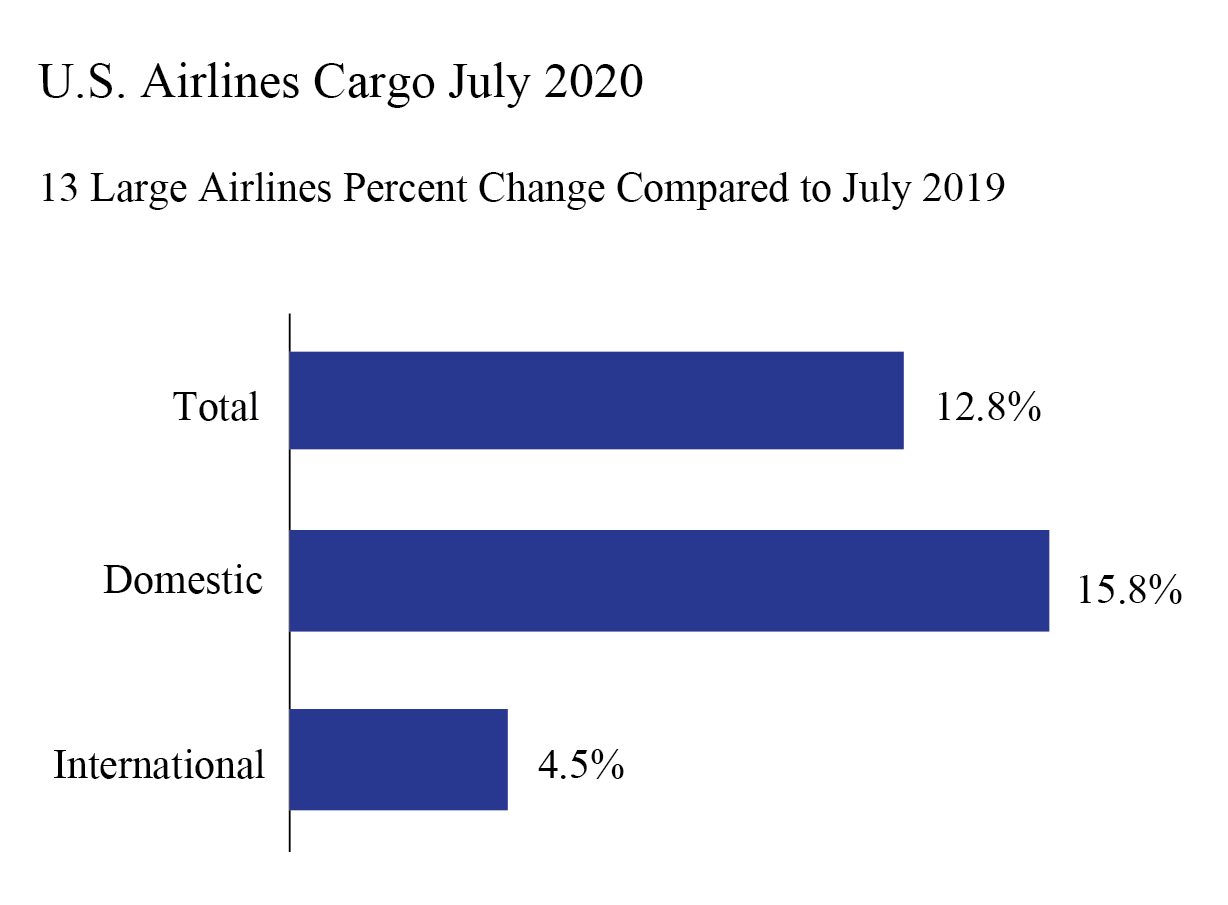
This release provides preliminary monthly cargo data from the airlines that carry the most cargo. These airlines carry 97% of cargo on U.S. airlines. From the previous month’s release, U.S. airlines carried 13% more cargo by weight in July 2020 (preliminary) than in July 2019, the largest annual increase since 2010. The rise was fueled by a gain of almost 16% in domestic cargo while the 4.5% rise in international cargo was the first annual gain since March 2019. Cargo data consists of freight and mail carried within the U.S. and between the U.S. and foreign points.
July 2020 preliminary air cargo numbers for 15 U.S. carriers:
-
Total: 1,643 thousand tons, up 12.8% from July 2019 (1,457T tons)
-
Domestic: 1,235 thousand tons, up 15.8% from July 2019 (1,066T tons)
-
International: 408 thousand tons, up 4.5% from July 2019 (390T tons)
BTS Previously
BTS has released the following:
-
Airline Fuel Cost and Consumption, August 2020
Released Oct. 7
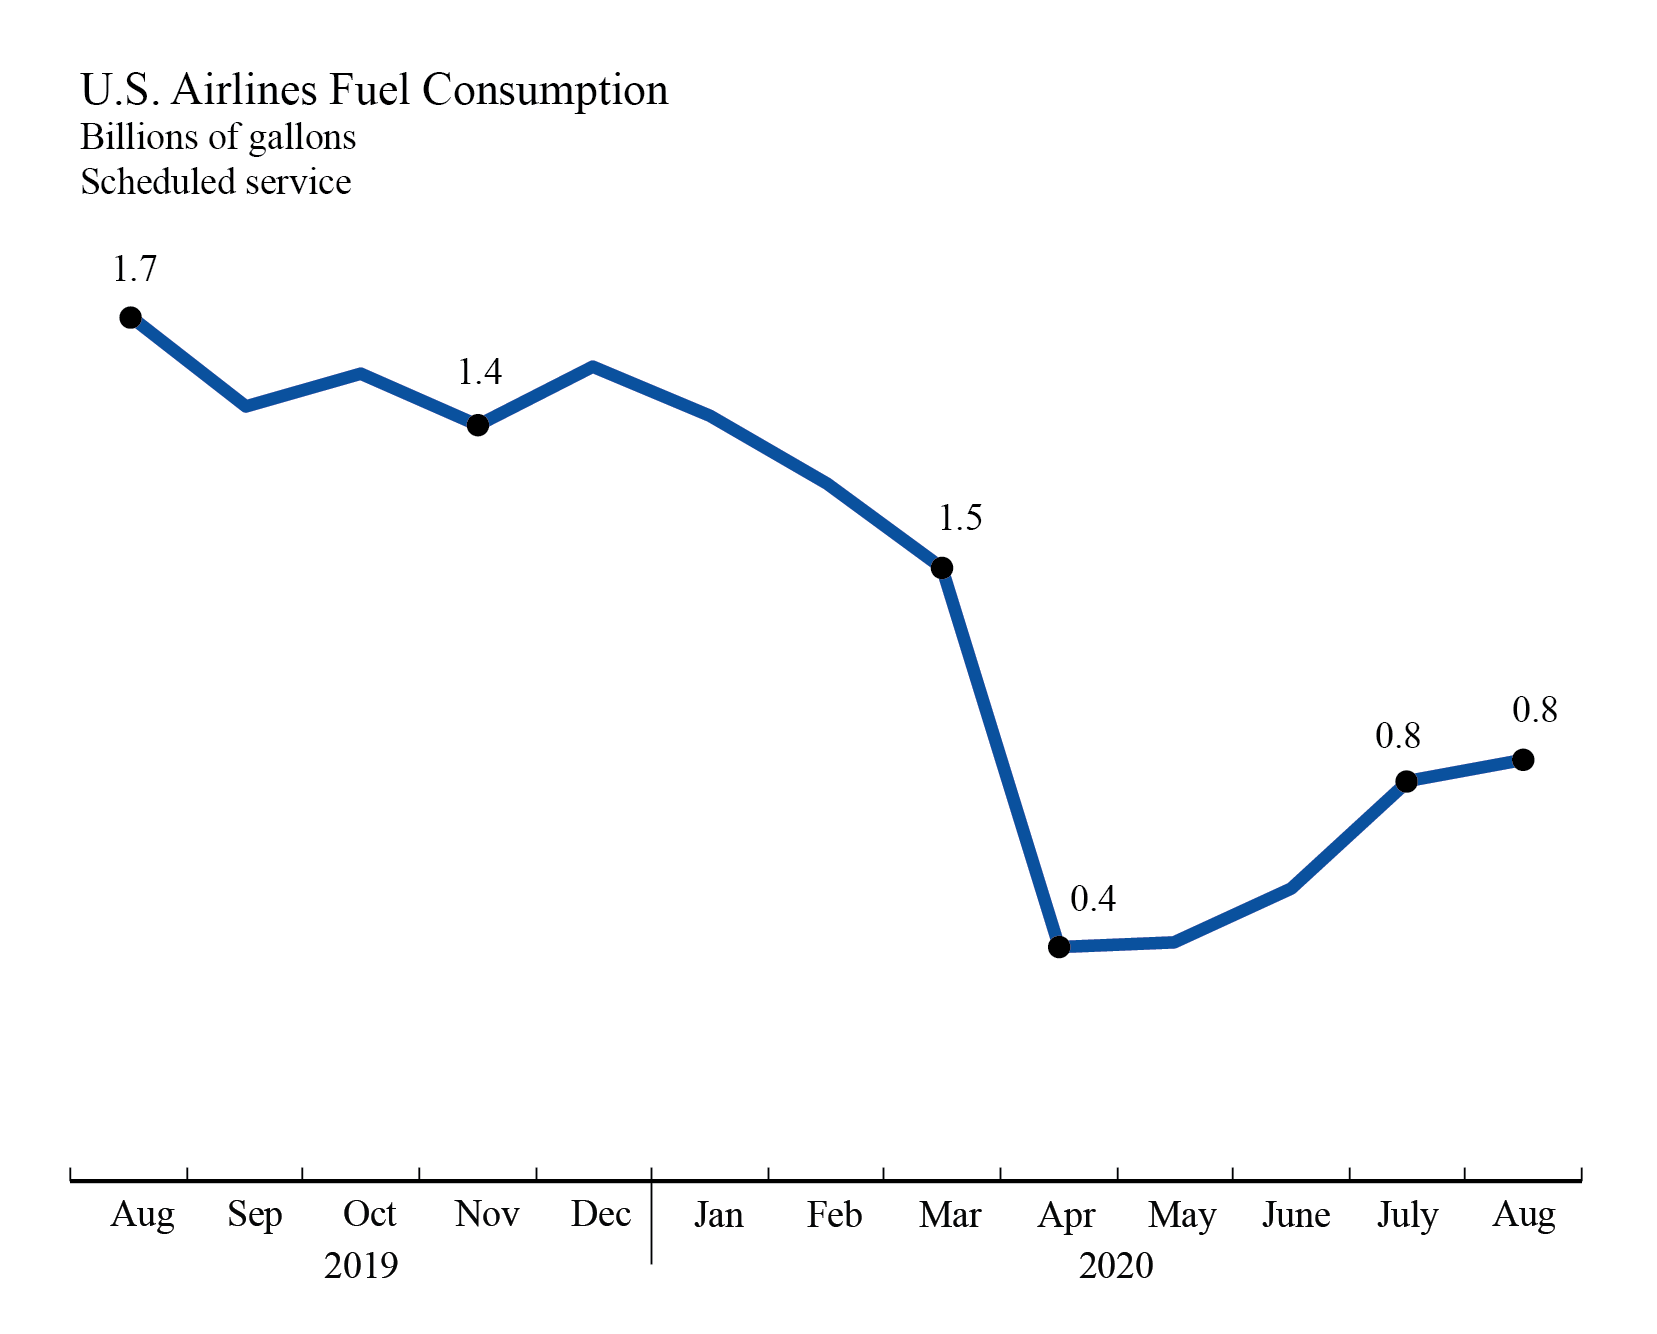
U.S. airlines August 2020 fuel consumption was 5% higher than July 2020, 44% higher than June 2020, 77% higher than May 2020 and 79% higher than April 2020. April was the lowest monthly fuel usage on record (447M gallons), dating back to 2000. August 2020 fuel consumption was down 52% from August 2019.
Fuel consumed by U.S. airlines’ scheduled services:
August 2019 1.7 billion gallons
July 2020 763 million gallons
August 2020 801 million gallons
Individual airline numbers through June are available on the
BTS website.
-
Airline Industry Full-Time/Part-Time Employment, August 2020
Released Oct. 9
U.S. airlines employment:
August 2019 743,214
July 2020 706,824
August 2020 704,486
Regulations require airlines to report employment numbers for a pay period near the 15th of the month. Monthly full-time and part-time employment statistics are reported by U.S. airlines that operate at least one aircraft that has more than 60 seats or the capacity to carry a payload of passengers, cargo and fuel weighing more than 18,000 pounds.
-
U.S. Airline Passengers, August 2020 (Preliminary)
Released Oct. 9
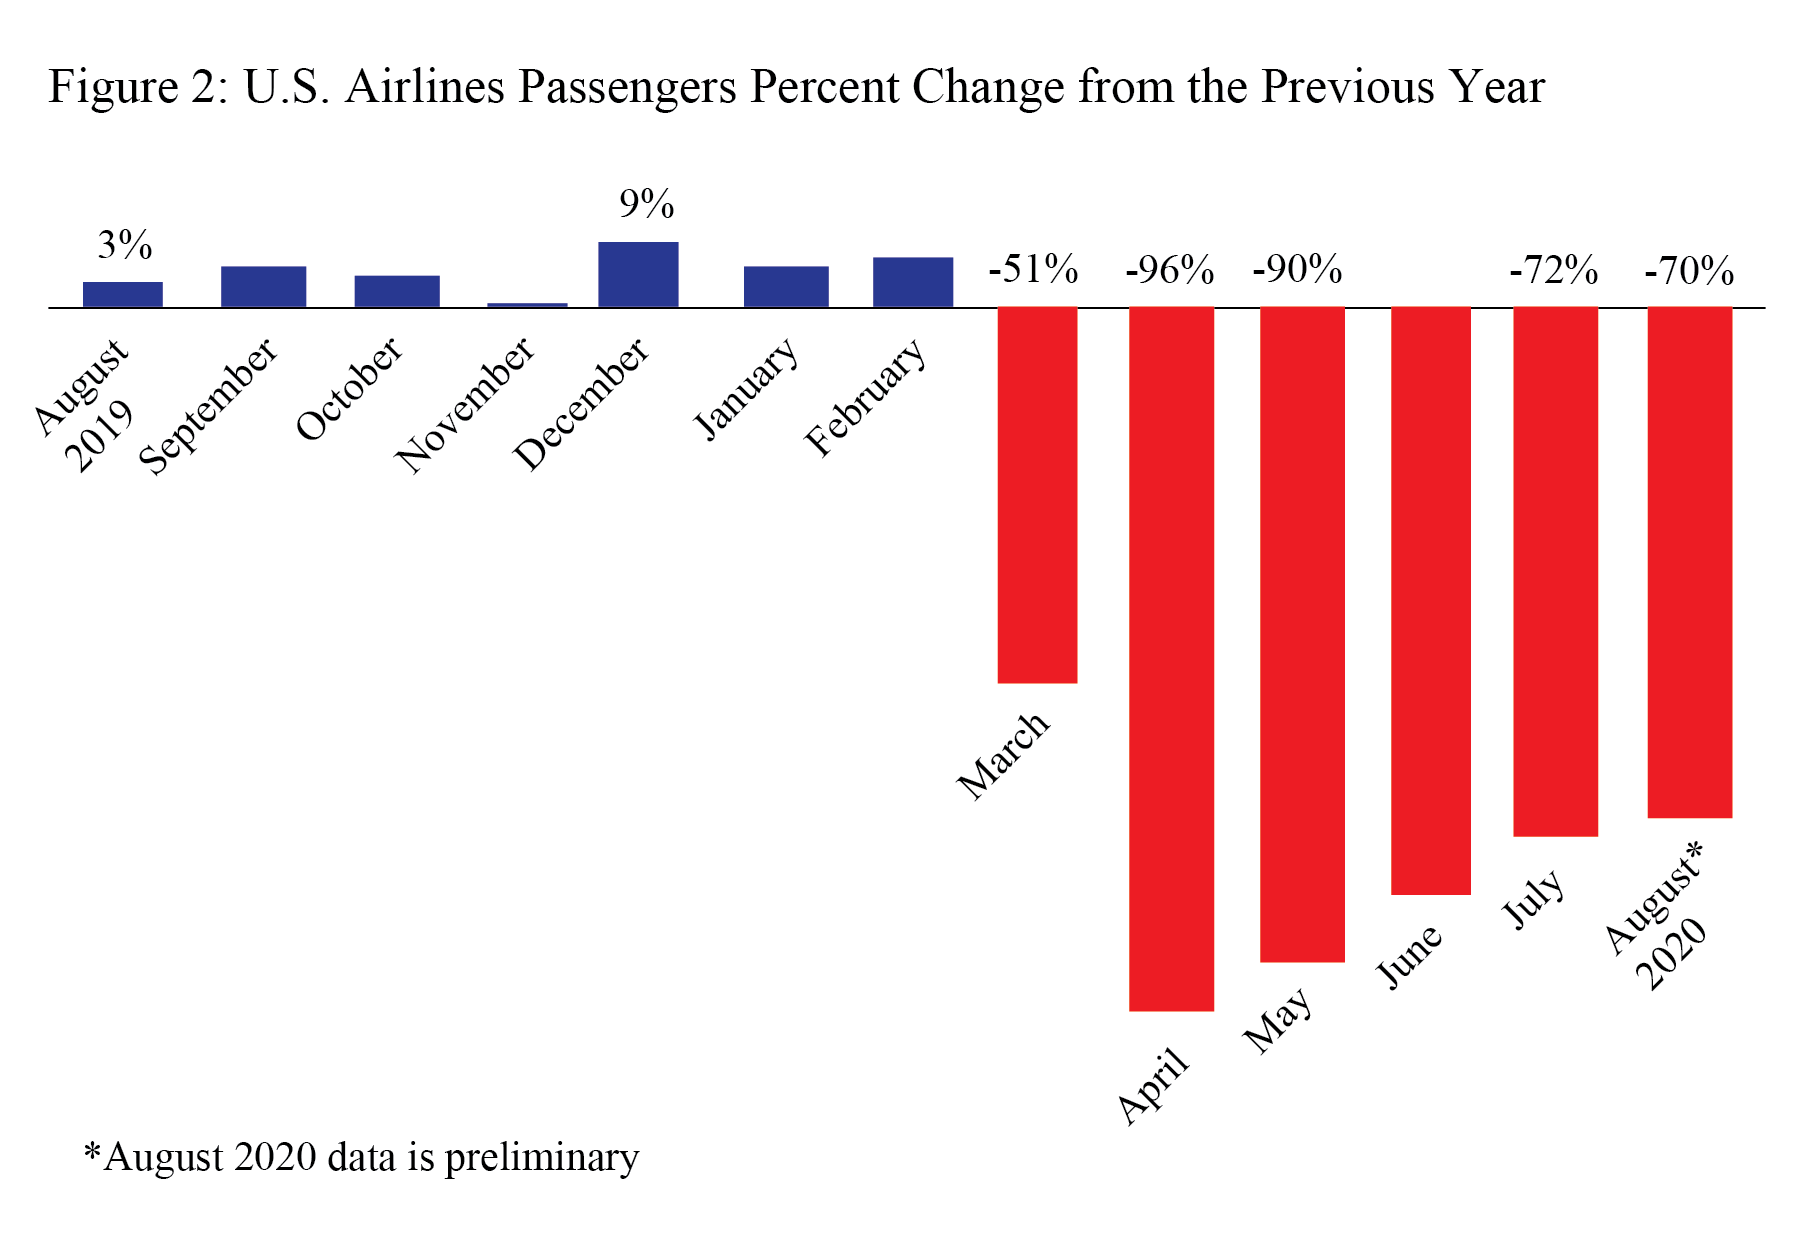
U.S. airlines carried 70% fewer scheduled service passengers in August 2020 than in August 2019, according to data filed with the Bureau of Transportation Statistics (BTS) by 21 airlines that carry more than 90% of the passengers. Despite the large annual drop from pre-pandemic numbers a year earlier (see graphic), when compared to the previous month U.S. airlines carried 2% more passengers in August 2020 than in July 2020.
See BTS Release Schedule
BTS Contact: Dave Smallen
202-366-5568


