
July 2020 North American Transborder Freight Up 11% from June 2020
U.S. Department of Transportation sent this bulletin at 09/23/2020 11:02 AM EDT |
|
Having trouble viewing this email? View it as a Web page.
|
July 2020 North American Transborder Freight Up 11% from June 2020
Transborder freight between the U.S. and other North American countries (Canada and Mexico) in July 2020:
- Total Transborder freight: $91.0 billion of transborder freight moved by all modes of transportation, up 10.9% compared to June 2020 and up 62.2% from May 2020.
- Transborder freight value in July was down 11.2% compared to July 2019.
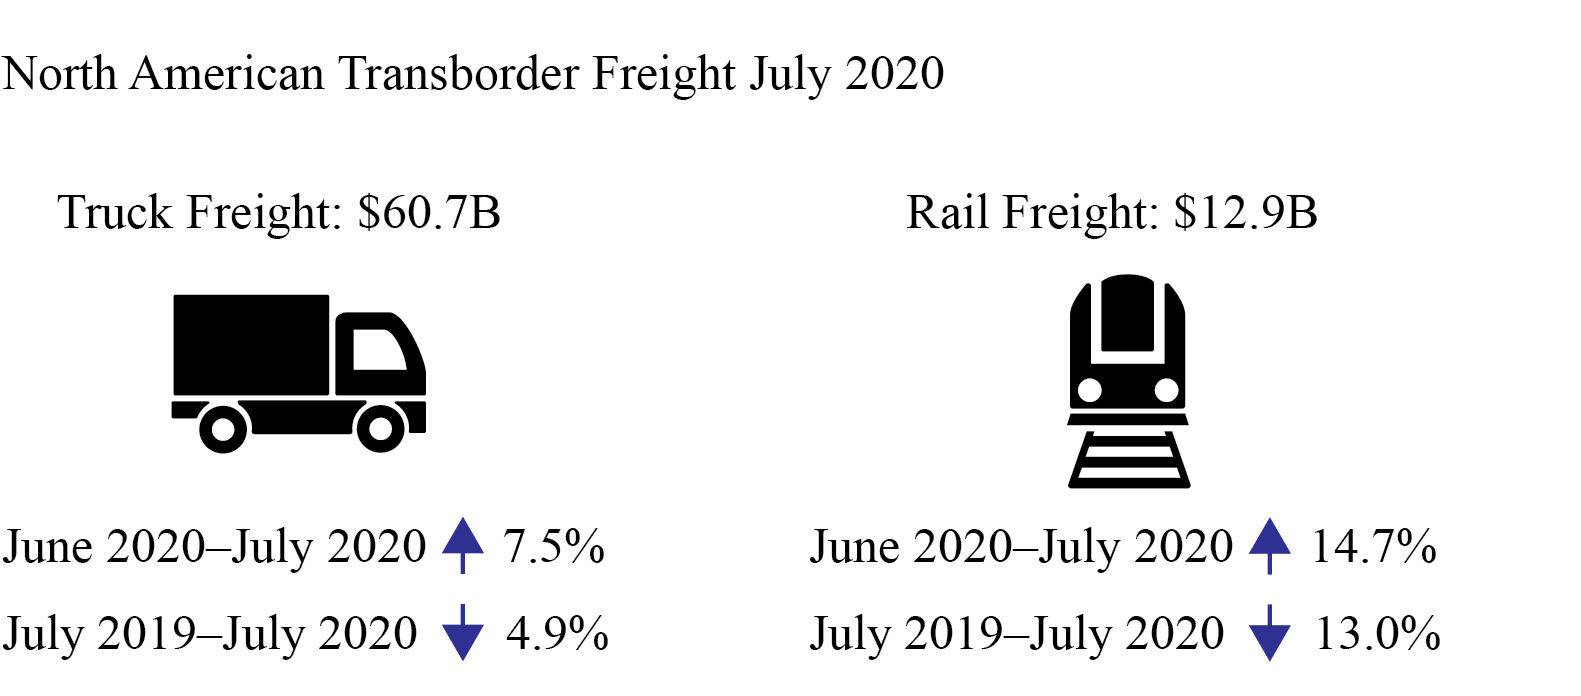
- Most-used mode: Trucks moved $60.7 billion of freight, up 7.5% compared to June 2020, down 4.9% compared to July 2019.
- Second most-used mode: Railways moved $12.9 billion of freight, up 14.7% compared to June 2020, down 13.0% compared to July 2019.
Total Transborder Freight:
- Compared to June 2020:
- Compared to July 2019:
Truck Freight: $60.7 billion (66.8% of all transborder freight)
-
By border:
-
Compared to June 2020:
- Compared to July 2019:
-
Top Three Busiest truck border ports (45.5% of total transborder truck freight)
- Laredo, TX $14.2 billion
- Detroit, MI $8.0 billion
- Ysleta, TX $5.4 billion
-
Top three truck commodities (50.2% of total transborder truck freight)
- Computers and parts $12.0 billion
- Electrical machinery $10.7 billion
- Vehicles and parts $7.8 billion
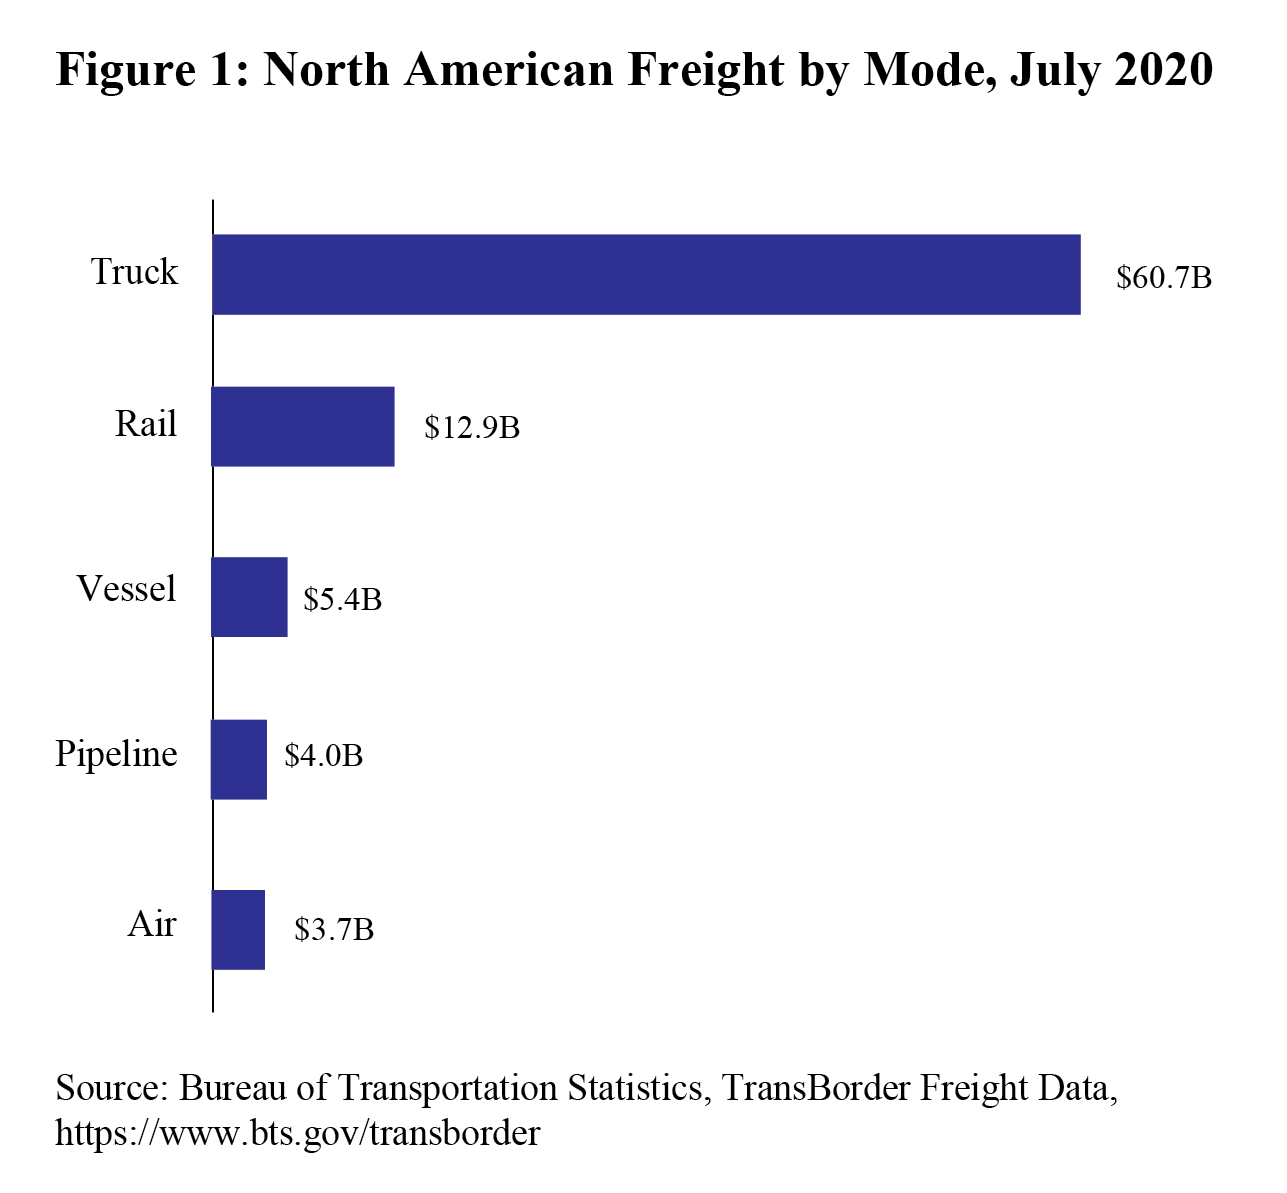
Rail Freight: $12.9 billion (14.2% of all transborder freight)
- By border:
U.S.-Canada: $6.4 billion (14.6% of all northern border freight)
U.S.-Mexico: $6.5 billion (13.7% of all southern border freight)
- Compared to June 2020:
U.S.-Canada up 12.4%
U.S.-Mexico up 16.9%
- Compared to July 2019:
U.S.-Canada down 17.6%
U.S.-Mexico down 8.0%
-
Three busiest rail border ports (55.9% of total transborder rail freight)
- Laredo, TX $3.3 billion
- Detroit, MI $2.0 billion
- Eagle Pass, TX $2.0 billion
-
Top three rail commodities (61.4% of total transborder rail freight)
- Motor vehicles and parts $6.6 billion
- Computers and parts $0.6 billion
- Plastics $0.6 billion
Total Transborder Freight by Mode:
Reporting Notes
Data in this Bureau of Transportation Statistics release are not seasonally adjusted and are not adjusted for inflation. For previous statistical releases and summary tables, see TransBorder Releases. See TransBorder Freight Data for data from previous months, and for additional state, port, and commodity data. BTS has scheduled the release of August TransBorder numbers for Oct. 27.
|
You are subscribed to DOT email updates. Subscriber Services: Manage Preferences |
|
||||||||||||
