
U.S. Airline July 2020 Passengers Decrease 73% from July 2019 but Rise 30% from June 2020 (Preliminary)
U.S. Department of Transportation sent this bulletin at 09/08/2020 11:05 AM EDT |
|
Having trouble viewing this email? View it as a Web page.
|
U.S. Airline July 2020 Passengers Decrease 73% from July 2019 but Rise 30% from June 2020 (Preliminary)
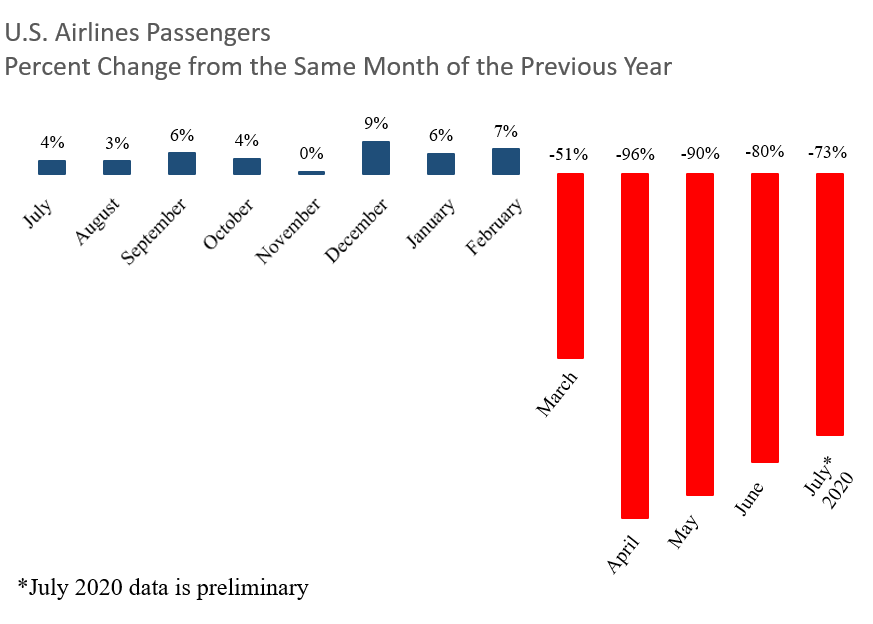
U.S. airlines carried 73% fewer scheduled service passengers in July 2020 than in July 2019, according to preliminary data filed with the Bureau of Transportation Statistics (BTS) by 18 airlines that carry more than 90% of the passengers. Despite the large annual drop from pre-pandemic numbers a year earlier (see graphic), when compared to the previous month U.S. airlines carried 30% more passengers in July 2020 than in June 2020.
The 73% decline from July 2019 was the smallest annual decrease since March.
The large airlines carried 21.4 million passengers in July 2020 (preliminary), up from 16.5 million passengers on all U.S. airlines in June 2020 and up from 3.0 million in April 2020, which was the lowest monthly total in BTS records dating back to 1974. The previous low was 14.6 million passengers in February 1975.
Preliminary July 2020 passenger numbers (18 carriers reporting):
- Total: 4 million passengers, down 73% from July 2019 (79.2M) but up 30% from June 2020 (16.5M)
- Domestic: 20.3 million passengers, down 70% from July 2019 (67.9M)
- International: 1.1 million passengers, down 90% from July 2019 (11.3M)
U.S. airline traffic reports are filed monthly with BTS. Final July data will be released on Oct. 16. Complete international data by origin and destination, which is under a six-month confidentiality restriction, will be released on Jan. 14.
Systemwide Passengers
July 2020 had the smallest annual decrease in the number of U.S. airlines passengers since March. It was the third consecutive month with a smaller annual decrease than the previous month.
Table 1: Systemwide Percent Change in US Airlines Scheduled Service Passengers from the Same Month of the Previous Year, 2016-2020
|
Year-to-Year Percent Change |
||||
|
|
2016-2017 |
2017-2018 |
2018-2019 |
2019-2020 |
|
January |
3.0 |
2.9 |
4.0 |
5.6 |
|
February |
-0.2 |
5.7 |
3.0 |
6.7 |
|
March |
3.4 |
4.6 |
5.1 |
-51.3 |
|
April |
4.5 |
4.8 |
3.8 |
-96.1 |
|
May |
3.0 |
4.9 |
5.2 |
-89.6 |
|
June |
3.4 |
5.0 |
3.7 |
-80.3 |
|
July |
3.8 |
5.2 |
3.6 |
-73.0* |
|
August |
5.0 |
5.0 |
3.4 |
|
|
September |
-2.3 |
5.8 |
5.7 |
|
|
October |
4.6 |
3.9 |
4.1 |
|
|
November |
4.6 |
4.5 |
0.5 |
|
|
December |
3.5 |
3.6 |
8.8 |
|
|
Annual |
3.1 |
4.7 |
4.2 |
|
Source: Bureau of Transportation Statistics, T-100 Market
* July 2020 data is preliminary
Domestic Passengers
July 2020 had the smallest annual decrease in the number of U.S. airlines domestic passengers since March. July was the third consecutive month with a smaller annual decrease than the previous month. Domestic passengers were 94.8% of total passengers in July 2020.
Table 2: Domestic Percent Change in US Airlines Scheduled Service Passengers from the Same Month of the Previous Year, 2016-2020
|
Year-to-Year Percent Change |
||||
|
|
2016-2017 |
2017-2018 |
2018-2019 |
2019-2020 |
|
January |
3.1 |
3.2 |
3.9 |
6.2 |
|
February |
-0.1 |
5.9 |
3.0 |
7.4 |
|
March |
3.8 |
4.2 |
5.4 |
-51.0 |
|
April |
3.7 |
5.7 |
3.7 |
-95.7 |
|
May |
2.7 |
5.3 |
5.2 |
-88.5 |
|
June |
3.1 |
5.3 |
3.6 |
-77.9 |
|
July |
3.7 |
5.8 |
3.8 |
-70.1* |
|
August |
5.0 |
5.5 |
3.4 |
|
|
September |
-2.5 |
5.8 |
5.8 |
|
|
October |
4.7 |
3.8 |
4.2 |
|
|
November |
4.5 |
4.4 |
0.2 |
|
|
December |
3.7 |
3.7 |
9.5 |
|
|
Annual |
3.0 |
4.9 |
4.3 |
|
Source: Bureau of Transportation Statistics, T-100 Domestic Market
* July 2020 data is preliminary
International Passengers
Despite an annual decline of 90%, July 2020 was the first month since March that U.S. airlines carried more than 1 million passengers. July 2020 had the smallest annual decrease in the number of U.S. airlines international passengers since March. International passengers comprised 5.2% of total July 2020 passengers compared to 14.3% in July 2019.
Table 3: International Percent Change in US Airlines Scheduled Service Passengers from the Same Month of the Previous Year, 2016-2020
|
Year-to-Year Percent Change |
||||
|
|
2016-2017 |
2017-2018 |
2018-2019 |
2019-2020 |
|
January |
2.1 |
1.0 |
4.5 |
1.9 |
|
February |
-1.2 |
4.6 |
3.4 |
0.7 |
|
March |
0.4 |
7.2 |
3.1 |
-53.3 |
|
April |
9.8 |
-1.0 |
4.3 |
-98.6 |
|
May |
5.4 |
2.3 |
5.3 |
-98.1 |
|
June |
5.3 |
3.4 |
4.2 |
-96.4 |
|
July |
4.6 |
1.6 |
2.2 |
-90.2* |
|
August |
4.9 |
2.0 |
3.9 |
|
|
September |
-1.1 |
5.9 |
4.6 |
|
|
October |
3.2 |
4.3 |
3.2 |
|
|
November |
5.4 |
4.7 |
2.2 |
|
|
December |
1.7 |
3.2 |
3.6 |
|
|
Annual |
3.5 |
3.1 |
3.8 |
|
Source: Bureau of Transportation Statistics, T-100 International Market
* July 2020 data is preliminary
Reporting Notes
Data are compiled from monthly reports filed with BTS by commercial U.S. air carriers detailing operations, passenger traffic and freight traffic. This release includes data received by BTS from U.S. airlines as of Aug. 31.
See the BTS Airlines and Airports page for additional U.S. airlines numbers through May for U.S. airlines. International data by origin and destination is available through February.
None of the data are from samples. Measures of statistical significance do not apply to the complete air traffic data.
|
You are subscribed to DOT email updates. Subscriber Services: Manage Preferences |
|
||||||||||||
