BTS 2-Week Outlook
Bureau of Transportation Statistics Upcoming Releases
Aug 31-Sept 11
Upcoming from Aug. 31
Wednesday, September 2, 2020 - 11:00am ET
Airline Fuel Cost and Consumption, July 2020
Thursday, September 3, 2020 - 11:00am ET
Airline Full-Time/Part-Time Employment, July 2020
Thursday, September 10, 2020 - 10:00am ET
Transportation Services Index, July 2020
Friday, September 11, 2020 - 11:00am ET
Airline Traffic Data, June 2020 (Final)
TBD
U.S. Airline Passenger Numbers, July 2020 (Preliminary)
Previously Released
August 18 – International Air Cargo, June 2020 (Preliminary)
August 19 - Passenger Airline Employment, June 2020
August 21 - Airline On-Time/Cancellation Data, May 2020
August 25 - North American Freight Data, June 2020
The Bureau of Transportation Statistics will release the following data sets in the next two weeks:
-
Airline Fuel Cost and Consumption, July 2020
Wednesday, September 2, 2020 - 11:00am ET
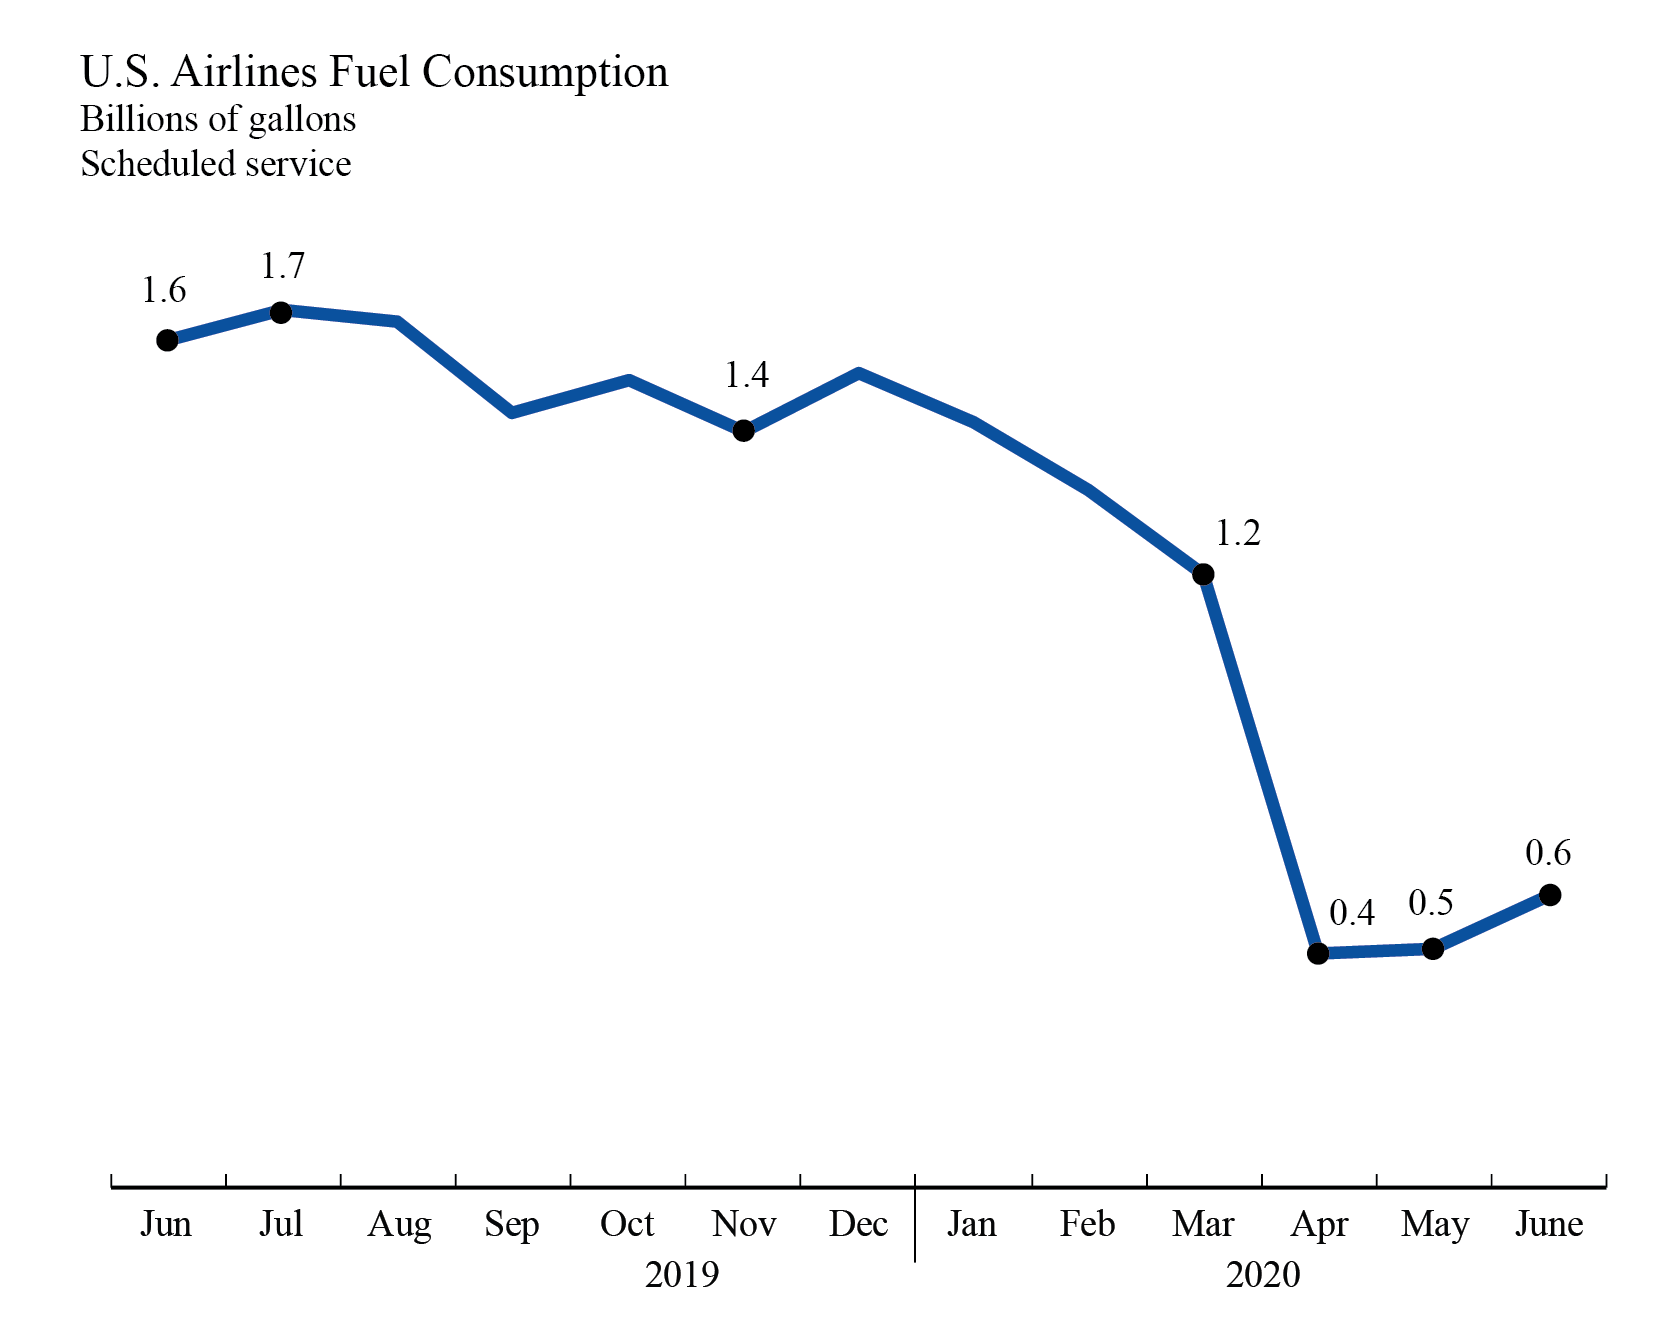
Previous release: U.S. airlines June 2020 fuel consumption was 23% higher than May 2020 and 25% higher than April 2020, which was the lowest monthly fuel usage on record dating back to 2000.
Fuel consumed by U.S. airlines’ scheduled services:
June 2019 1.6 billion gallons
May 2020 453 million gallons
June 2020 558 million gallons
Industry summary of airline fuel consumption, total fuel cost and price paid per gallon are available on the database. Individual
airline numbers through March are available on the BTS website. Individual airline numbers for April, May and June will be available on Sept. 14. Individual airline numbers for July will be available on Dec. 7.
-
Airline Full-Time/Part-Time Employment, July 2020
Thursday, September 3, 2020 - 11:00am ET
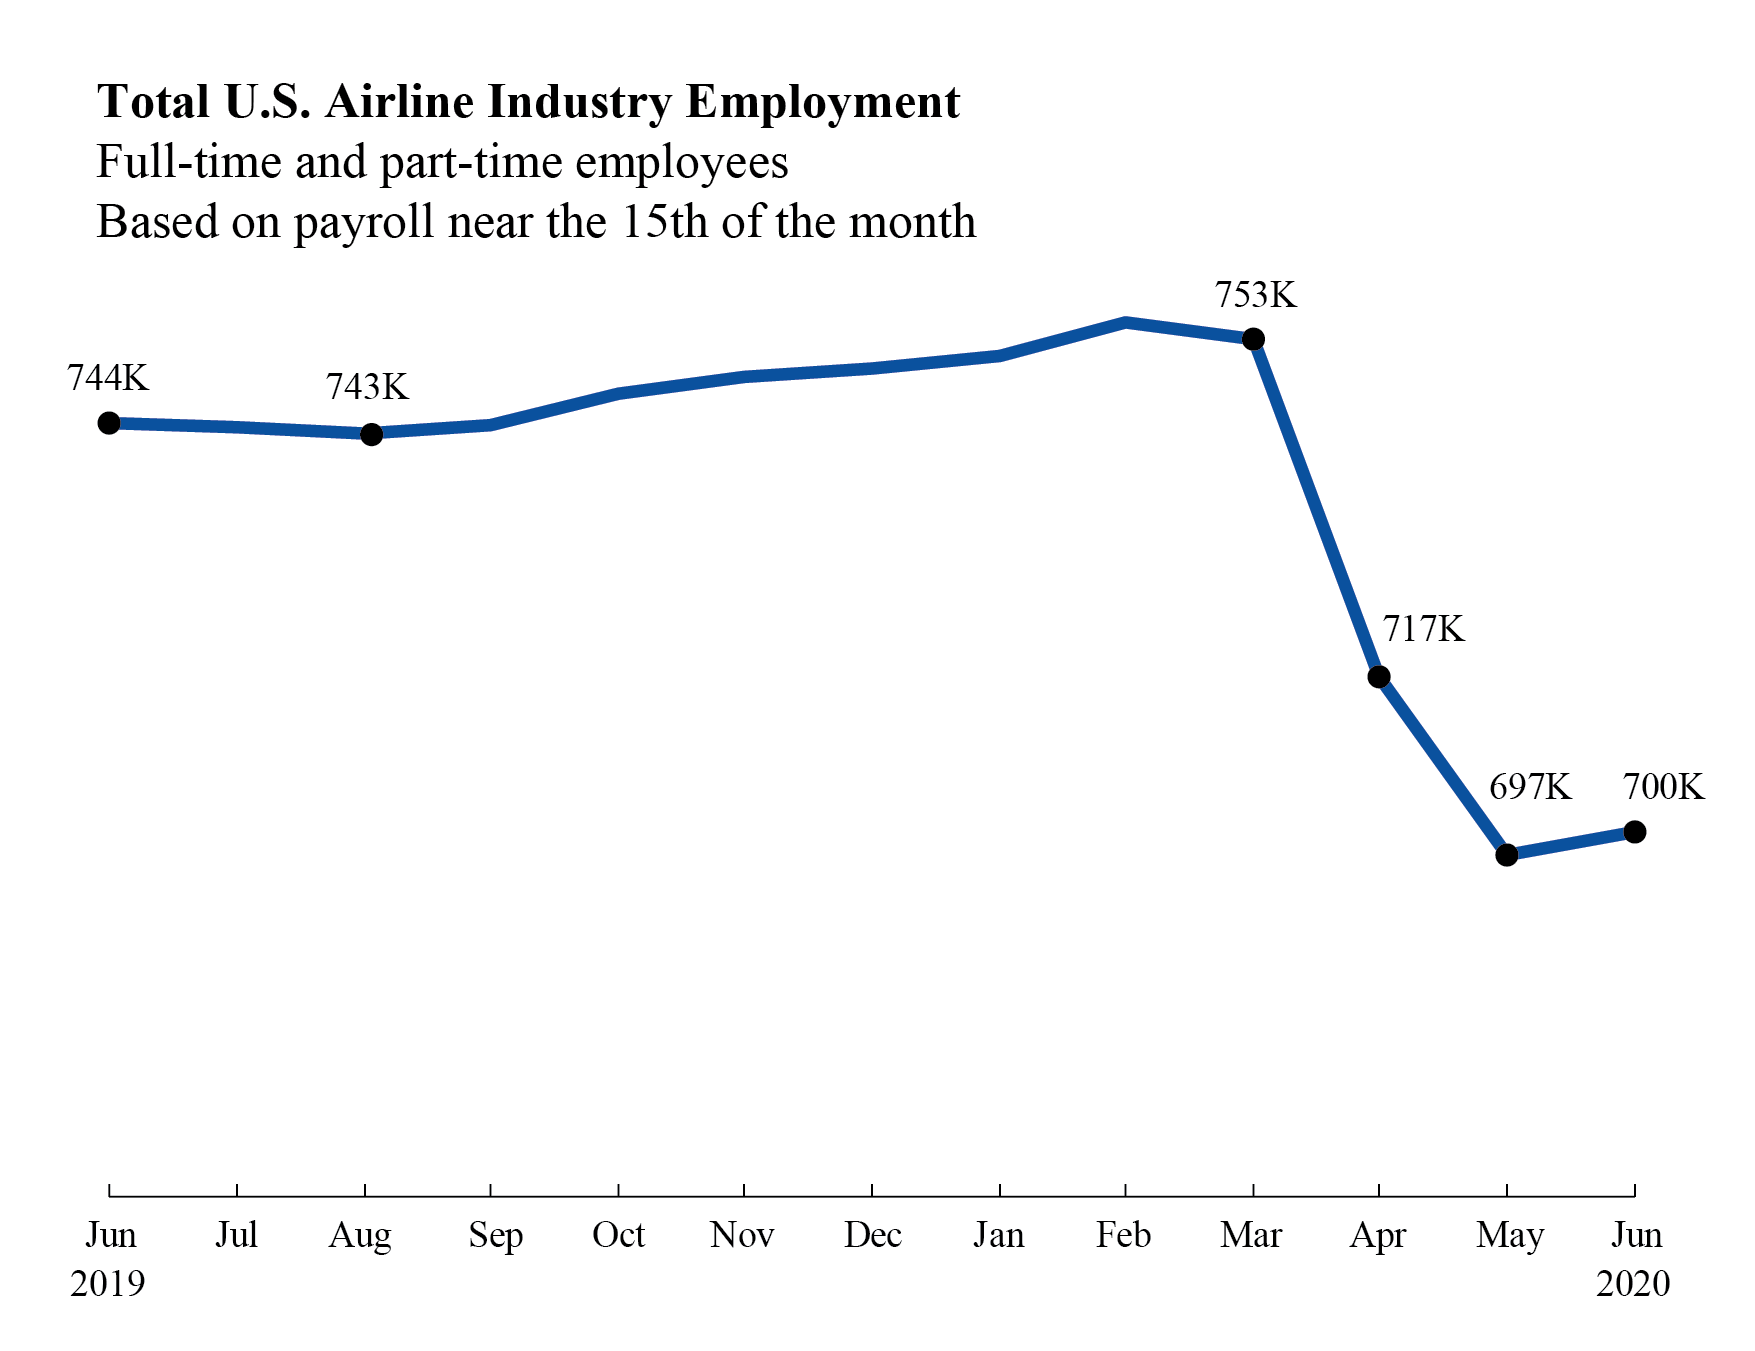
Previous release: US airlines employed 699,683 workers in the middle of June 2020, 2,446 more than in mid-May 2020 and 53,602 fewer than in March 2020. The June 2020 numbers consist of 508,688 full-time and 111,075 part-time workers. Regulations require airlines to report employment numbers for a pay period near the 15th of the month. Monthly full-time and part-time employment statistics are reported by U.S. airlines that operate at least one aircraft that has more than 60 seats or the capacity to carry a payload of passengers, cargo and fuel weighing more than 18,000 pounds.
-
Freight Transportation Services Index (TSI), July 2020
Thursday, September 10, 2020 - 10:00am ET
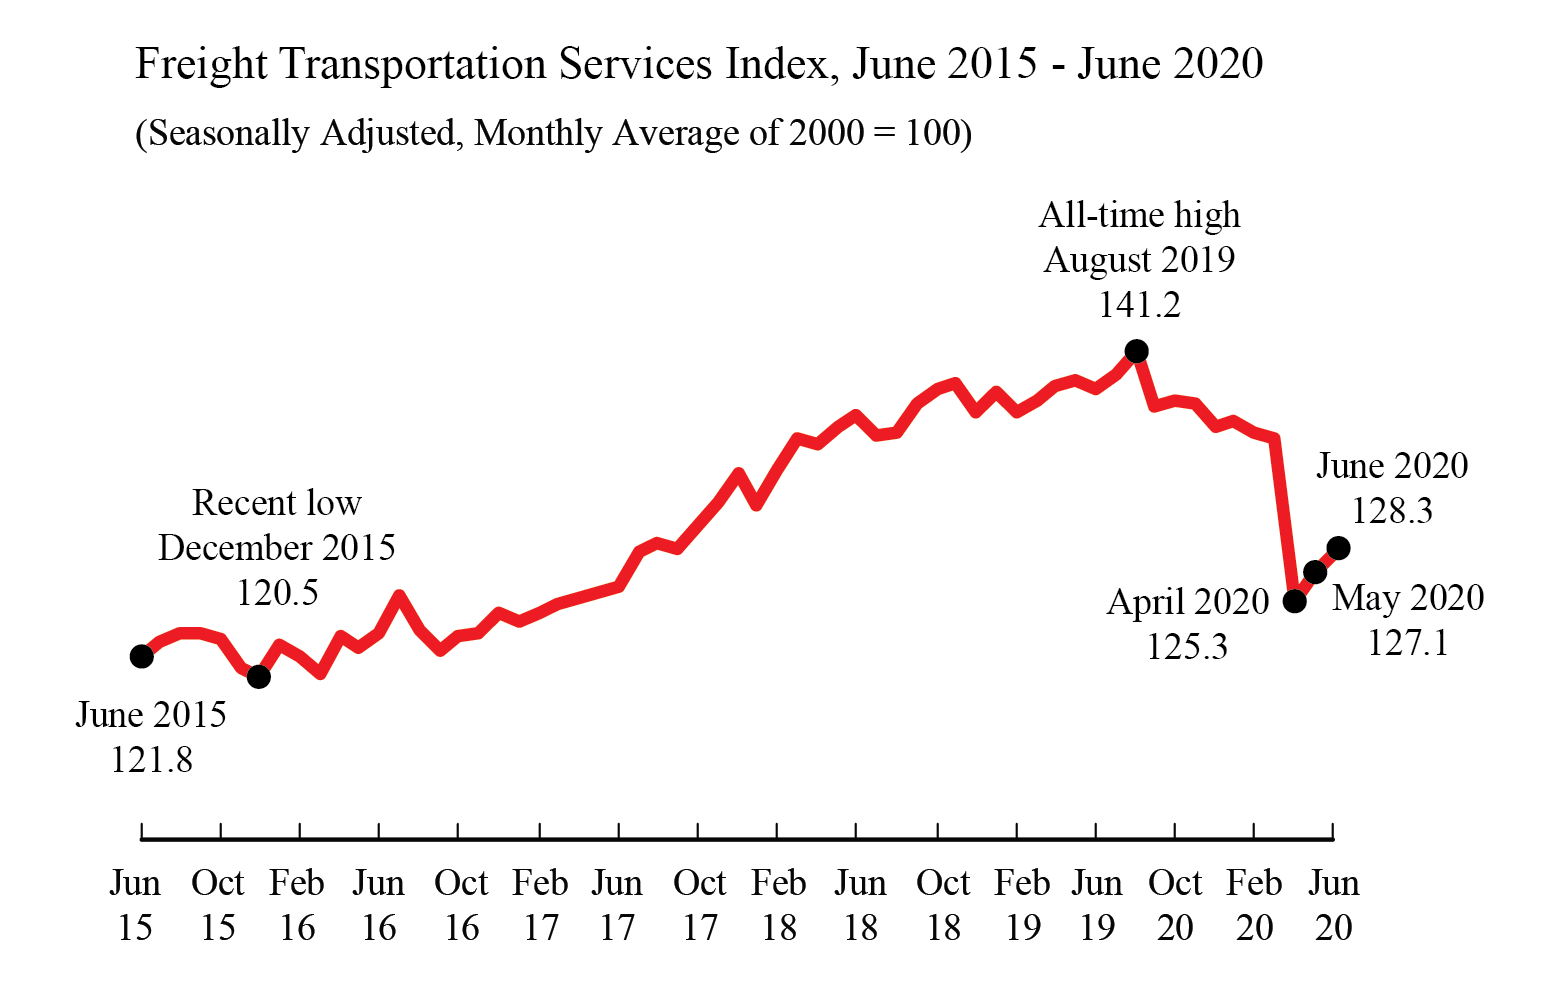
The Freight TSI measures the month-to-month changes in for-hire freight shipments by mode of transportation. In the previous release for June, the Freight TSI rose 0.9% in June from May, rising for the second consecutive month. From June 2019 to June 2020, the index fell 7.6% compared to a rise of 1.2% from June 2018 to June 2019 and a rise of 8.7% from June 2017 to June 2018.
-
Airline Traffic Data, June 2020 final
Friday, September 11, 2020 - 11:00am ET
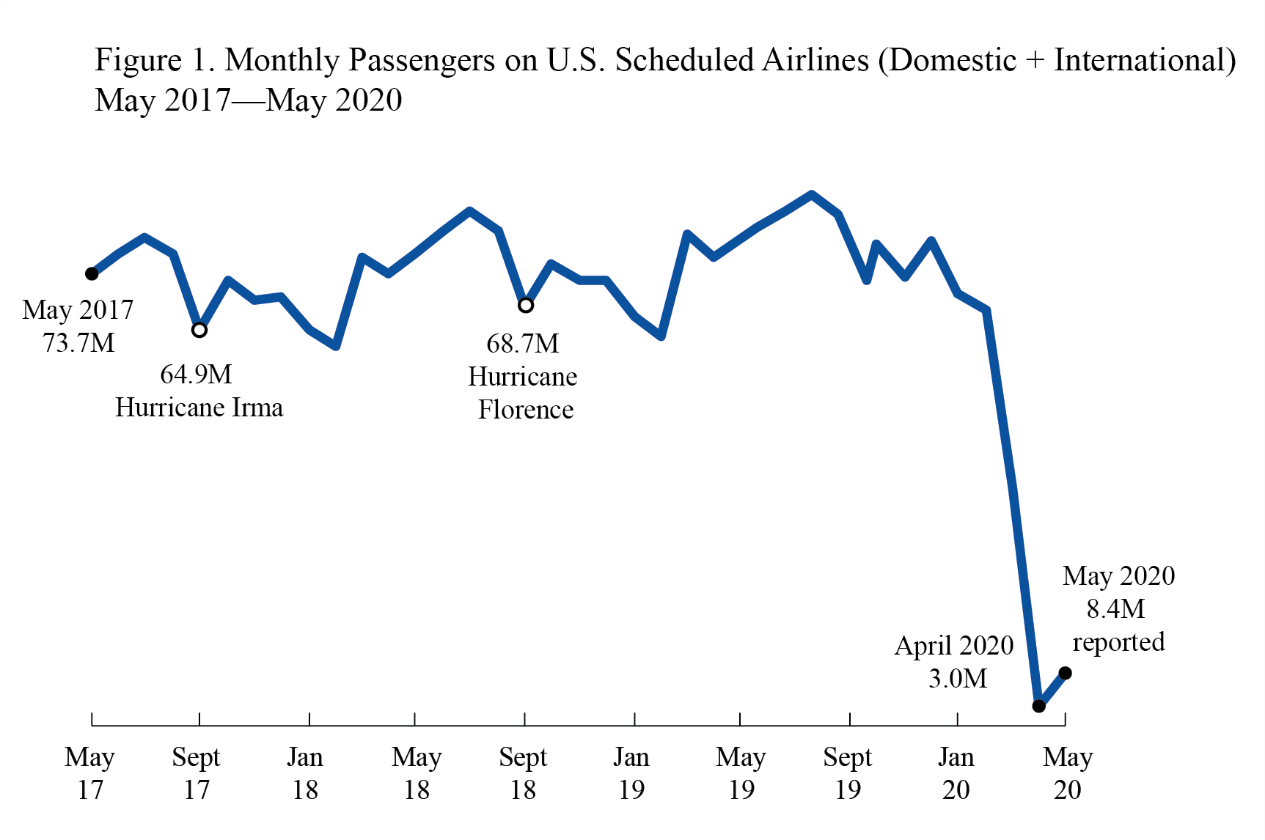
BTS release of reported data through June. Data are for U.S. airlines monthly passengers, revenue passenger-miles, available seat-miles and load factor for systemwide, domestic and international. Numbers are seasonally-adjusted and unadjusted. In the previous release, U.S. airlines carried 8.4 million systemwide (domestic and international) scheduled service passengers in May 2020, down 89.6% from May 2019. U.S. airlines 8.2 million domestic passengers and 0.2 million international passengers on flights in May.
-
Airline Passenger Data, July 2020 (Preliminary)
Release TBD
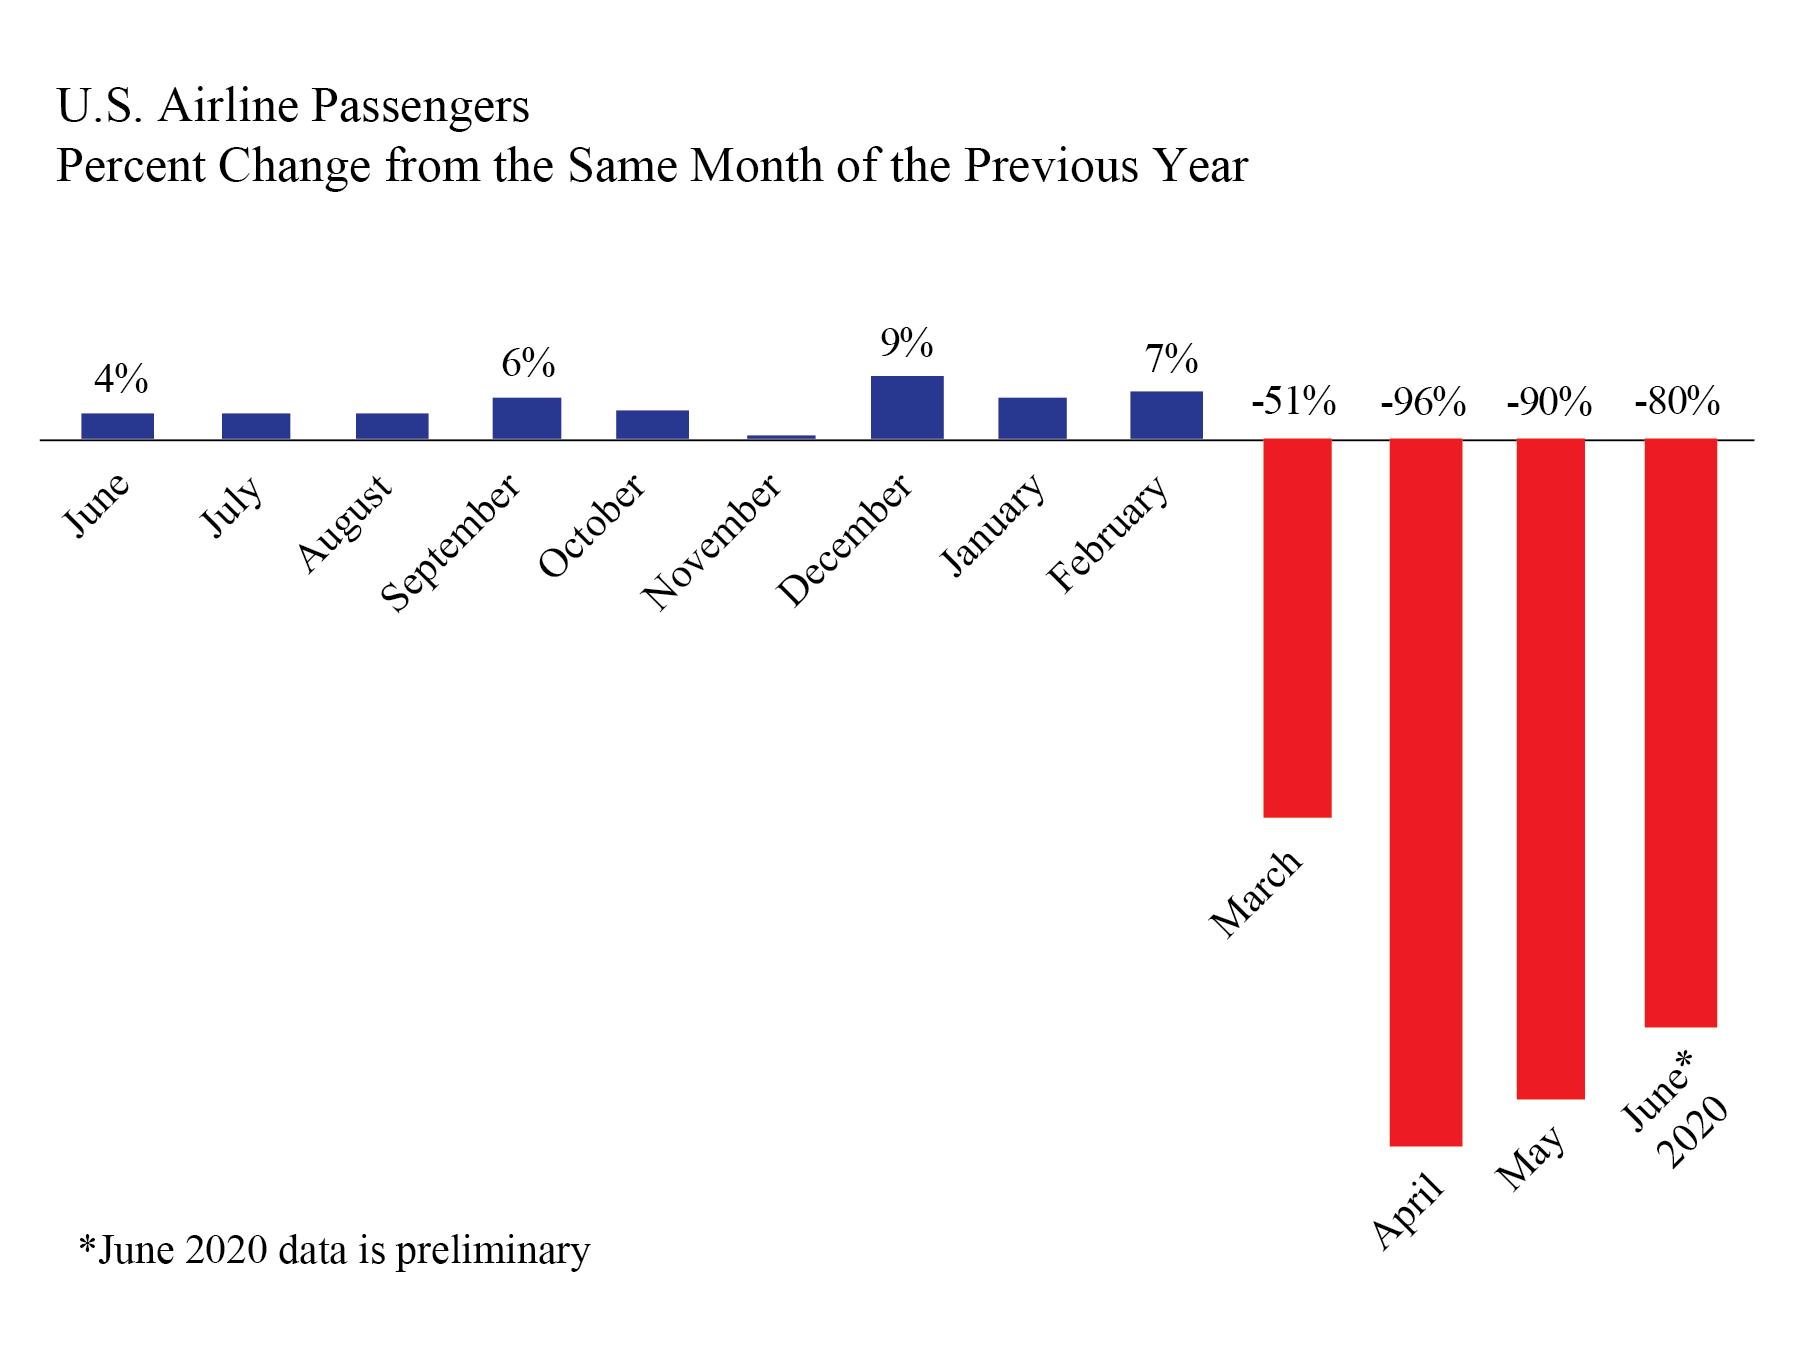
This release provides preliminary monthly passenger data from the airlines that carry the most passengers. These airlines carry more than 90% of the scheduled service passengers on U.S. airlines. From the previous month’s release, U.S. airlines carried 80% fewer scheduled service passengers in June 2020 than in June 2019. Despite the large annual drop from pre-pandemic numbers a year earlier (see graphic), when compared to the previous month U.S. airlines carried almost twice as many passengers (93% more) in June 2020 than in May 2020. The 80% decline was less than the annual decrease than in both April (96%) or May (90%).
BTS Previously
BTS has released the following:
-
Air Cargo between the U.S. and Foreign Points, June 2020 (Preliminary)
Released August 18
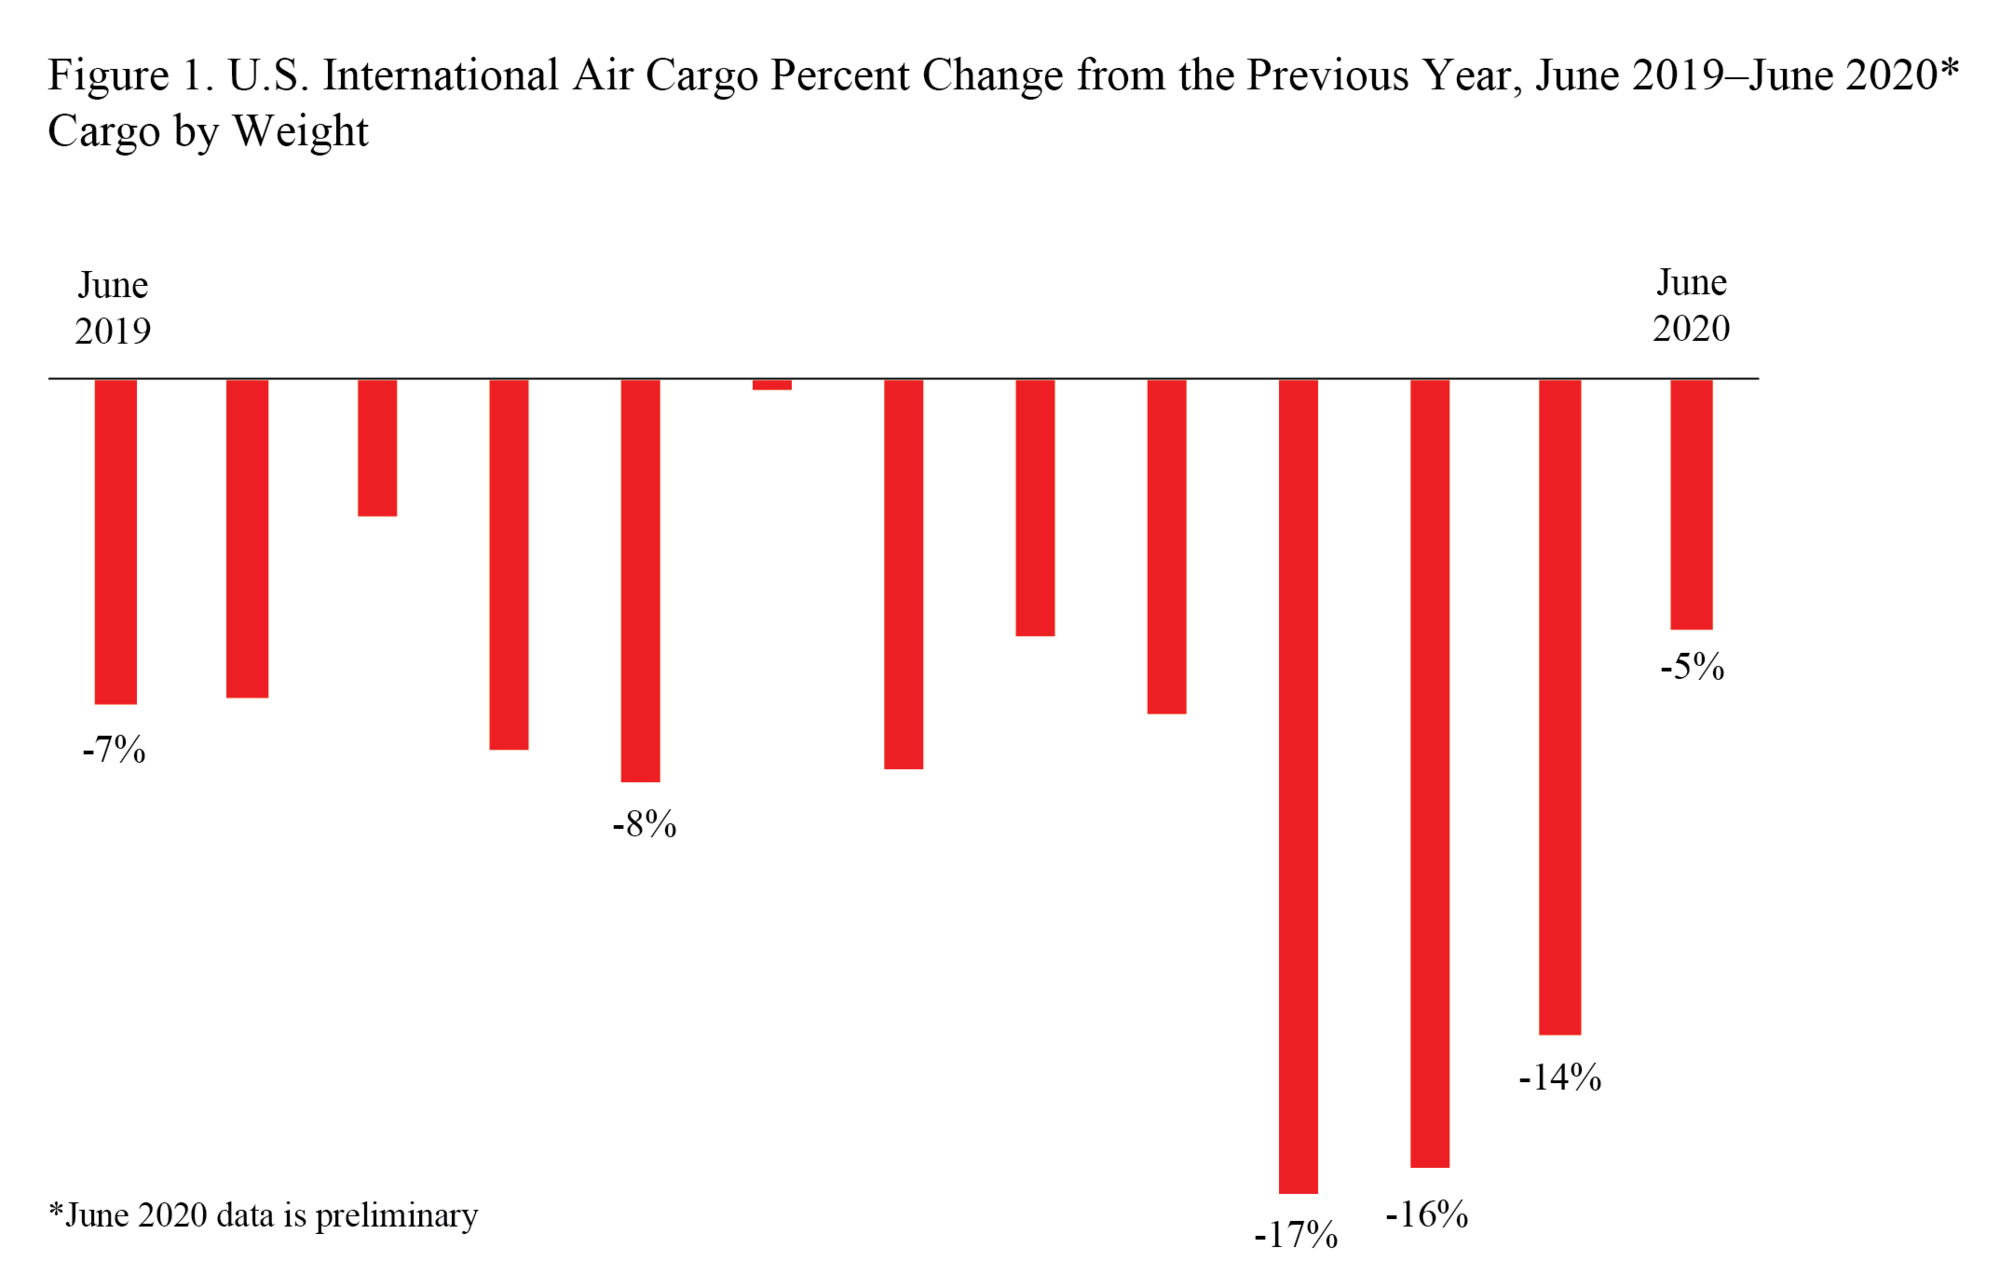
U.S. and foreign airlines carried 5% less cargo by weight between the U.S. and foreign points in June 2020 than in June 2019, despite a rise of almost 11% in cargo between the U.S. and Asia. June’s decline was smaller than year-over-year decreases in March (down 17%), April (down 16%) and May (down 14%).
-
Passenger Airline Employment, June 2020
Released August 19
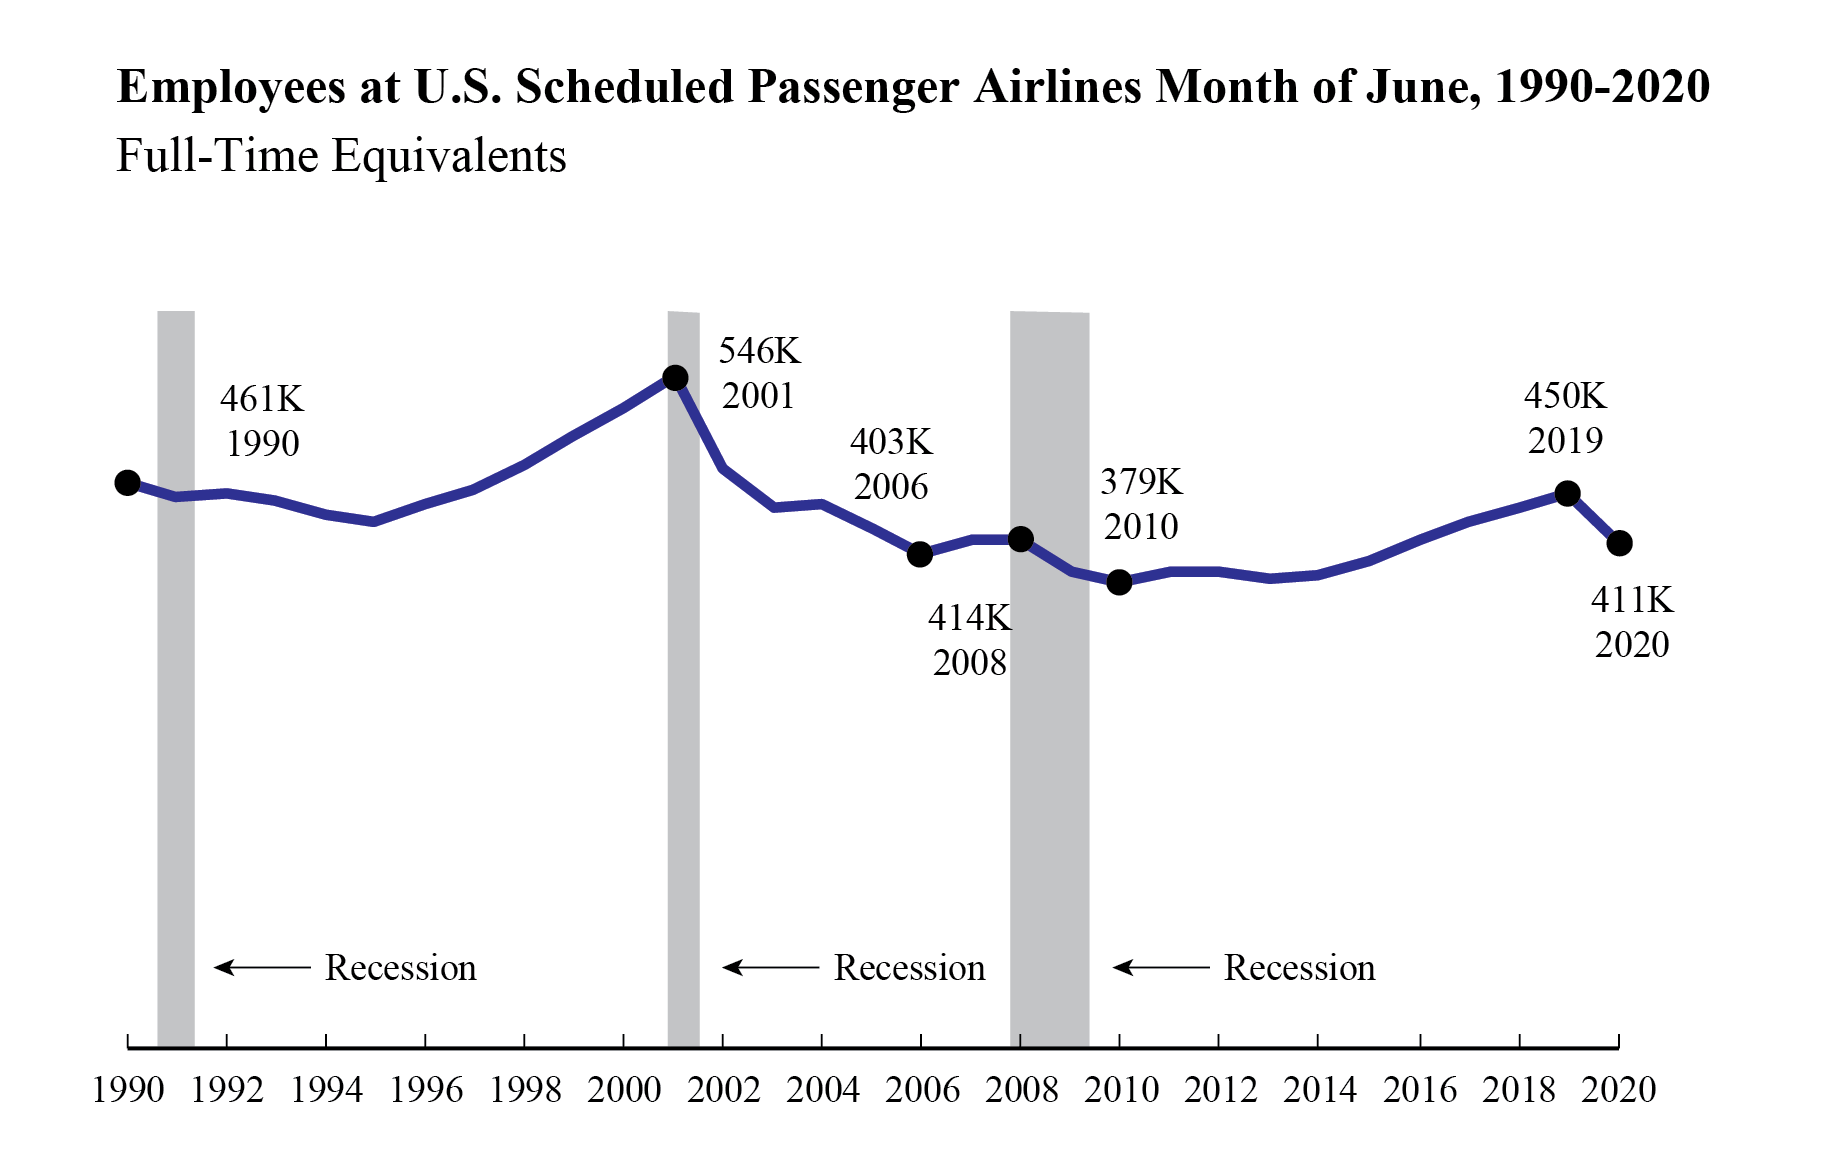
BTS reported that 23 U.S. scheduled passenger airlines employed 0.3% fewer full-time equivalents (FTEs) in mid-June 2020 than in mid-May 2020.
-
Mid-June’s total number of FTEs (410,594) was down over 1,000 FTEs from mid-May 2020 (411,817 FTEs) and down more than 49,000 FTEs from mid-March 2020. It was the lowest FTE total for any month since May 2016 (410,338 FTEs).
-
Mid-June 2020 FTEs were down more than 39,000 FTEs (-8.7%) from June 2019 (449,775 FTEs).
-
Airline On-Time/Cancellation Data, May 2020
Released August 21
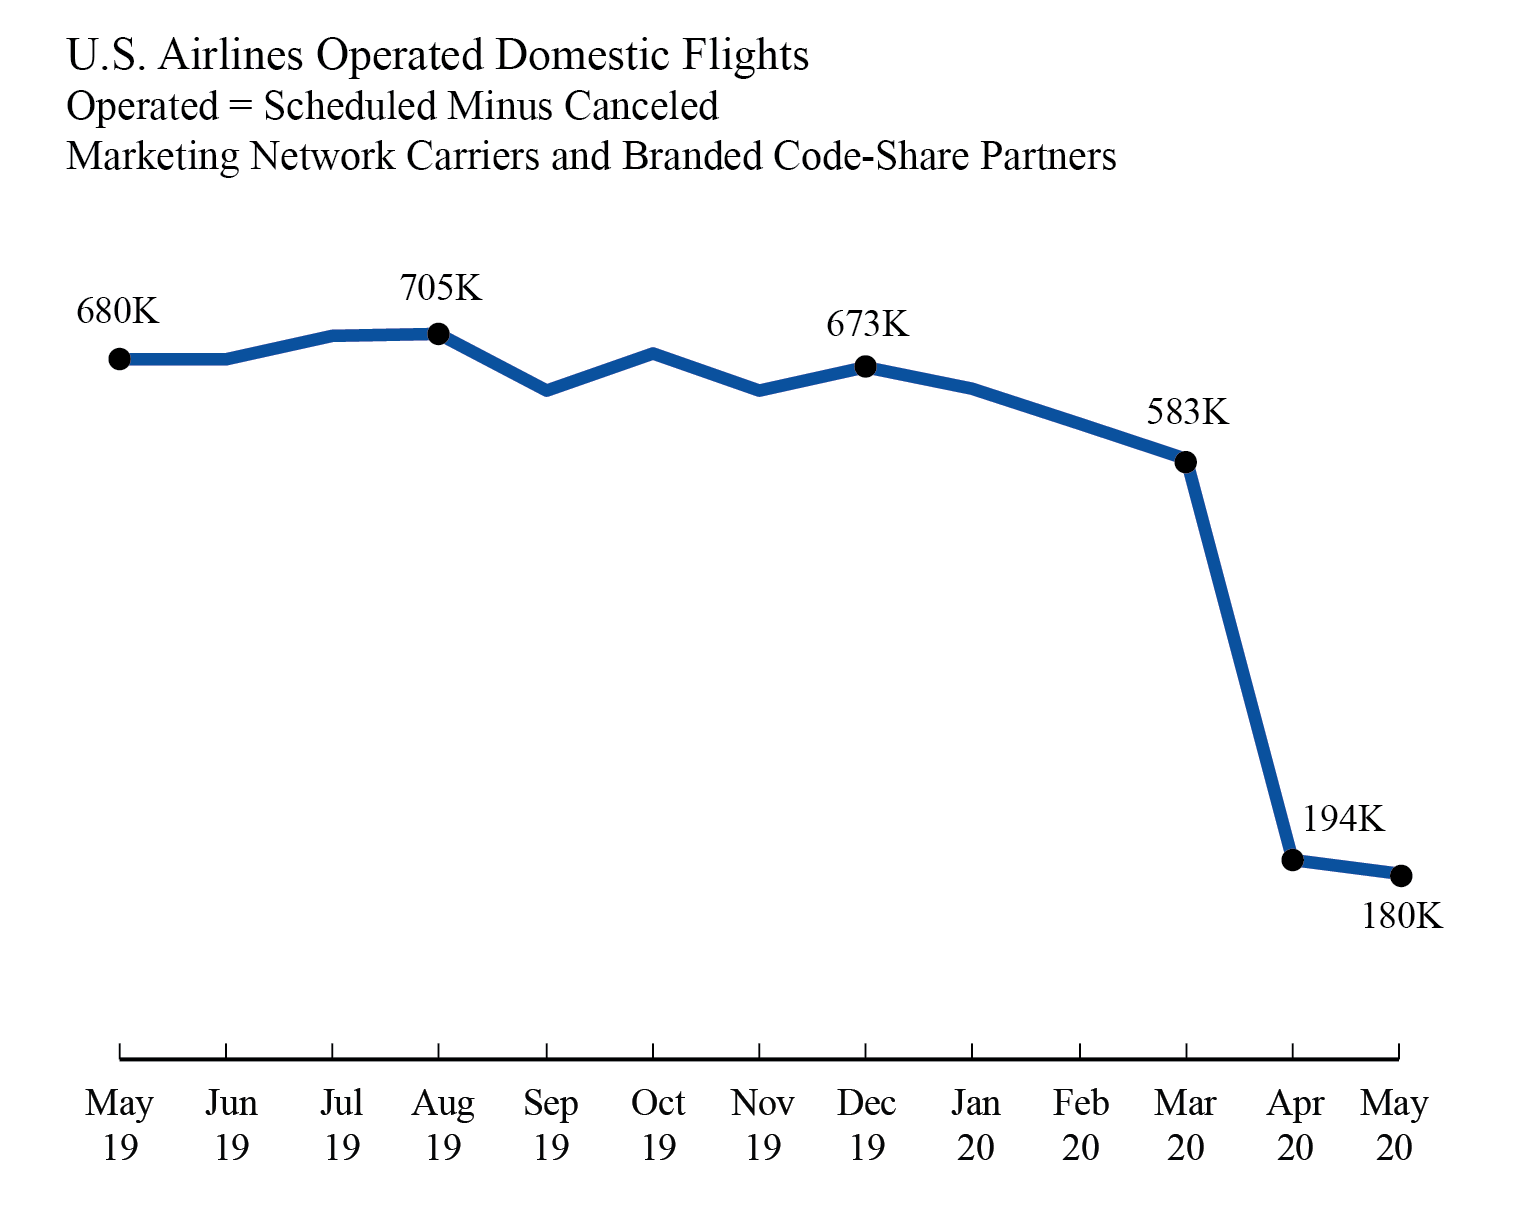
The 10 marketing network carriers reported 192,412 scheduled domestic flights in May 2020 compared to 331,238 flights in April 2020 and 694,331 flights in May 2019. Of those 192,412 scheduled flights, 6.4%, 12,261 flights, were canceled. As a result of schedule reductions and cancellations, the carriers reported operating an all-time monthly low 180,151 flights in May 2020, compared to 194,390 flights in April 2020 and the previous low of 370,027 in February 1994. The marketing carriers include branded code-share partners of mainline carriers.
-
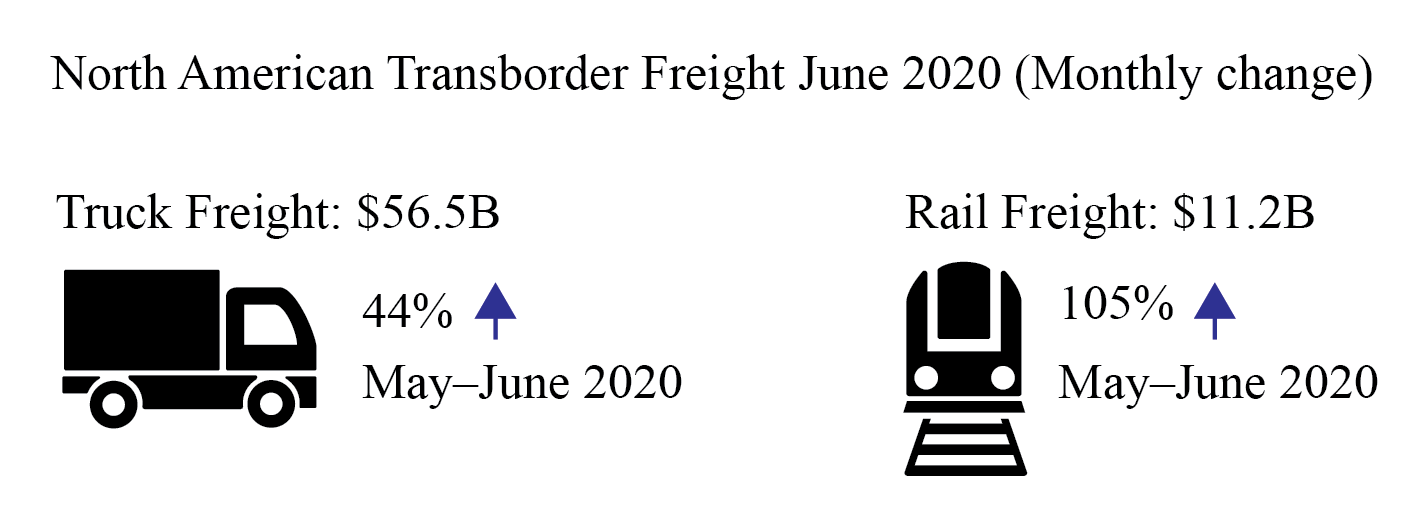
North American Freight Data, June 2020
Released August 25
-
Freight between the U.S. and other North American countries (Canada and Mexico) in June 2020: Total Transborder freight: $82.1 billion of transborder freight moved by all modes of transportation, up 46.3% compared to May 2020 and up 41.2% from April 2020.
-
Transborder freight value in June was down 20.9% compared to June 2019.
-
Most-used mode: Trucks moved $56.5 billion of freight, up 44.2% compared to May 2020, down 13.9% compared to June 2019.
-
Second most-used mode: Railways moved $11.2 billion of freight, up 105% compared to May 2020, down 28.9% compared to June 2019.
See BTS Release Schedule
BTS Contact: Dave Smallen
202-366-5568


