BTS 2-Week Outlook
Bureau of Transportation Statistics Upcoming Releases
August 3-14
Upcoming from Aug. 3
Wednesday, August 5, 2020 - 11:00am ET
Airline Fuel Cost and Consumption, June 2020
Thursday, August 6, 2020 - 11:00am ET
Airline Full-Time/Part-Time Employment, June 2020
Wednesday, August 12, 2020 - 10:00am ET
Transportation Services Index, June 2020
Thursday, August 13, 2020 - 11:00am ET
Airline Traffic Data, May 2020 Final
TBD
U.S. Airline Passenger Numbers, June 2020 (Preliminary)
TBD
Airline On-Time/Cancellation Data, May 2020
Previously Released
July 20 - Passenger Airline Employment, May 2020
July 21 - Average Air Fares, 1st Quarter 2020
July 22 - North American Freight Data, May 2020
July 23 - US Airlines Cargo Data, May 2020 (Preliminary)
July 28 – International Air Cargo, May 2020 (Preliminary
The Bureau of Transportation Statistics will release the following data sets in the next two weeks:
-
Airline Fuel Cost and Consumption, June 2020
Wednesday, August 5, 2020 - 11:00am ET
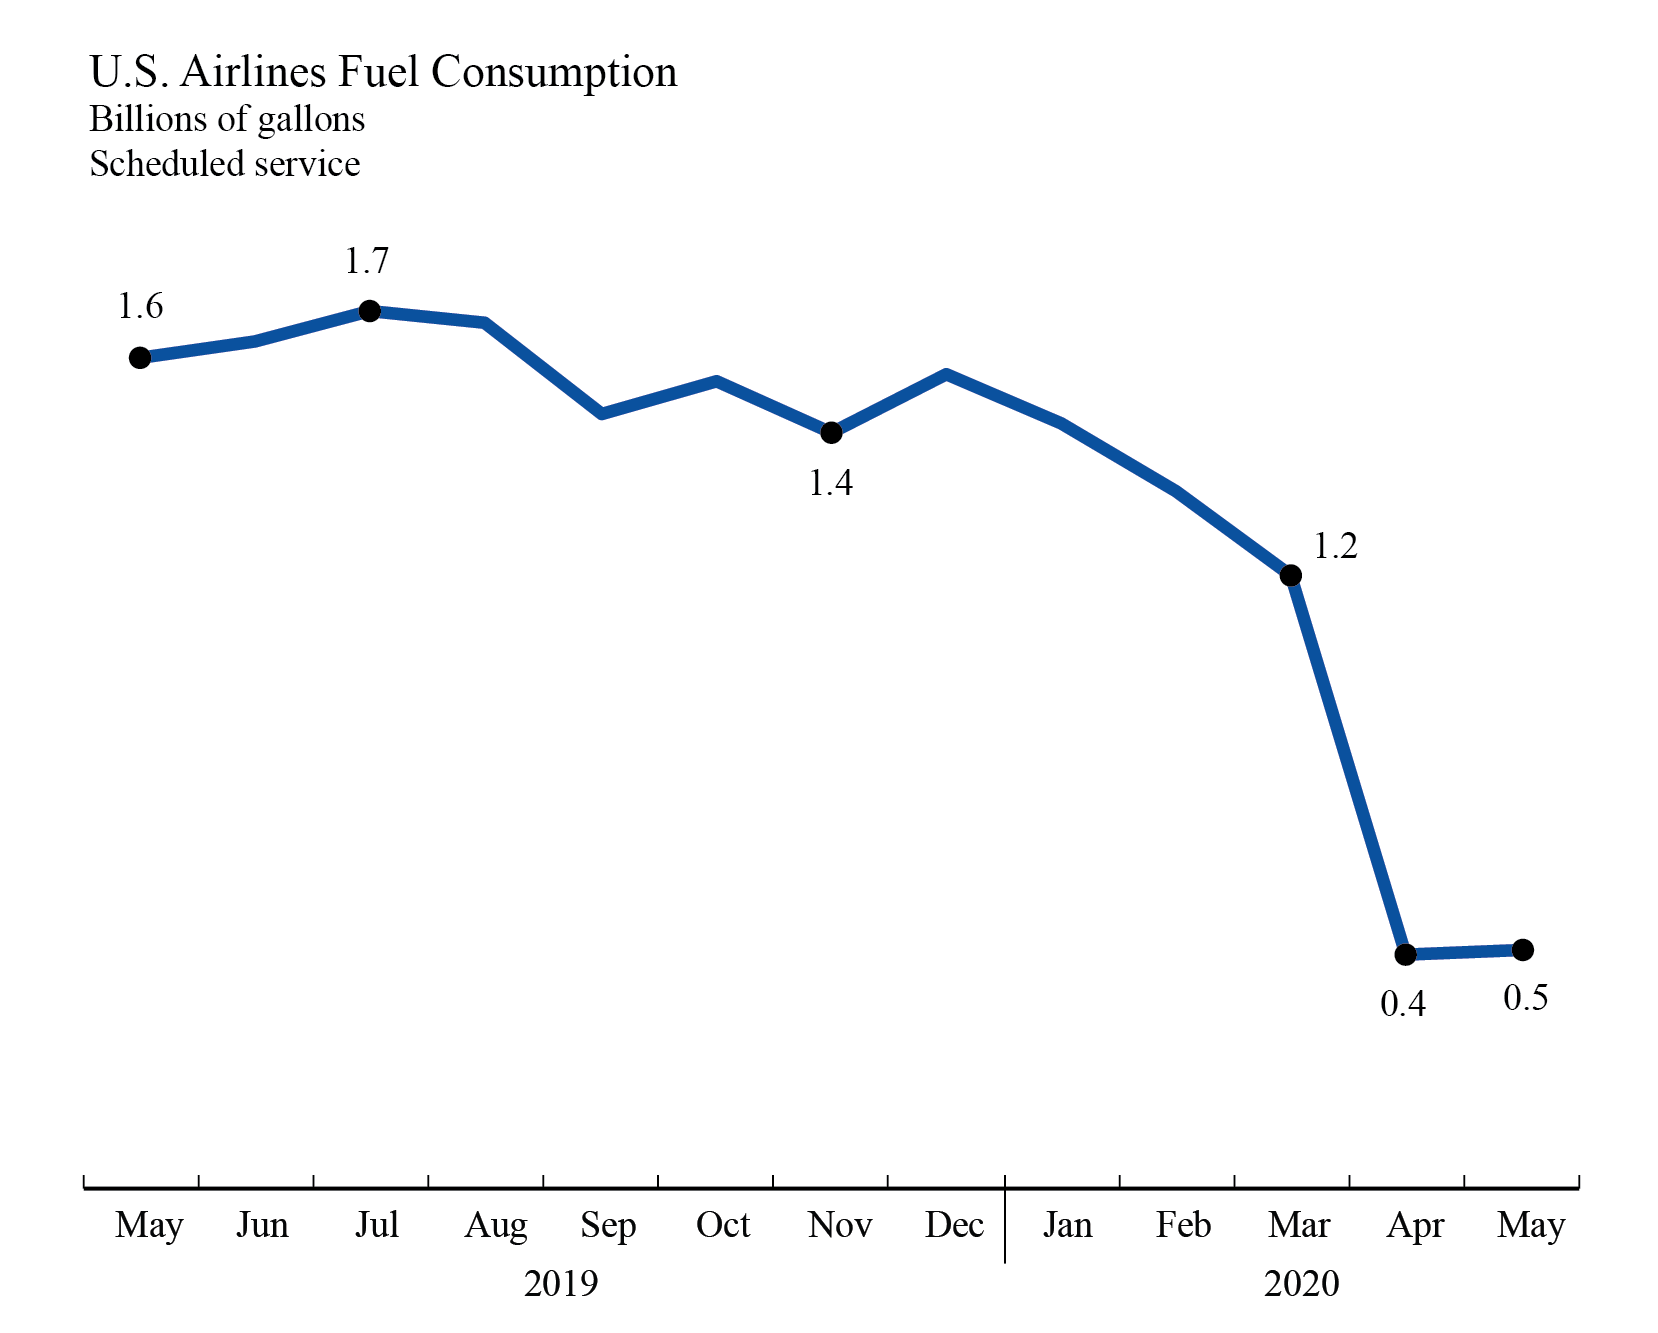
Previous release: U.S. airlines May 2020 fuel consumption rose 1.4% from April 2020, which was the lowest fuel consumption in records dating back to 2000.
Fuel consumed by U.S. airlines’ scheduled services:
May 2019 1.6 billion gallons
April 2020 447 million gallons
May 2020 453 million gallons
Industry summary of airline fuel consumption, total fuel cost and price paid per gallon are available on the database. Individual
airline numbers through March are available on the BTS website. Individual airline numbers for April, May and June will be available on Sept. 14.
- Airline Full-Time/Part-Time Employment, June 2020
Thursday, August 6, 2020 - 11:00am ET
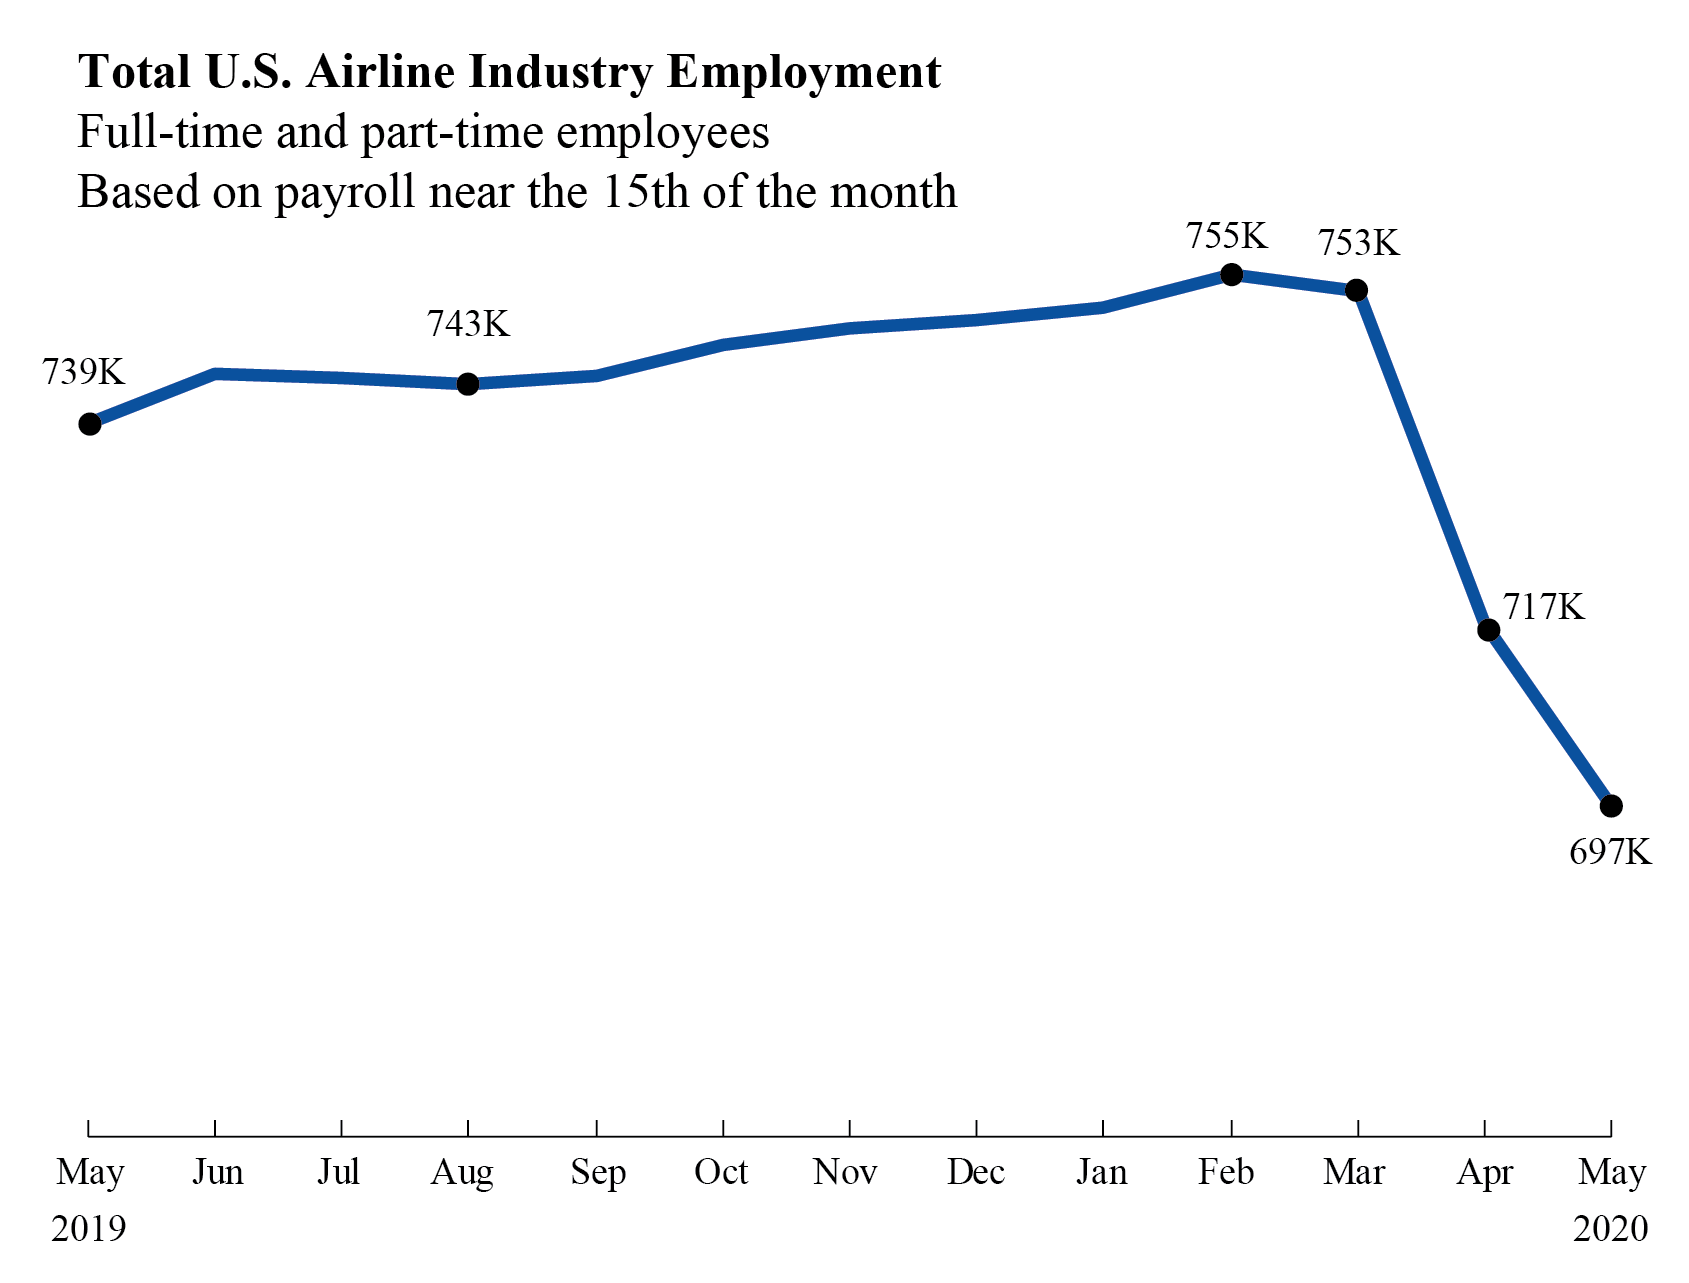
Previous release: US airlines employed 696,534 workers in the middle of May 2020, 20,100 fewer than in mid-April 2020 and 42,282 fewer than in May 2019. The May 2020 numbers consist of 588,802 full-time and 107,732 part-time workers. Regulations require airlines to report employment numbers for a pay period near the 15th of the month. Monthly full-time and part-time employment statistics are reported by U.S. airlines that operate at least one aircraft that has more than 60 seats or the capacity to carry a payload of passengers, cargo and fuel weighing more than 18,000 pounds.
-
Freight Transportation Services Index (TSI), June 2020
Wednesday, August 12, 2020 - 10:00am ET
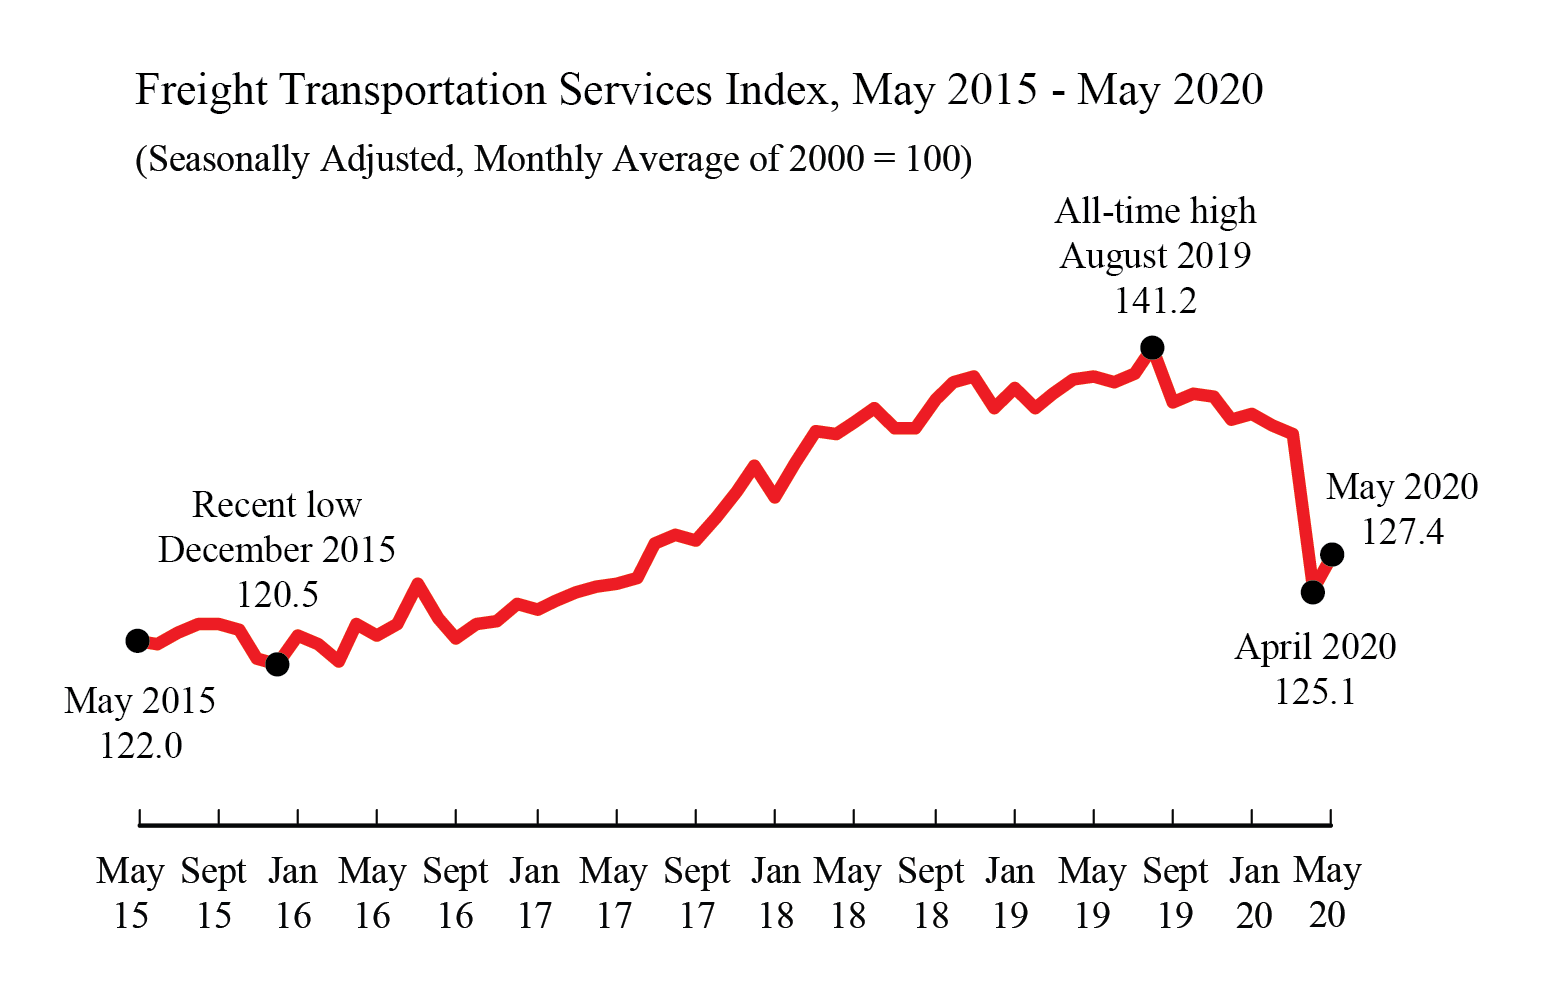
The Freight TSI measures the month-to-month changes in for-hire freight shipments by mode of transportation. In the previous release for May, the Freight TSI rose 1.6% in May from April, rising after a three-month decline. From May 2019 to May 2020, the index fell 8.5% compared to a rise of 2.1% from May 2018 to May 2019 and a rise of 8.4% from May 2017 to May 2018.
-
Airline Traffic Data, May 2019 final
Thursday, August 13, 2020 - 11:00am ET
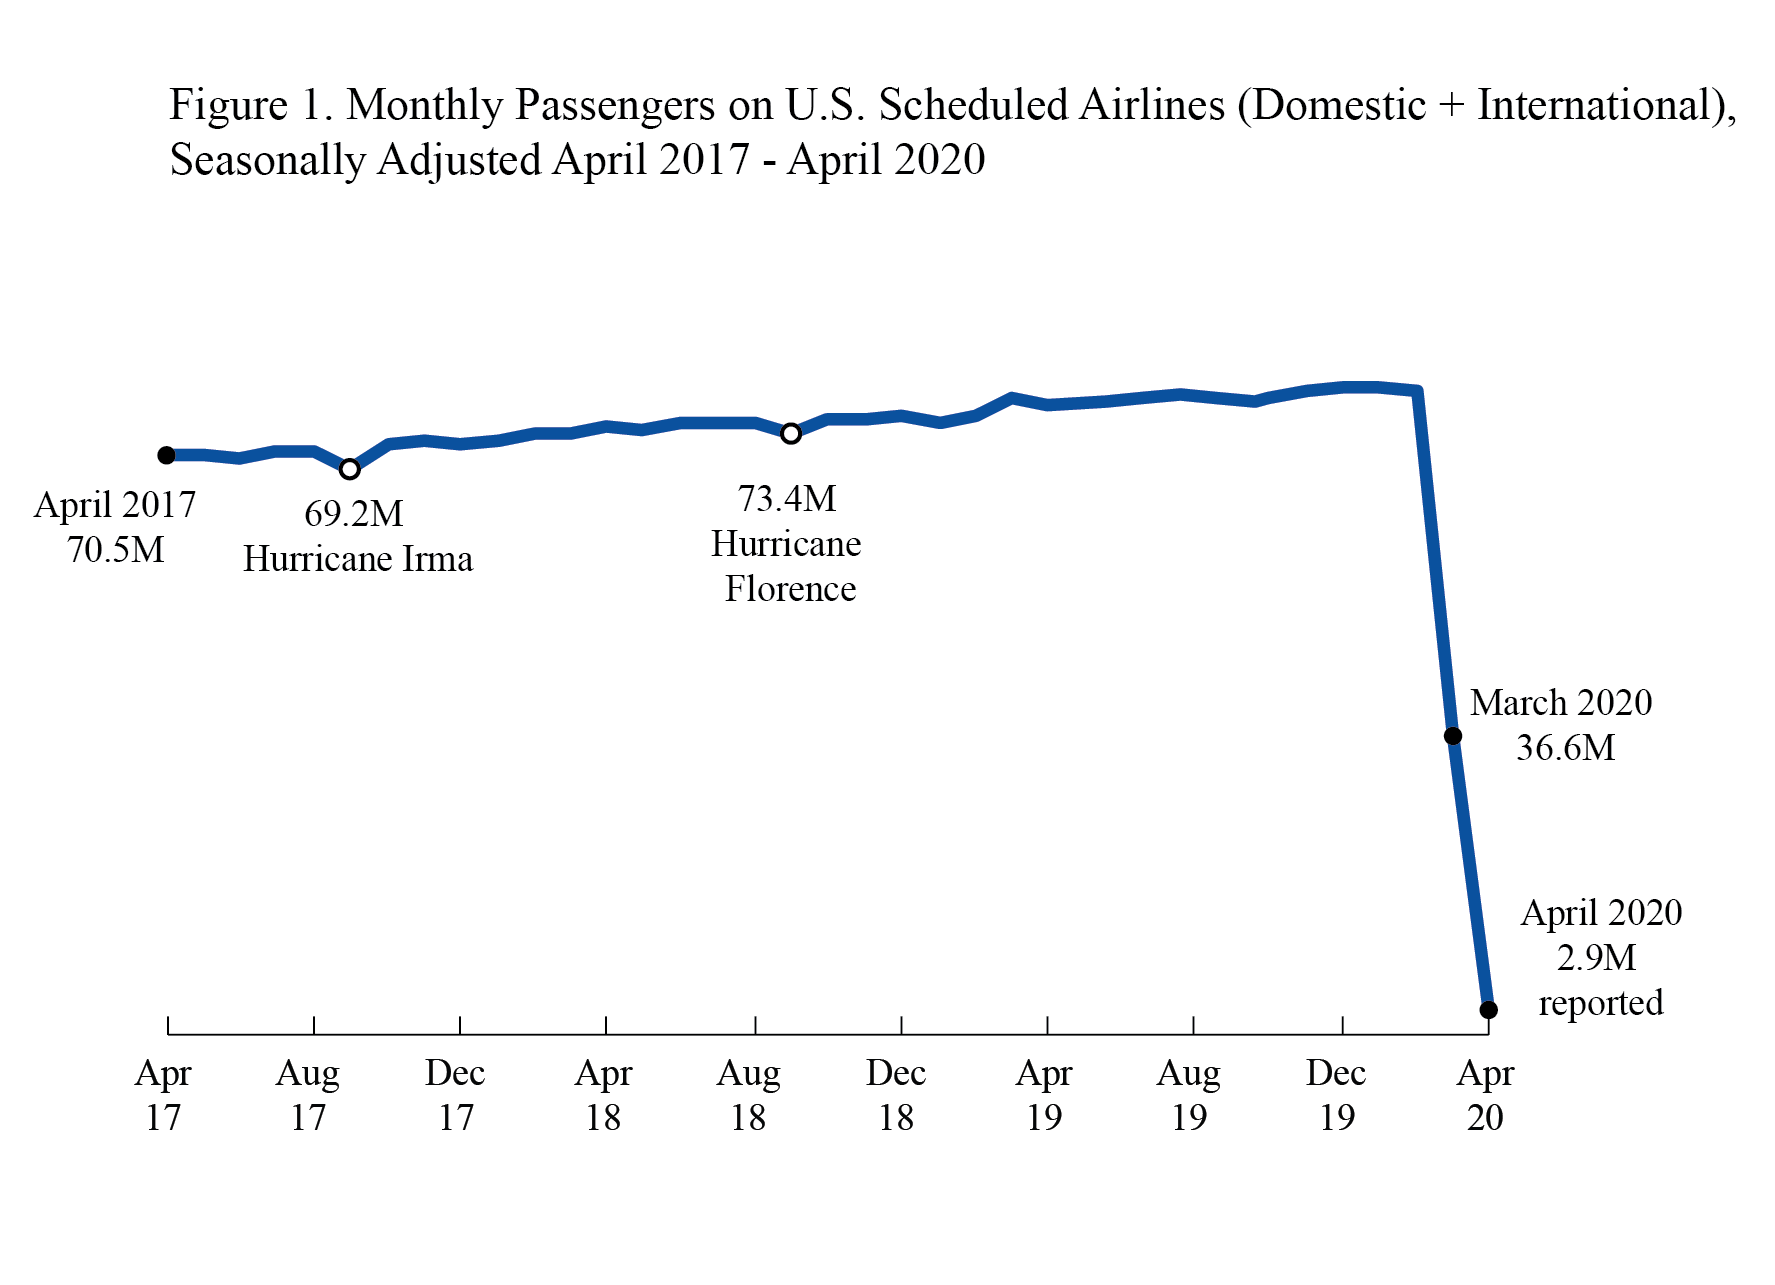
BTS release of reported data through May. Data are for U.S. airlines monthly passengers, revenue passenger-miles, available seat-miles and load factor for systemwide, domestic and international. Numbers are seasonally-adjusted and unadjusted. In the previous release, U.S. airlines carried 2.9 million systemwide (domestic and international) scheduled service passengers in April 2020, down 92.2% from March, seasonally-adjusted. U.S. airlines carried 2.6 million domestic passengers and 0.2 million international passengers on flights in April.
-
Airline Passenger Data, June 2020 (Preliminary)
Release TBD
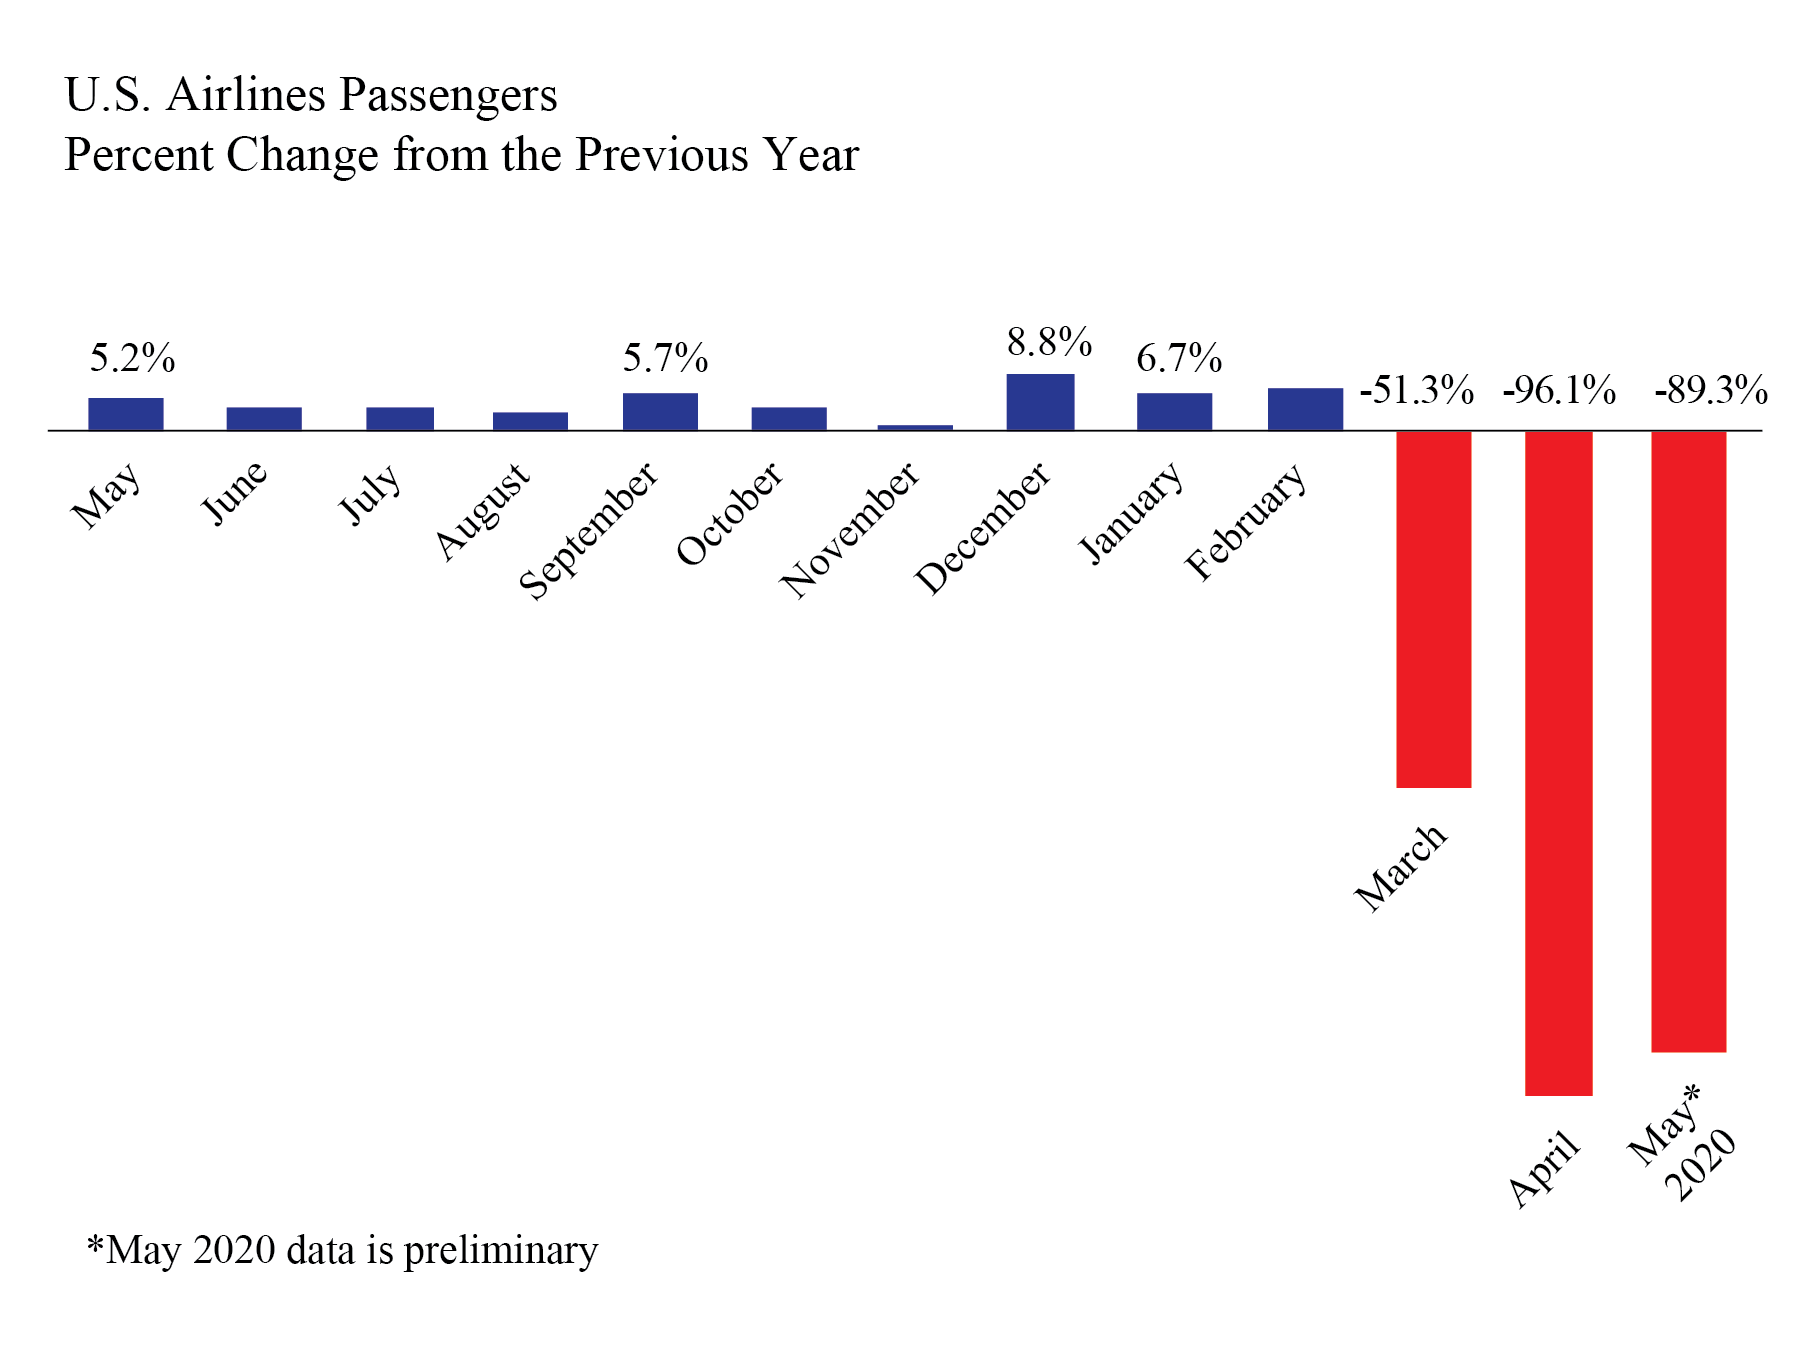
This release provides preliminary monthly passenger data from the airlines that carry the most passengers. These airlines carry 99% to scheduled service passengers on U.S. airlines. From the previous month’s release, U.S. airlines carried 89% fewer scheduled service passengers in May 2020 than in May 2019. Despite the large drop from May 2019, U.S. airlines carried more than twice as many passengers in May 2020 than in April 2020. They carried 88% fewer domestic passengers and 98% fewer international passengers than in May 2019.
-
Air Travel Consumer Report: May 2020 Numbers
Date TBD
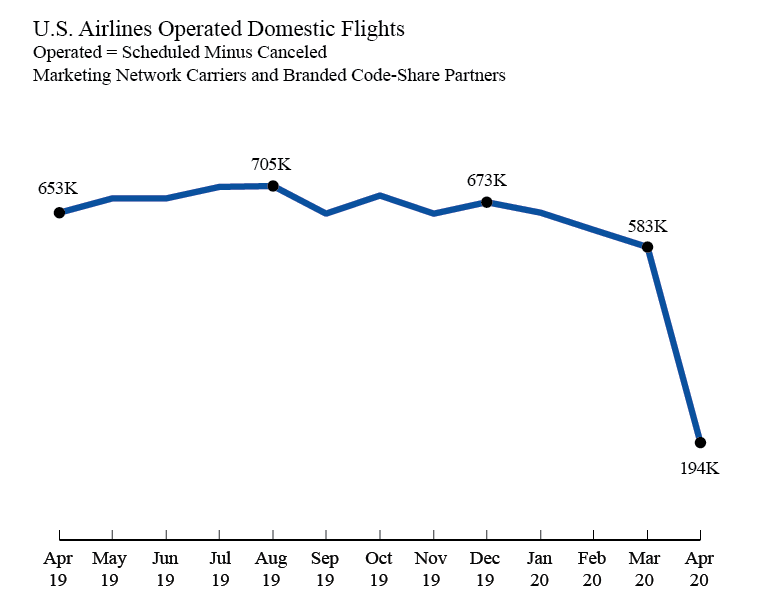
This release consists on U.S. airline domestic monthly on-time performance, cancellations, tarmac data, mishandled baggage released in coordination with the Department of Transportation’s release of the Air Travel Consumer Report. From the previous month’s release, the 10 reporting marketing network carriers reported 331,238 scheduled domestic flights in April 2020 compared to 701,278 flights in March 2020 and 668,259 flights in April 2019. Of those 331,238 scheduled flights, 41.3% were canceled, resulting in an on-time arrival rate of 55.7%, the lowest monthly on-time arrival performance since reporting began in 1987. Also, the carriers reported operating an all-time monthly low of 194,390 flights in April 2020, compared to a previous low of 370,027 in February 1994. The marketing carriers include branded code-share partners of mainline carriers.
BTS Previously
BTS has released the following:
-
Passenger Airline Employment, May 2020
Released July 20
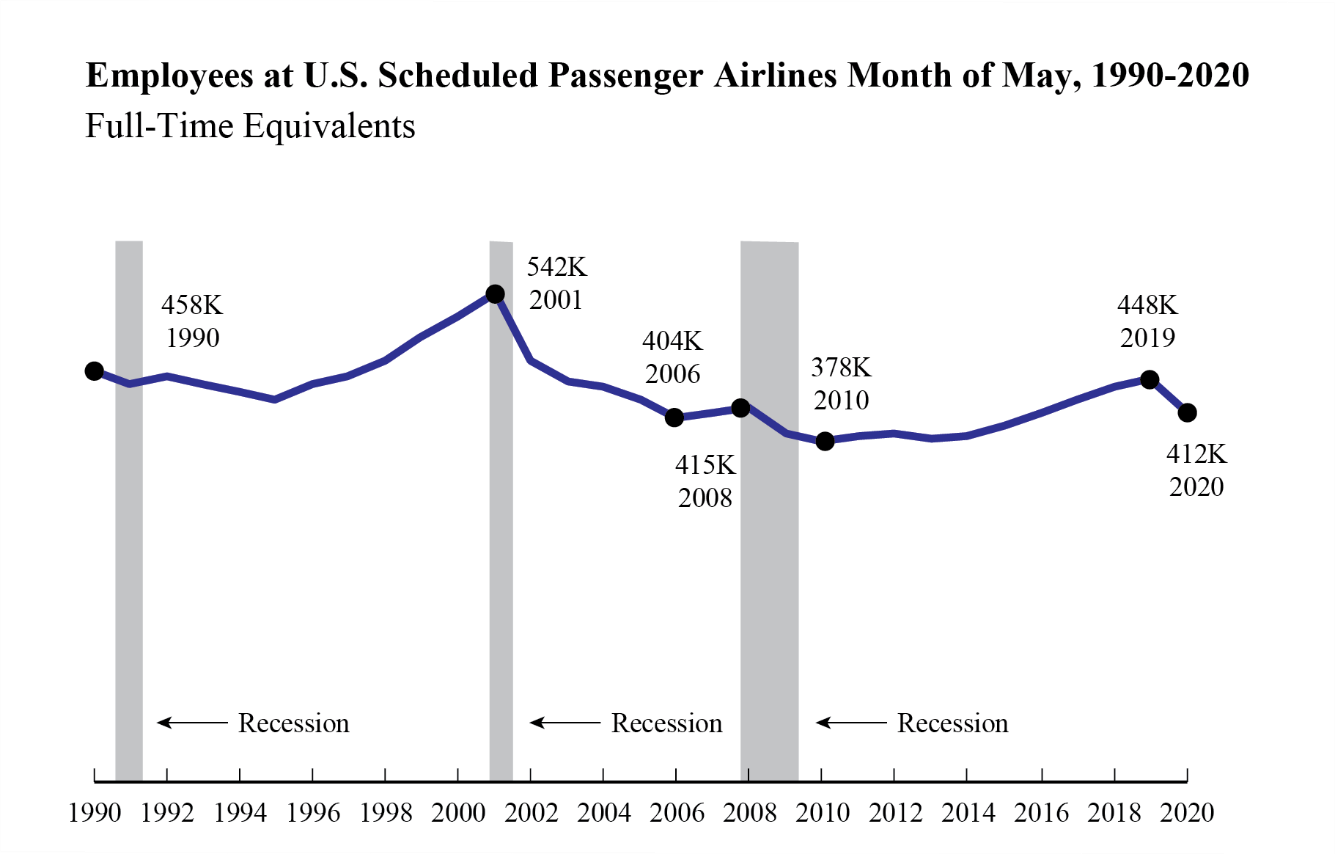
BTS reported that 23 U.S. scheduled passenger airlines employed 4.1% fewer workers in mid-May 2020 than in mid-April 2020.
-
Mid-May’s total number of FTEs (411,651) was down almost 18,000 FTEs from mid-April 2020 (429,407 FTEs) and down more than 48,000 FTEs from mid-March 2020. It was the lowest FTE total for any month since May 2016 (410,338 FTEs).
-
Mid-May 2020 FTEs were down more than 36,000 FTEs, down 8.1%, from May 2019 (447,981 FTEs).
-
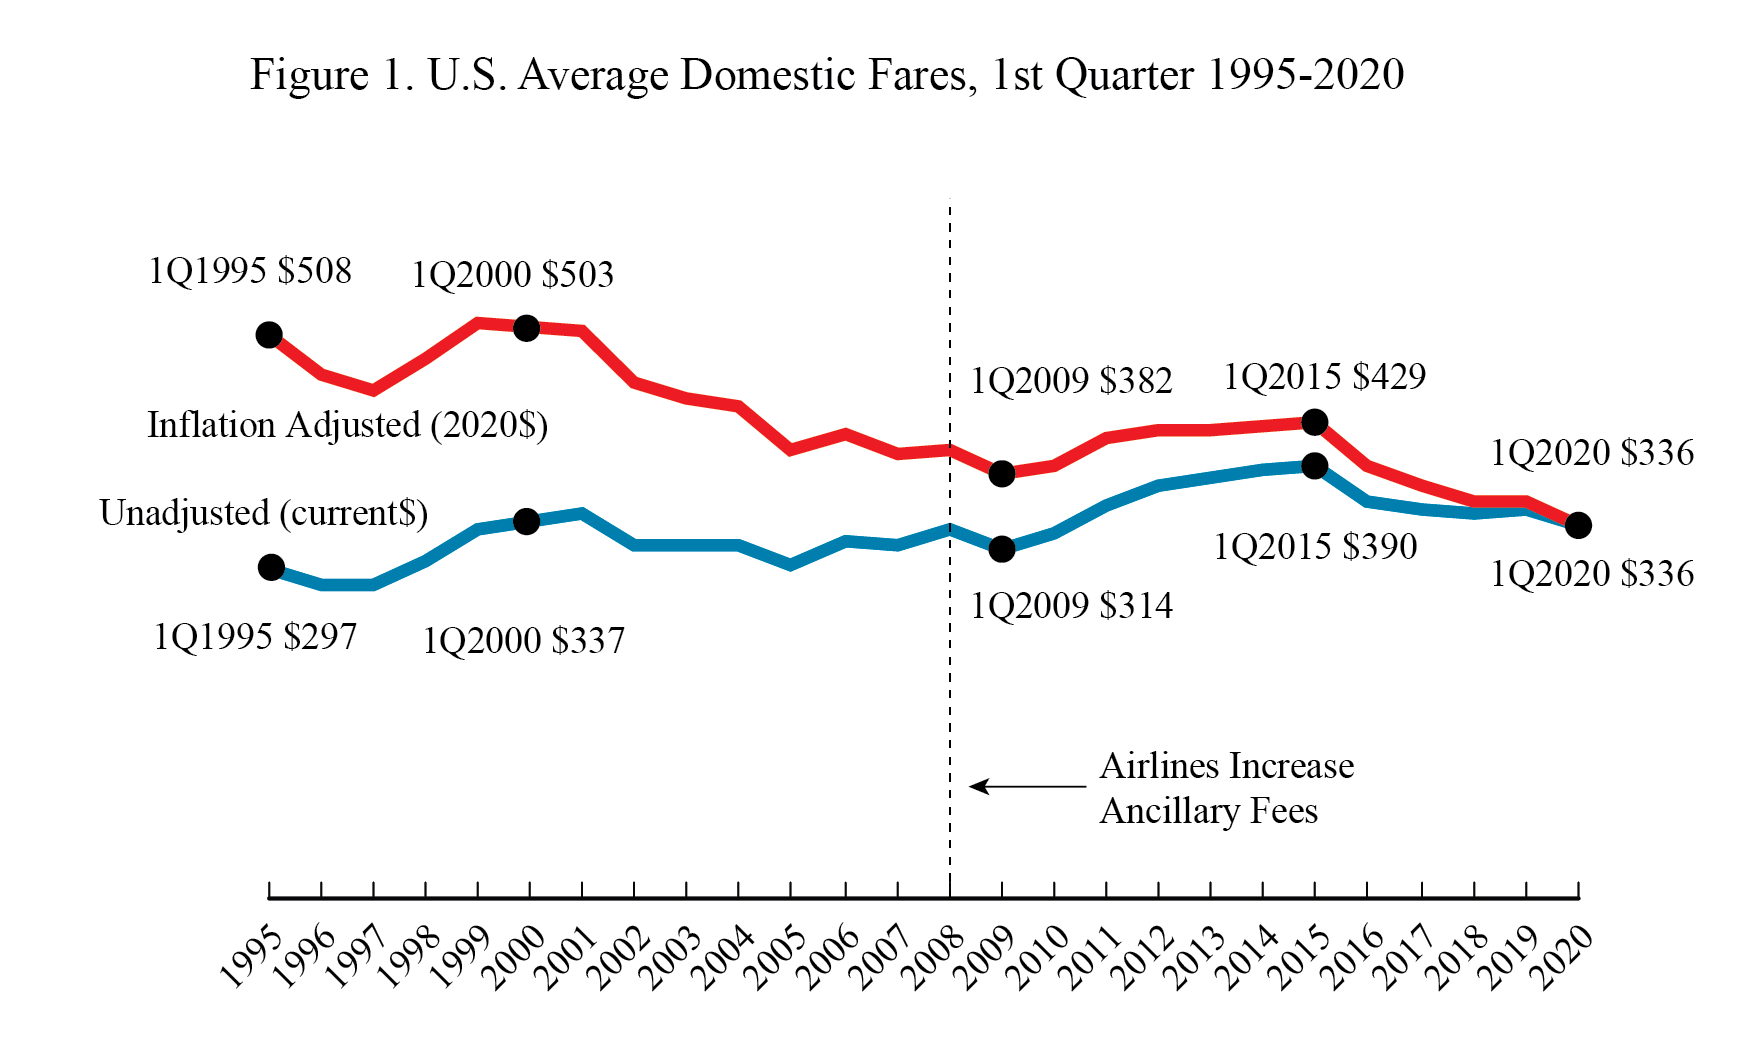
Average Air Fares, 1st Quarter 2020
Released July 21
U.S. domestic average air fares declined in the first quarter of 2020 to $336, the lowest inflation-adjusted quarterly air fare on record in Bureau of Transportation Statistics (BTS) records dating back to 1995. The previous low was $347 in the third quarter of 2019.
-
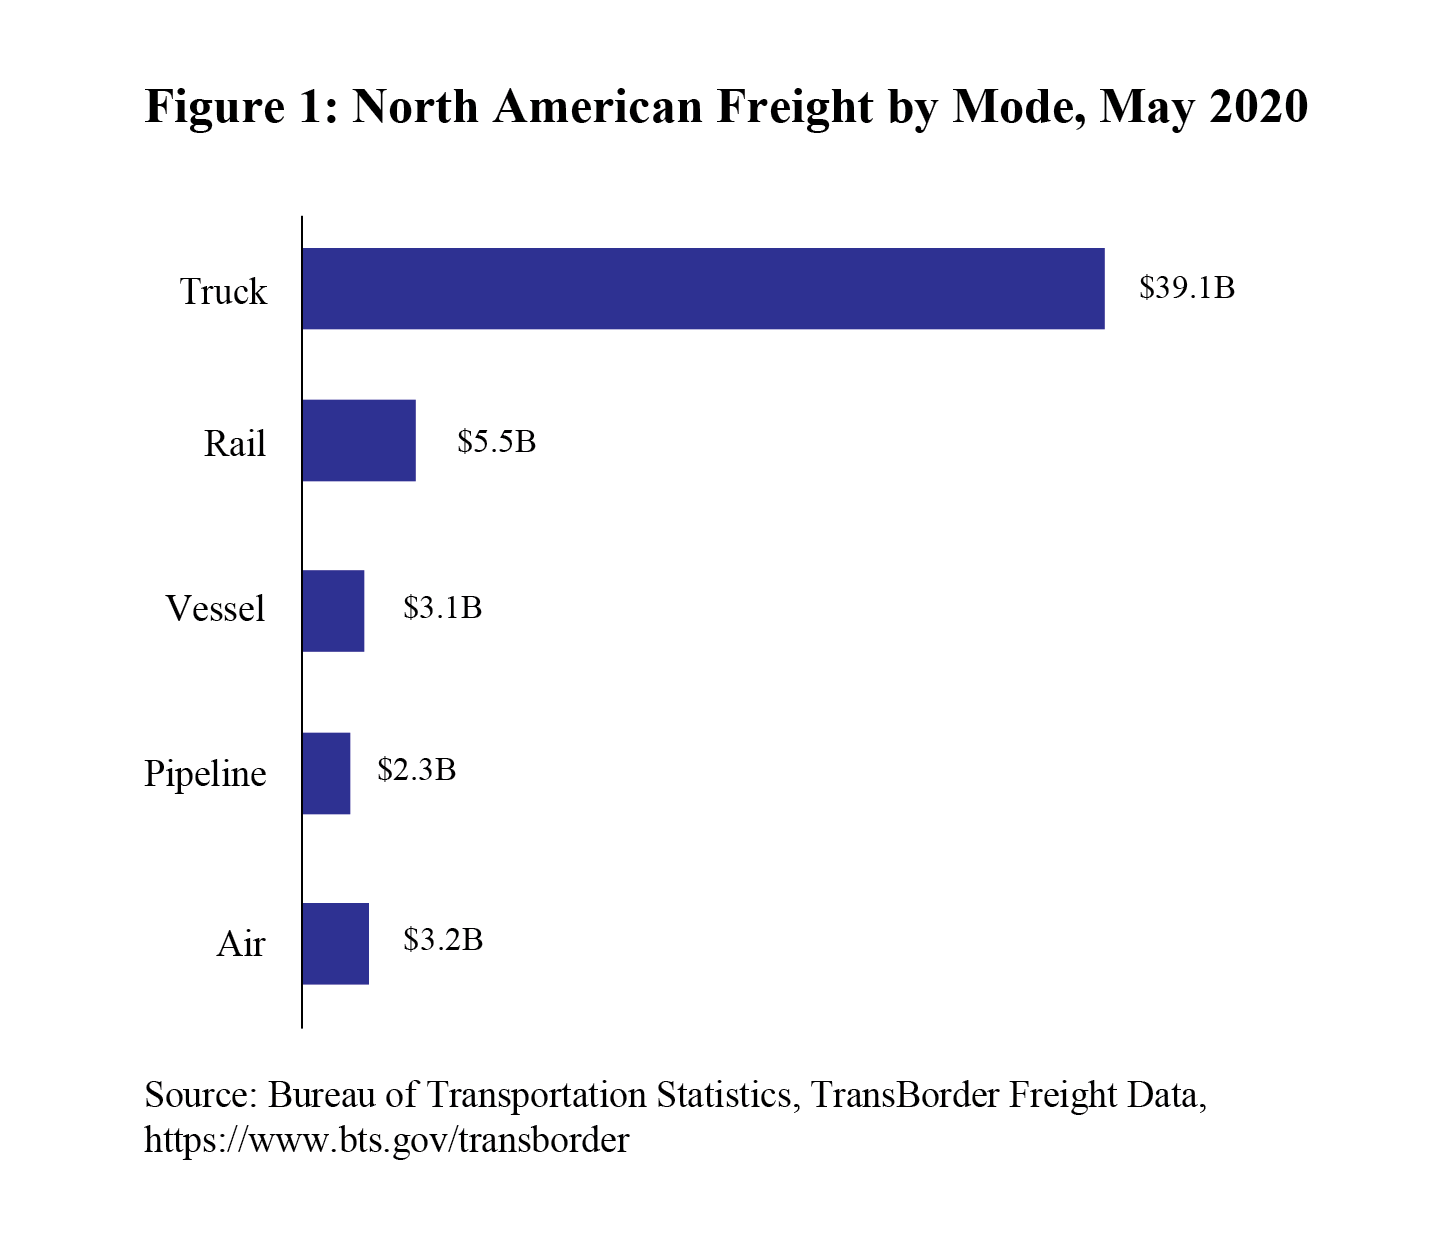
North American Freight Data, May 2020
Released July 22
Freight between the U.S. and other North American countries (Canada and Mexico) in May 2020:
Total Transborder freight: $56.1 billion of transborder freight moved by all modes of transportation, was down 48.9% compared to May 2019. The $56.1 billion in total Transborder freight was the lowest amount since May 2009.
-
Most-used mode: Trucks moved $39.1 billion of freight, down 43.2% compared to May 2019.
-
Second most-used mode: Railways moved $5.5 billion of freight, down 66.3% compared to May 2019.
-
Transborder freight value in May was down 3.5% from April and down 43.3% from March.
-
U.S. Airline Cargo Data (Preliminary), May 2020
Released June 23
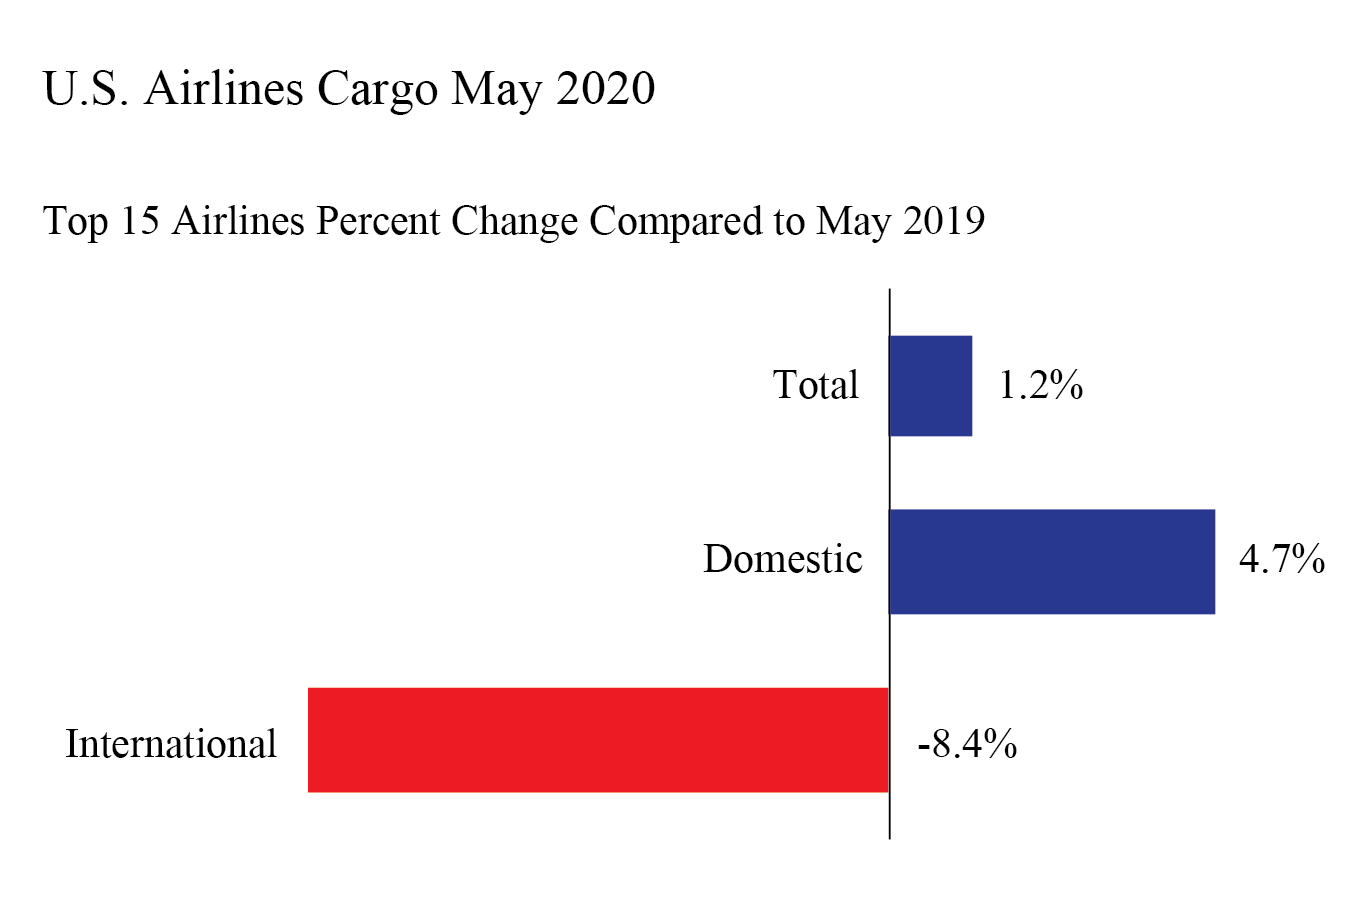
U.S. airlines carried 4.7% more domestic cargo by weight in May 2020 than in May 2019, the largest annual gain since July 2019 while the 8.4% decline in international cargo was the smallest annual loss since February, according to data filed by 15 of the leading cargo airlines. The 15 airlines carry more than 95% of the total cargo by weight on U.S. airlines. Cargo data consists of freight and mail carried within the U.S. and between the U.S. and foreign points.
May 2020 preliminary air cargo numbers for the top 15 U.S. carriers:
-
Total: 1,532 thousand tons, up 1.2% from May 2019 (1,514T tons)
-
Domestic: 1,163 thousand tons, up 4.7% from May 2019 (1,111T tons)
-
International: 403 thousand tons, down 8.4% from May 2019 (369T tons)
-
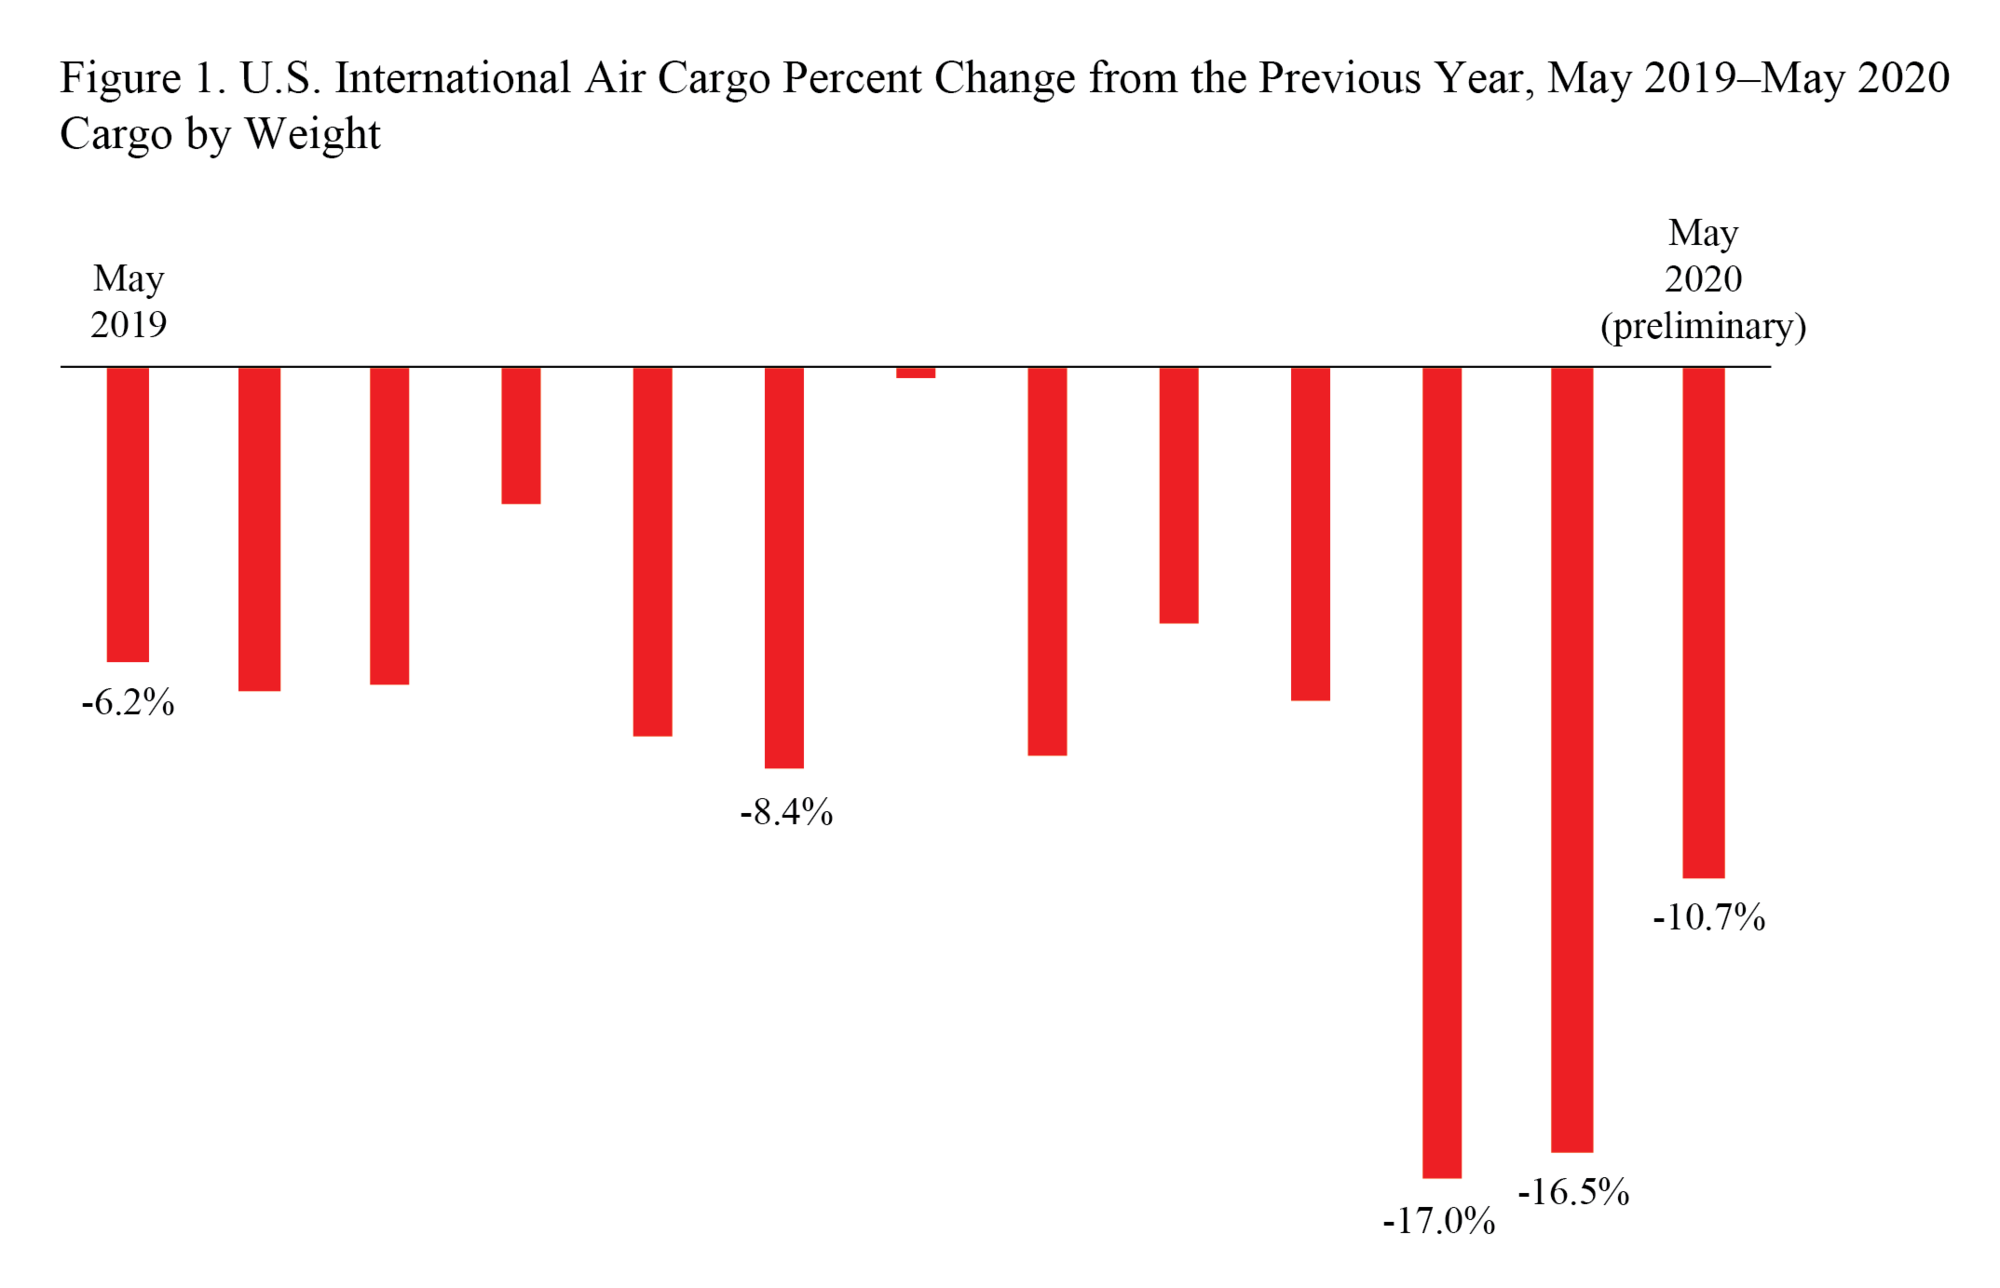
Air Cargo between the U.S. and Foreign Points, May 2020 (Preliminary)
Released July 28
U.S. and foreign airlines carried 11% less cargo by weight between the U.S. and foreign points in May 2020 than in May 2019, including a 40% decline in cargo between the U.S. and Europe. May’s decline was smaller than decreases in March (down 17%) and April (down 16%).
See BTS Release Schedule
BTS Contact: Dave Smallen
202-366-5568