
Air Cargo Down 11% Between the U.S. and Foreign Points, May 2020 (Preliminary)
U.S. Department of Transportation sent this bulletin at 07/28/2020 11:02 AM EDT |
|
Having trouble viewing this email? View it as a Web page.
|
Air Cargo Down 11% Between the U.S. and Foreign Points, May 2020 (Preliminary)
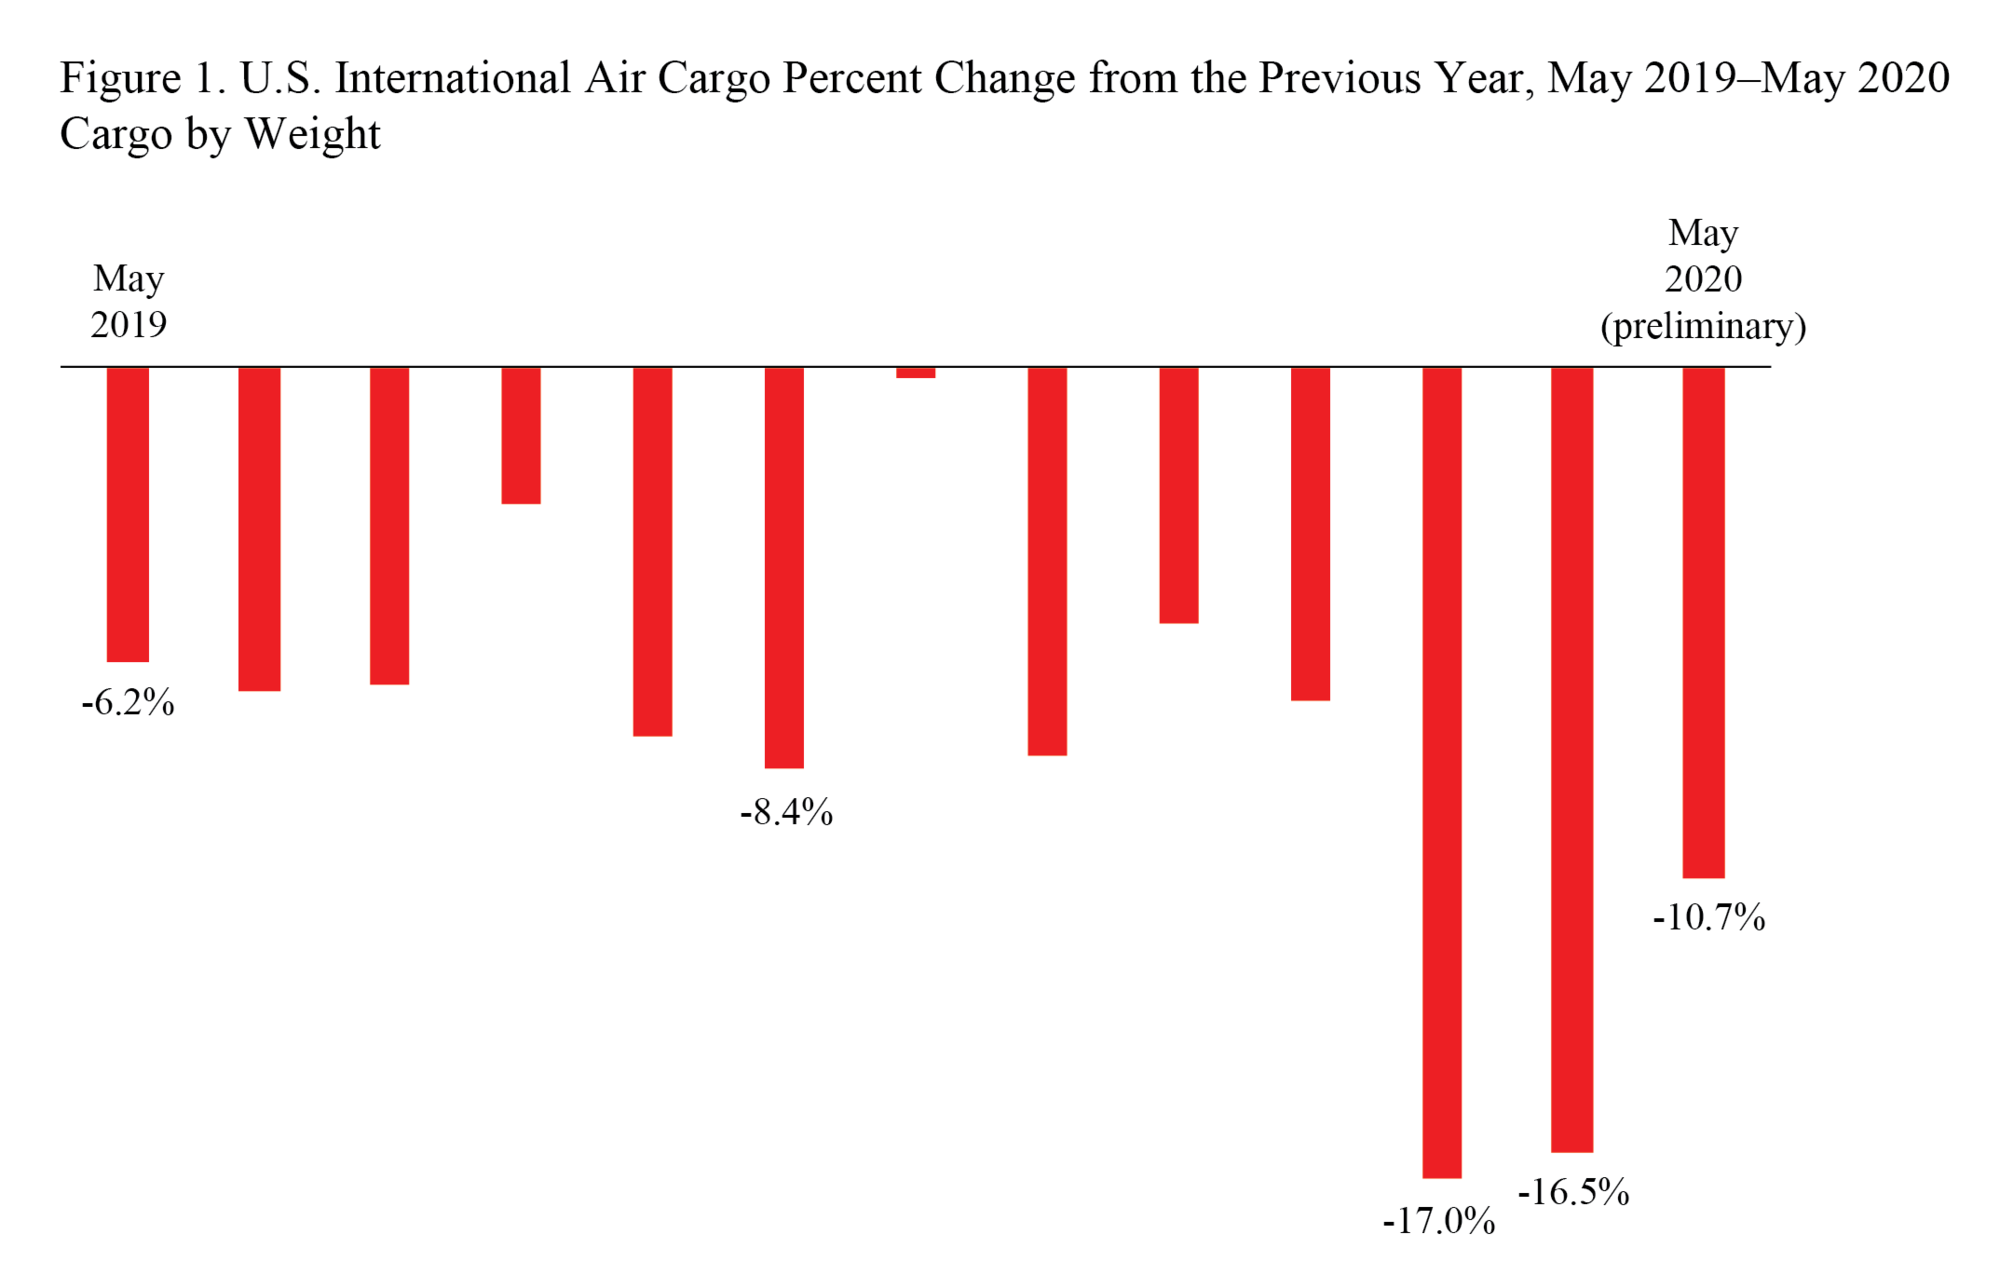
U.S. and foreign airlines carried 11% less cargo by weight between the U.S. and foreign points in May 2020 than in May 2019, including a 40% decline in cargo between the U.S. and Europe, according to data filed with the Bureau of Transportation Statistics (BTS) by large air carriers. May’s decline was smaller than decreases in March (down 17%) and April (down 16%).
May 2020 (preliminary) cargo numbers to and from the U.S. by world geographic areas (by weight):
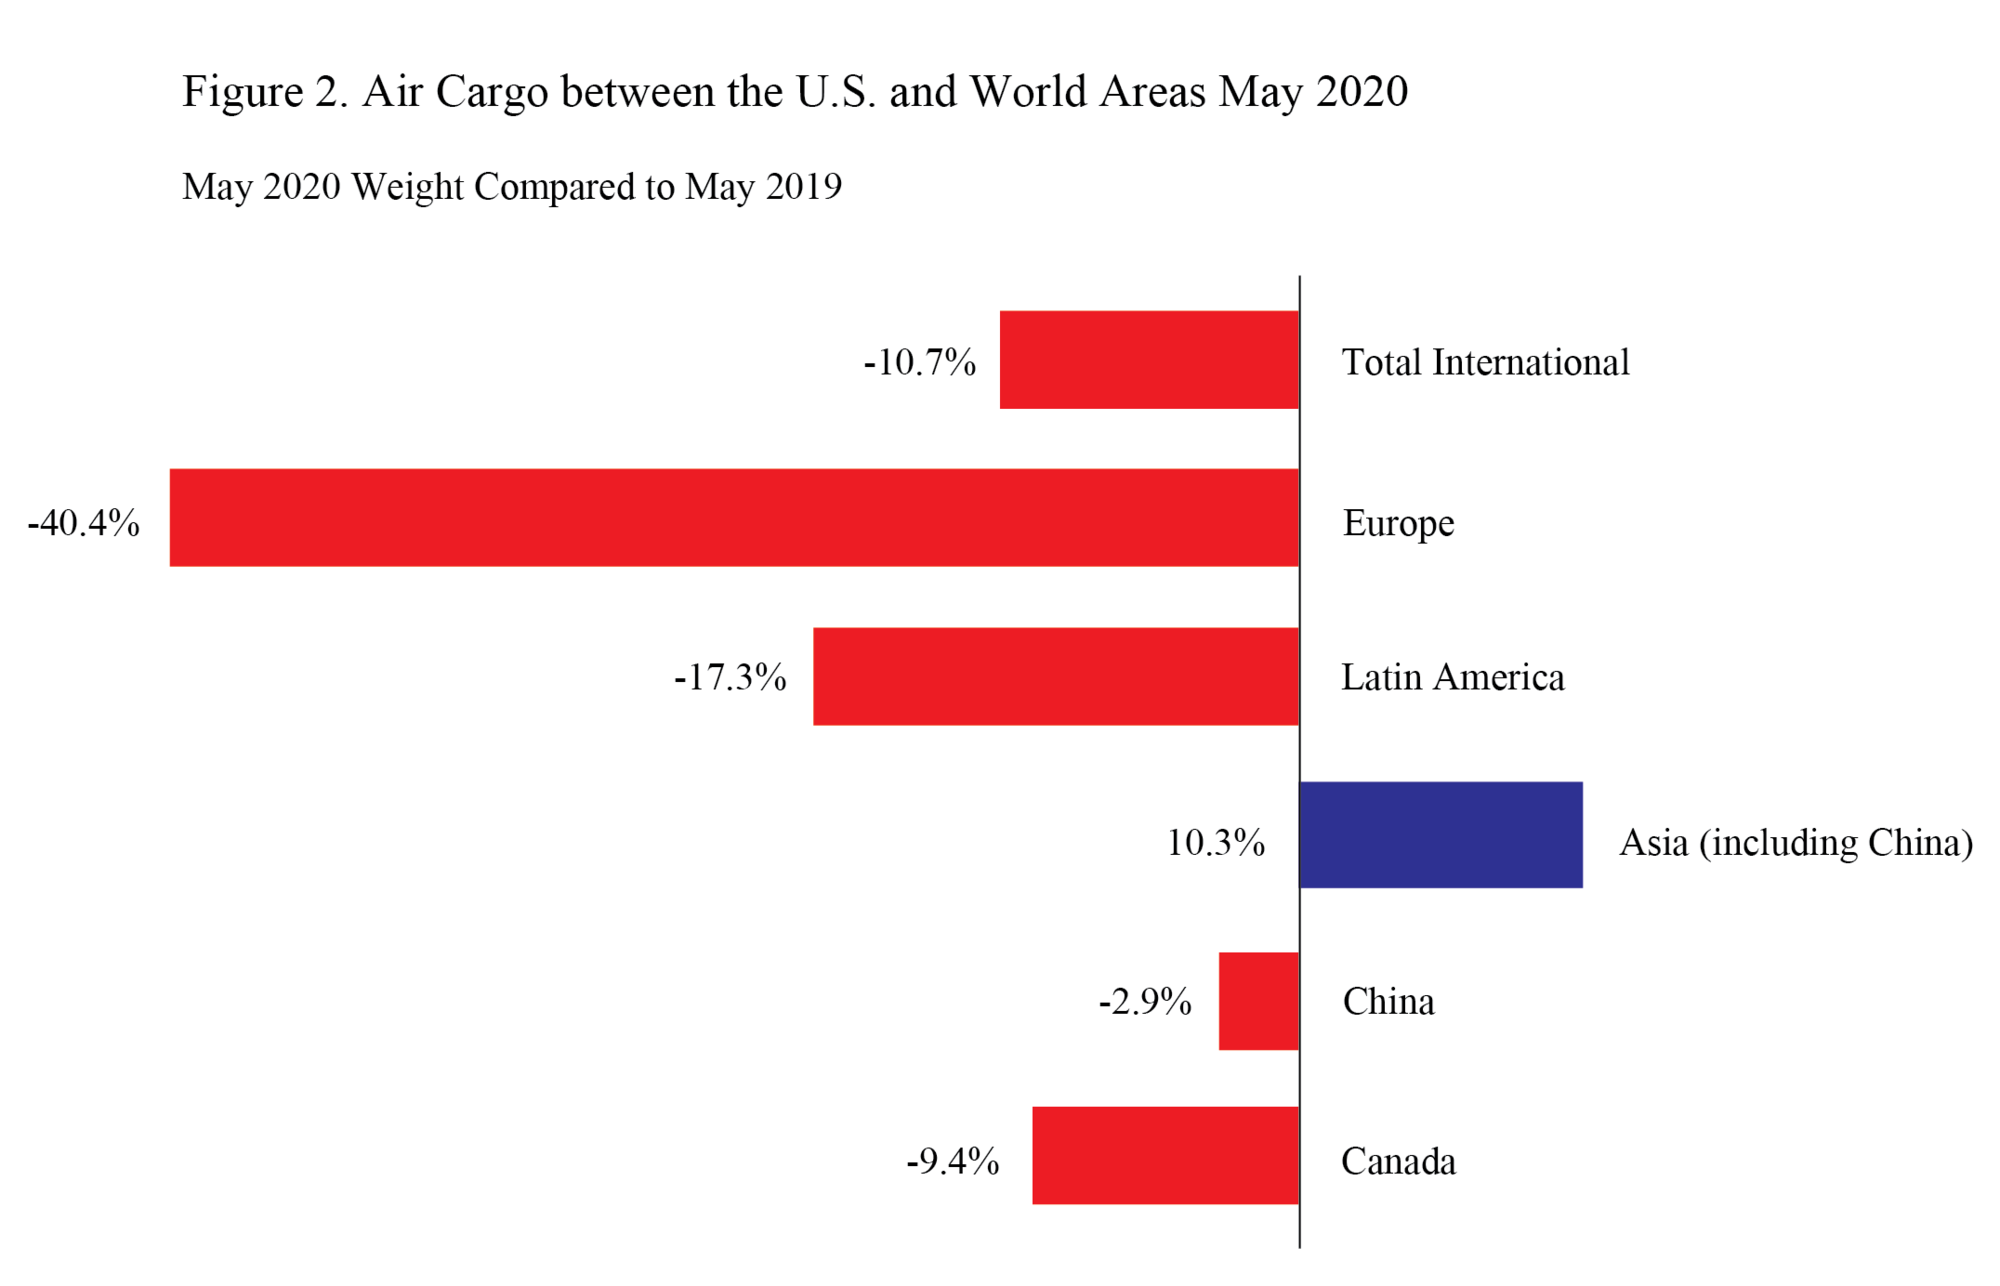
- Total to and from the U.S.: 735 thousand tons, down 10.7% from May 2019 (823T tons)
- Europe: 122 thousand tons, down 40.4% from May 2019 (204T tons)
- Latin America: 90 thousand tons, down 17.3% from May 2019 (109T tons)
- Asia (including China): 392 thousand tons, up 10.3% from May 2019 (356T tons)
- China: 85 thousand tons, down 2.9% from May 2019 (87T tons)
- Canada: 22 thousand tons, down 9.4% from May 2019 (24T tons)
The total to and from the U.S. includes world areas that are not shown separately.
Air cargo reports are filed monthly with BTS. Final May data will be released on Aug. 13. Cargo data in this release are limited to shipments between the U.S. and foreign points. Due to confidentiality requirements, public access to international origin and destination data of U.S. and foreign air carriers is restricted for a period of six months from the data date. Complete international data will be released on Nov. 13. Numbers in this release are based on world area codes.
Total Air Cargo to and from the U.S.
The 10.7% decline (preliminary) between May 2019 and May 2020 in the weight of cargo carried on U.S. and foreign airlines between the U.S. and foreign points was driven by annual declines in cargo with Europe (down 40.4%), Latin America (down 17.3%) and Canada (down 9.4%). These declines offset the year-to-year rise in cargo with Asia (up 10.3%), the region with most U.S.-based cargo. The Asian cargo increases took place outside of China where there was a 2.9% decline in cargo with the U.S. The May annual decrease was larger than any of the 19 consecutive annual decreases since November 2018 except for March 2020 (down 17.0%) and April 2020 (down 16.5%).
Table 1: Total Cargo to and from the U.S.: Percent Change from the Same Month of the Previous Year 2016-2020
Change in Weight of Cargo on U.S. and Foreign Airlines
Cargo = Freight + Mail
|
Year-to-Year Percent Change |
||||
|
|
2016-2017 |
2017-2018 |
2018-2019 |
2019-2020 |
|
January |
8.5 |
13.8 |
-2.2 |
-5.4 |
|
February |
8.0 |
13.6 |
-5.4 |
-7.0 |
|
March |
10.2 |
11.6 |
-1.9 |
-17.0 |
|
April |
7.1 |
11.6 |
-8.2 |
-16.5 |
|
May |
12.5 |
11.3 |
-6.2 |
-10.7* |
|
June |
12.1 |
8.6 |
-6.8 |
|
|
July |
13.5 |
3.2 |
-6.6 |
|
|
August |
13.6 |
5.1 |
-2.9 |
|
|
September |
10.0 |
5.7 |
-7.7 |
|
|
October |
12.2 |
2.0 |
-8.4 |
|
|
November |
17.9 |
-9.4 |
-0.2 |
|
|
December |
14.1 |
-1.7 |
-8.1 |
|
|
Annual |
11.8 |
5.7 |
-5.4 |
|
Source: Bureau of Transportation Statistics, T-100 International Market (All Carriers)
* May 2020 data is preliminary
See the tables that accompany this release on the BTS website for year-to-year changes since 2017 for Europe, Latin America, Asia (including China), China and Canada.
Europe
U.S.-Europe cargo declined 40.4% (preliminary) from May 2019 following annual declines of 42.9% in April and 25.2% in March. These were the largest year-to-year declines in the 16 consecutive decreases since February 2019.
Latin America
Cargo with Latin America declined 17.3% in May (preliminary) following a smaller 4.7% annual decline in April. The March annual decline was 17.6%
Asia (including China)
The May annual increase of 10.3% (preliminary) of cargo with Asia (including China) was the second consecutive rise following seven consecutive year-to-year declines. It was the largest year-to-year increase since April 2018. Asia cargo comprised 53% of total U.S. international air cargo in May.
China
The 2.9% decline in U.S.-China air cargo shipments from May 2019 to May 2020, would be the 17th consecutive year-to-year decline but the smallest decrease since April 2019. During May 2020, 84.2% of the freight was flown from China to the U.S. while 15.8% was carried from the U.S. to China.
Canada
The 9.4% (preliminary) year-to-year decline in the weight of cargo carried on U.S. and foreign airlines between the U.S. and Canada was fourth consecutive year-to-year decrease. The decrease followed five consecutive monthly increases. During May 2020, 43.0% of the cargo was flown from Canada to the U.S. while 57.0% was carried from the U.S. to Canada.
Reporting Notes
Data are compiled from monthly reports filed with BTS by commercial U.S. air carriers detailing operations, passenger traffic and cargo traffic. This release includes data received by BTS from 33 U.S. and foreign airlines as of July 20.
See the BTS Airlines and Airports page for additional U.S. airlines numbers through April for U.S. airlines. International data by origin and destination is available through January.
None of the data are from samples. Measures of statistical significance do not apply to the complete air traffic data.
|
You are subscribed to DOT email updates. Subscriber Services: Manage Preferences |
|
||||||||||||
