
First Quarter 2020 Air Fare Drops to New Low
U.S. Department of Transportation sent this bulletin at 07/21/2020 11:08 AM EDT |
|
Having trouble viewing this email? View it as a Web page.
|
First Quarter 2020 Air Fare Drops to New Low
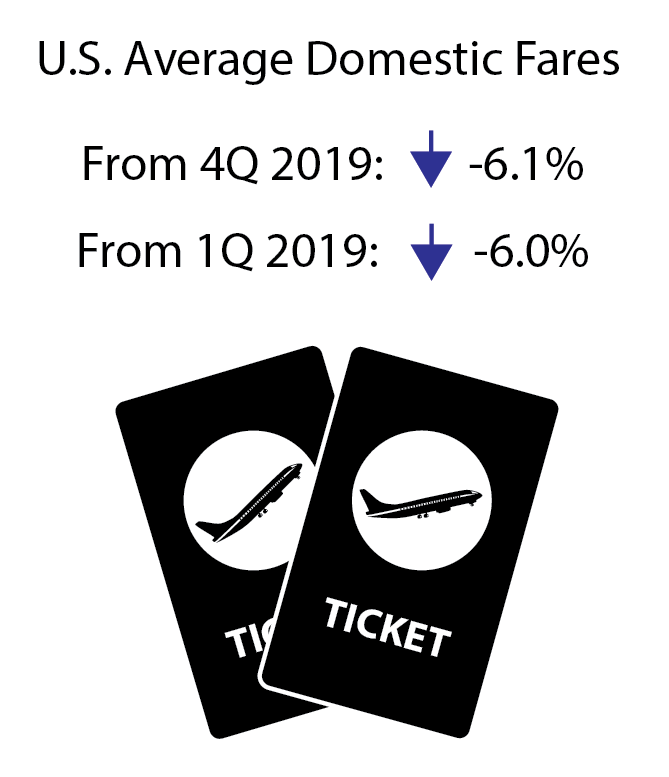
U.S. domestic average air fares declined in the first quarter of 2020 to $336, the lowest inflation-adjusted quarterly air fare on record in Bureau of Transportation Statistics (BTS) records dating back to 1995. The previous low was $347 in the third quarter of 2019.
Adjusted for inflation, (constant 2020 dollars) the first-quarter 2020 air fare was:
- Down 6.0% from 1Q 2019 ($358)
- Down 6.1% from 4Q 2019 ($358)
- Down 21.6% from 1Q 2015 ($429)
Percent change based on unrounded numbers. COVID-19 effects on numbers of passengers and flights did not begin until the latter part of the January-March reporting period.
Source: Bureau of Transportation Statistics, BTS Air Fares, Origin and Destination Survey
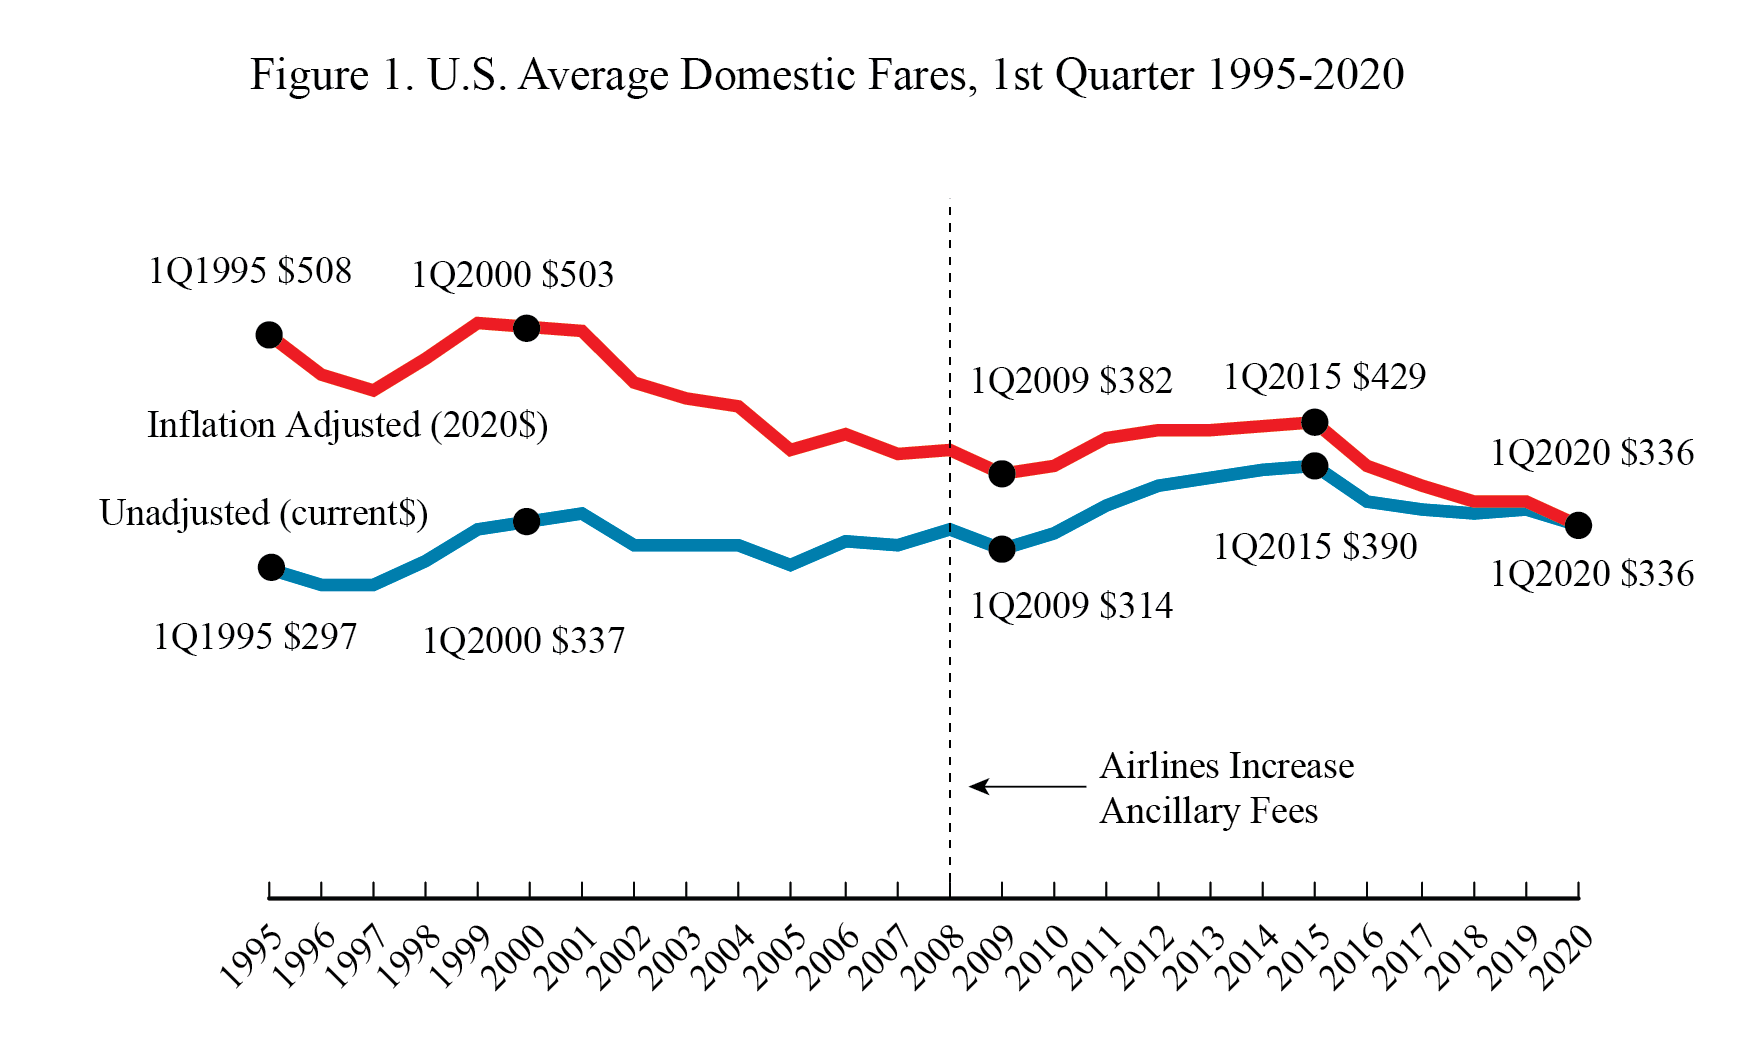
Other Revenue: In recent years, airlines increasingly obtain additional revenue from passenger fees, as well as from other sources. U.S. passenger airlines collected 71.3% of total operating revenue of $26.6 billion from passenger fares during the first three months of 2020, down from 88.5% in 1990.
Fares by Airport
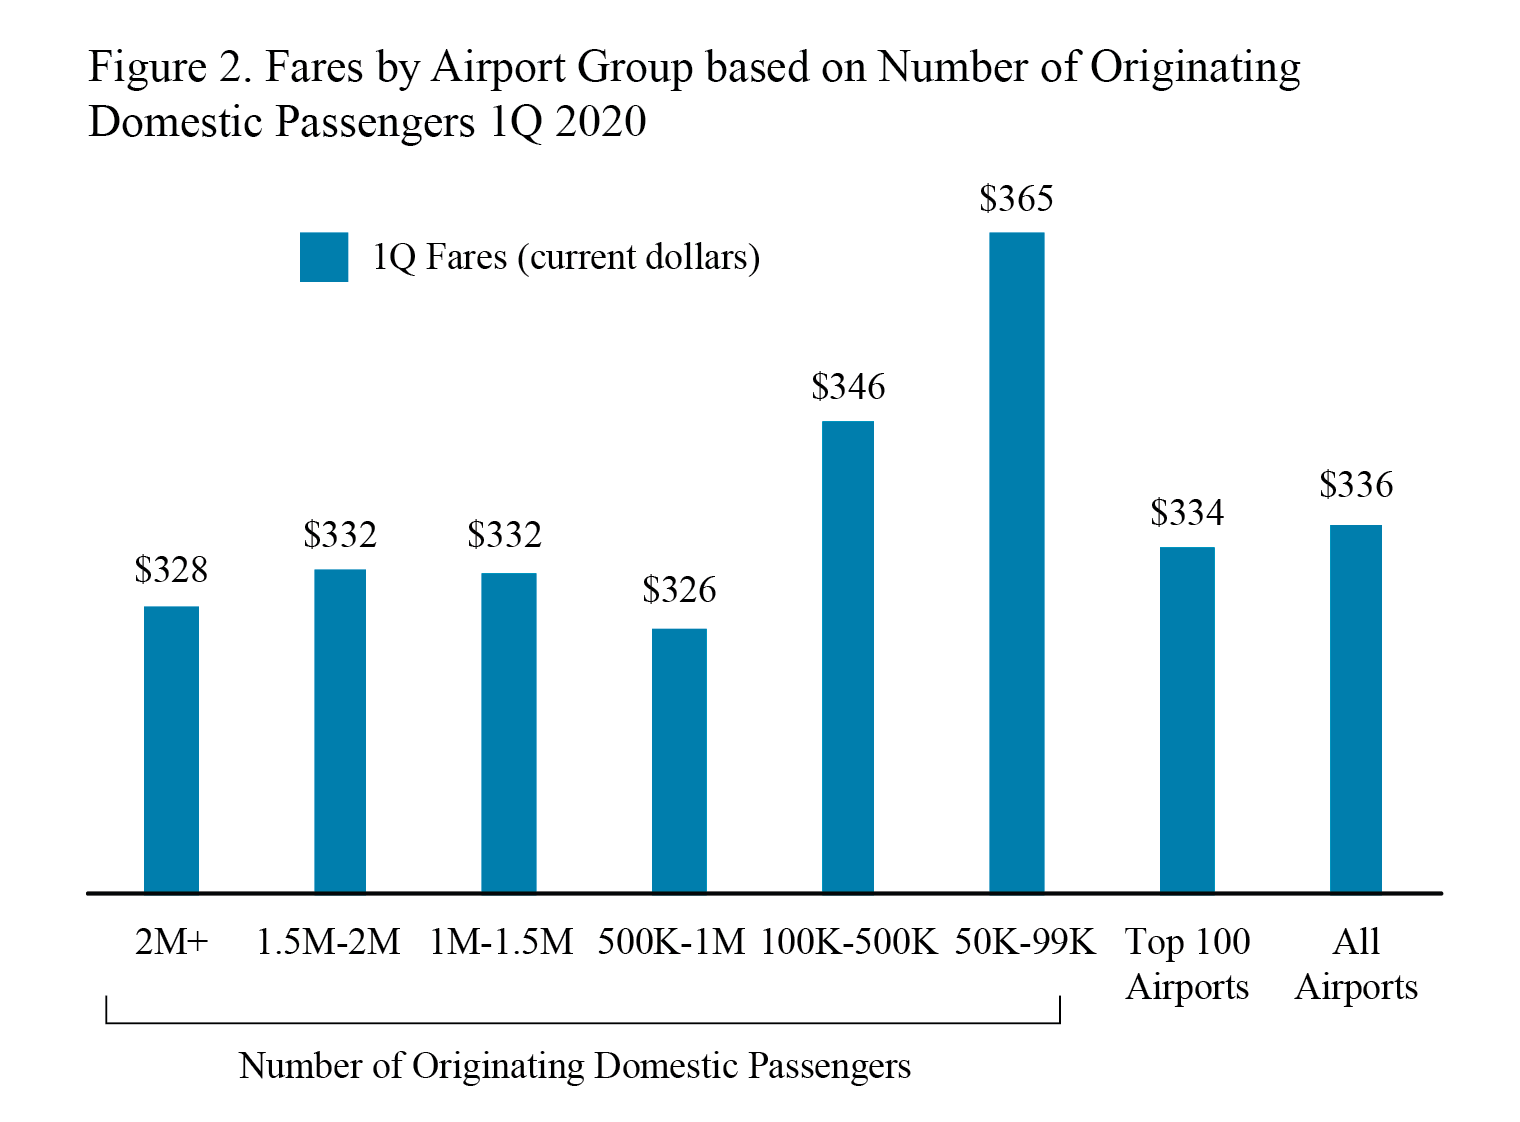
Source: Bureau of Transportation Statistics, BTS Air Fares, Origin and Destination Survey
Additional data: see Top 100 Airports or All Airports. Second Quarter 2020 average fare data will be released Oct. 20.
Standard error: Results for average fares are based on the BTS Origin & Destination Survey, a 10% sample of airline tickets used during the quarter. Averages for airports with smaller samples may be less reliable.
Note: Results for average fares (actual and inflation-adjusted) are based on the BTS Origin & Destination Survey, a 10% sample of airline tickets used during the quarter. For Q1 2020 results based on all itinerary fares, the standard error is 0.32 and the median fare is $274.36. The 90% confidence interval ranges from $335.60 to $336.65. For results based on round-trip fares, the standard error is 0.43 and the median fare is $343.62. The 90% confidence interval ranges from $402.67 to $404.07. For results based on one-way fares, the standard error is 0.39 and the median fare is $187.85. The 90% confidence interval ranges from $244.28 to $245.58.
|
You are subscribed to DOT email updates. Subscriber Services: Manage Preferences |
|
||||||||||||
