BTS 2-Week Outlook
Bureau of Transportation Statistics Upcoming Releases
June 22-July 3
Upcoming from June 22
Tuesday, June 23, 2020 - 11:00am ET
International Air Cargo, April 2020 (Preliminary)
Wednesday, June 24, 2020 - 11:00am ET
North American Freight Data, April 2020
TBD
Airline On-Time/Tarmac Data, April 2020
Previously Released
June 10 -Transportation Services Index, April 2020
June 10 - U.S. Airline Traffic Data, April 2020 (Preliminary)
June 10 - Airline Full-Time/Part-Time Employment, April 2020
June 11 - Airline Traffic Data, March 2020 (Final)
June 15 - Airline Financial Data, 1st Quarter 2020
June 17 - U.S. Airlines Cargo Data, April 2020 (Preliminary)
June 18 - Passenger Airline Employment, April 2020
The Bureau of Transportation Statistics will release the following data sets in the next two weeks:
-
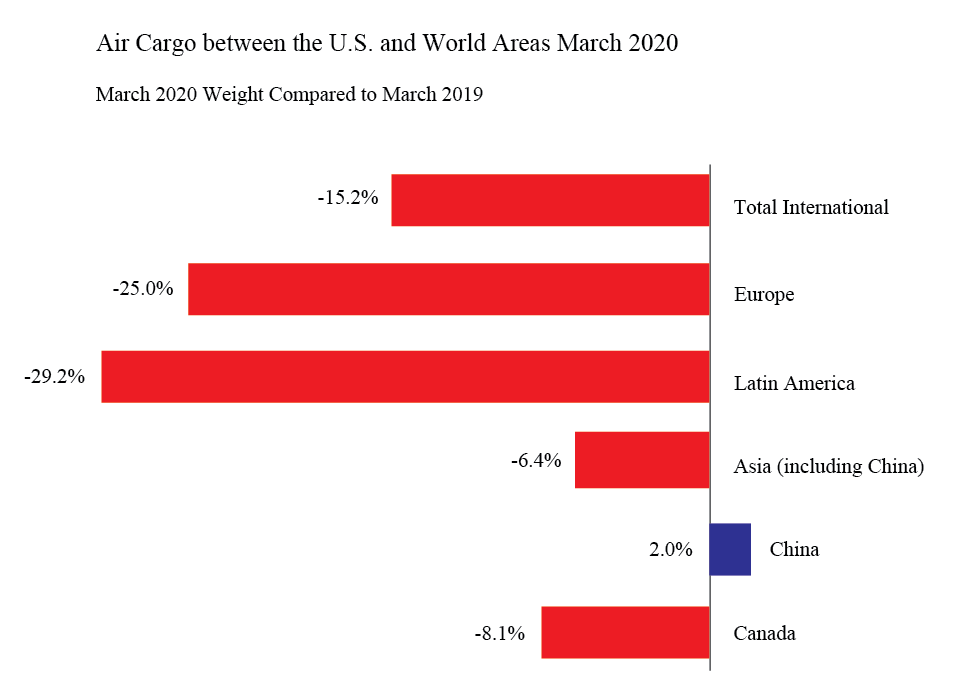
International Air Cargo, April 2020 (Preliminary)
Tuesday, June 23, 2020 - 11:00am ET
The release provides the year-to-year percent change by month from 2016 through April 2020 in the total weight of air cargo between the U.S. and foreign points. It also shows the percent change for cargo between the U.S. and the different regions of the world – Europe, Latin America, Asia. Finally, it shows the percent change in cargo between the U.S. and China and he U.S. and Canada. From the previous release, airlines carried 15% less cargo by weight between the U.S. and foreign points in March 2020 than in March 2019.
-
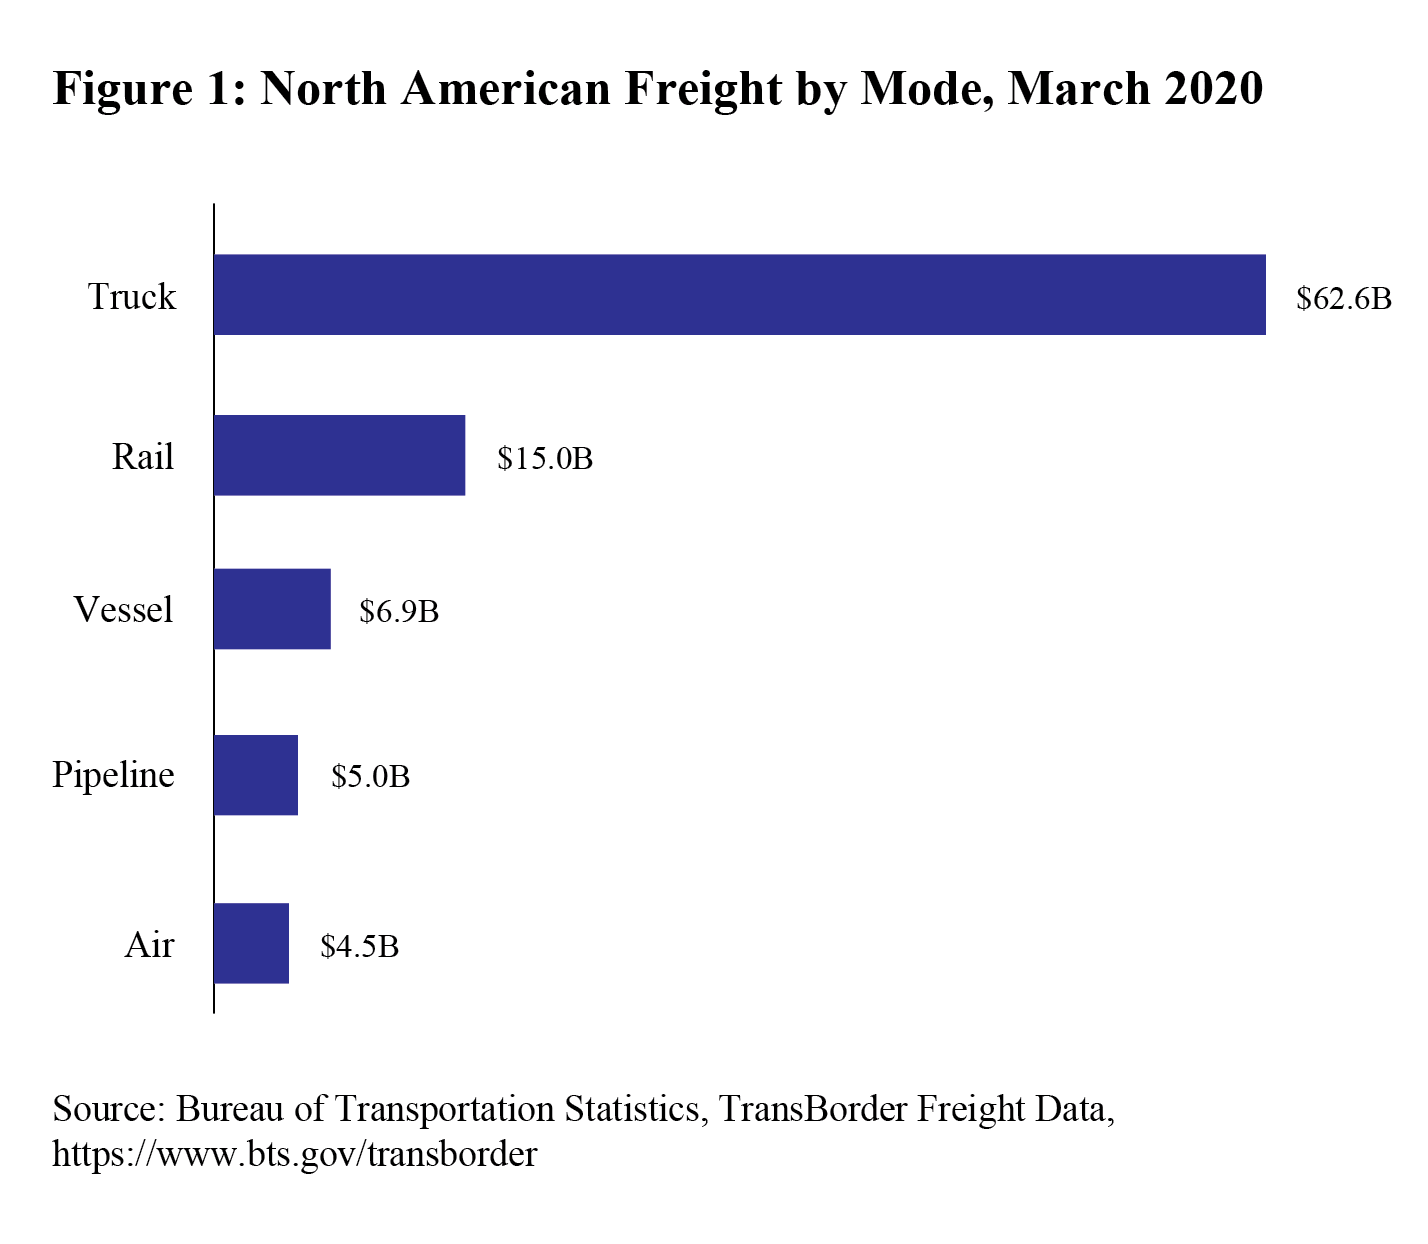
North American Transborder Freight Data, April 2020
Wednesday, June 24, 2020 - 11:00am ET
The release summarizes the monthly value of freight transported by truck, rail and other modes between the U.S. and Canada and the U.S. and Mexico with the top states, ports and commodities. Previously, BTS reported that the value of total Transborder freight in March 2020 was $99 billion, down 7.9% compared to March 2019. Truck moved $63 billion or 63% and rail moved $15 billion or 15%.
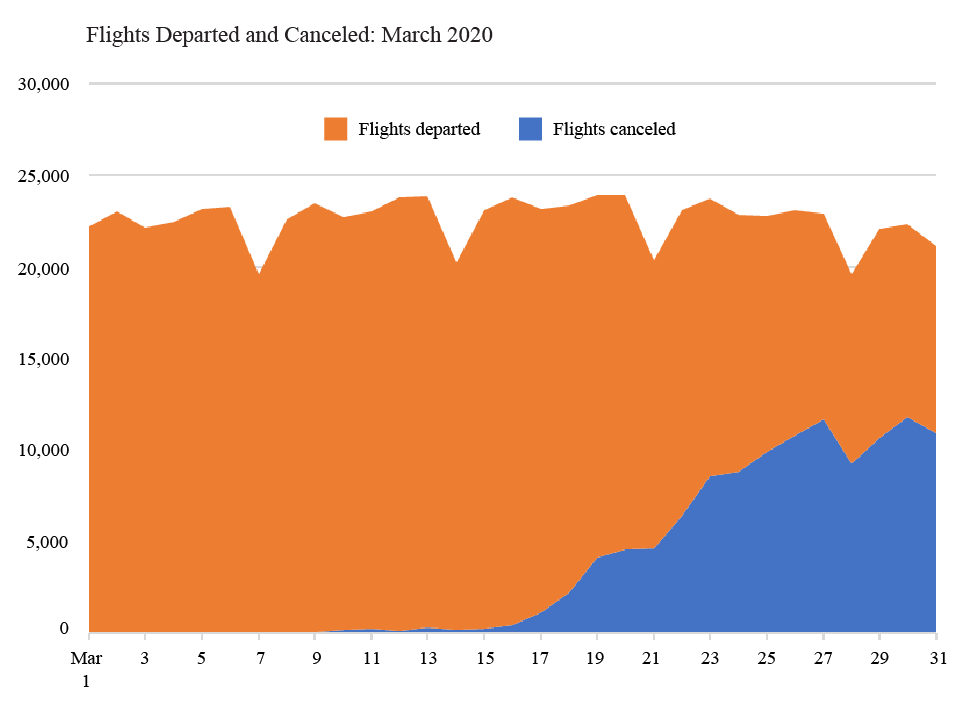
- Air Travel Consumer Report: April 2020 Numbers
Date TBD
This release consists on U.S. airline domestic monthly on-time performance, cancellations, tarmac data, mishandled baggage released in coordination with the Department of Transportation’s release of the Air Travel Consumer Report. From the previous month’s release, in March 2020, reporting marketing carriers posted an on-time arrival rate of 74.7%, down from both the 83.8% on-time rate in February 2020 and from 80.9% in March 2019. Reporting marketing carriers canceled 16.9% of their scheduled domestic flights, a higher rate than both 1.0% in February 2020 and 2.0% in March 2019. The marketing carriers include branded code-share partners of mainline carriers.
BTS Previously
BTS has released the following:
-
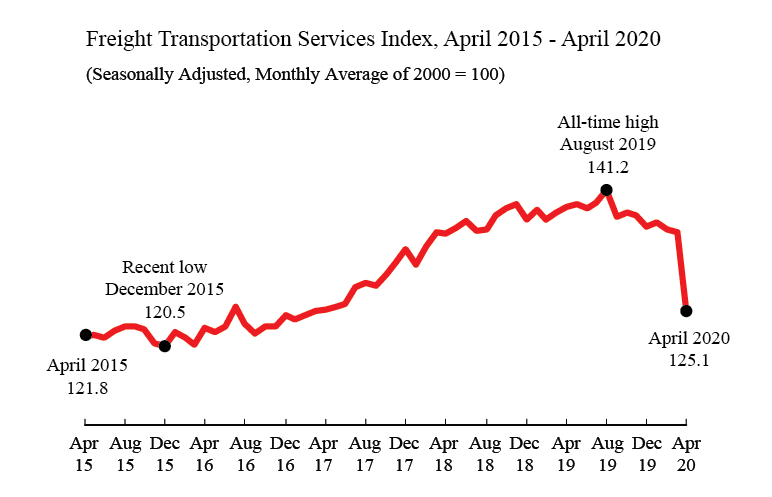
Freight Transportation Services Index (TSI), April 2020
Released June 10
The Freight Transportation Services Index (TSI), which is based on the amount of freight carried by the for-hire transportation industry, fell 7.7% in April from March, falling for the third consecutive month. From April 2019 to April 2020, the index fell 10.0% compared to a rise of 2.7% from April 2018 to April 2019 and a rise of 8.0% from April 2017 to April 2018.
-
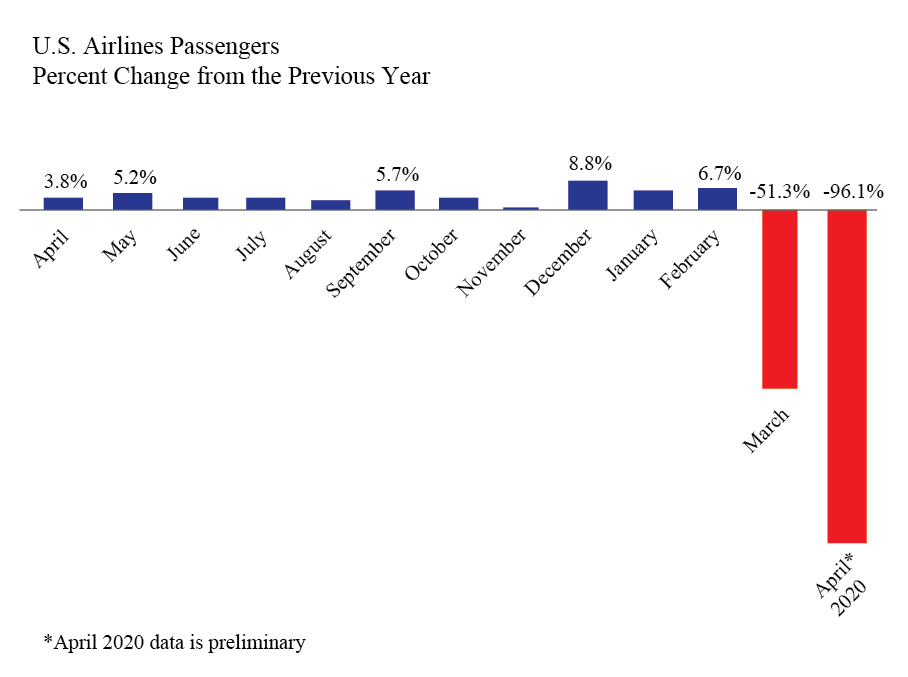
U.S. Airline Passengers, April 2020 (Preliminary)
Released June 10
U.S. airlines carried 96% fewer scheduled service passengers in April 2020 than in April 2019, according to preliminary data.
April 2020 passenger numbers for 24 carriers with the most passengers:
-
Total: 3.0 million passengers, down 96% from April 2019 (76.1M)
-
Domestic: 2.8 million passengers, down 96% from April 2019 (66.7M)
-
International: 132 thousand passengers, down 99% from April 2019 (9.4M)
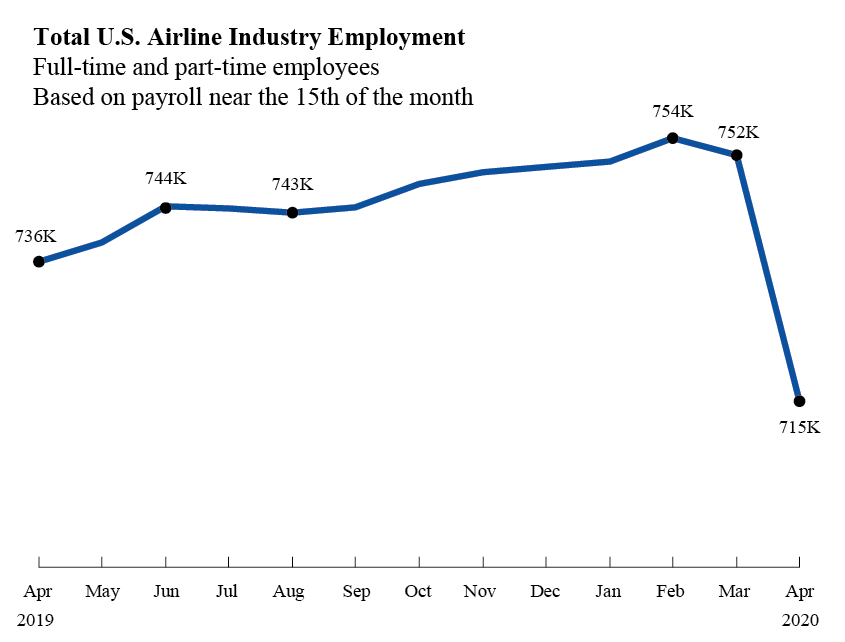
- Airline Industry Full-Time/Part-Time Employment, April 2020
Released June 10
US airlines employed 715,017 workers in the middle of April 2020, almost 37,000 fewer than in mid-March 2020 and almost 21,000 fewer than in April 2019. The April 2020 numbers consist of 604,551 full-time and 110,466 part-time workers. Regulations require airlines to report employment numbers for a pay period near the 15th of the month. Monthly full-time and part-time employment statistics are reported by U.S. airlines that operate at least one aircraft that has more than 60 seats or the capacity to carry a payload of passengers, cargo and fuel weighing more than 18,000 pounds
-
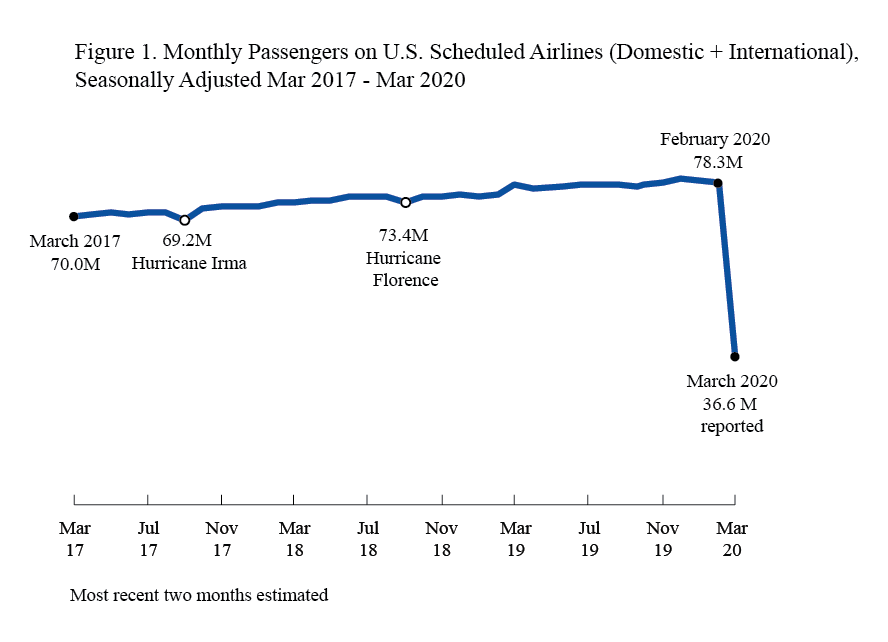
Airline Traffic Data, March 2020 final
Released June 11
U.S. airlines carried 36.6 million systemwide (domestic and international) scheduled service passengers in March 2020, seasonally-adjusted, down 53% from February. There were 32.3 million domestic passengers and 4.4 million international passengers on U.S. airlines flights, seasonally-adjusted.
-
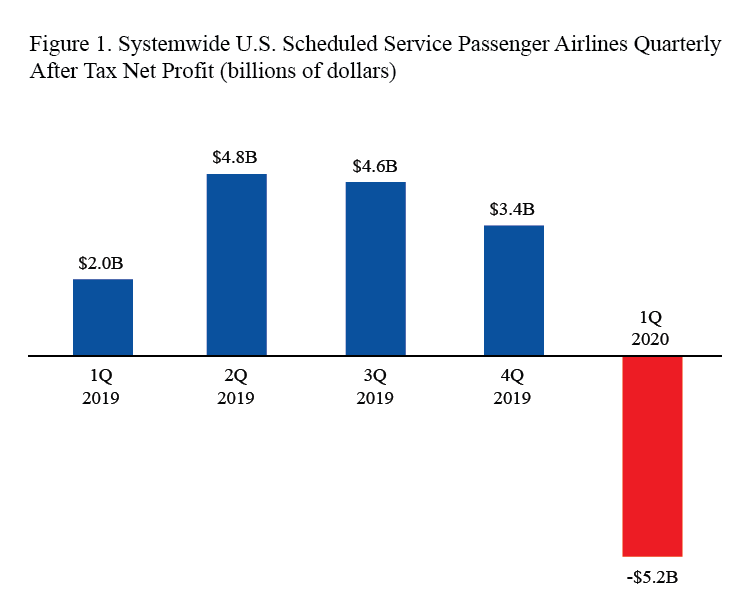
U.S. Airline Financial Data, First Quarter 2020
Released June 15
U.S. scheduled passenger airlines reported a first-quarter 2020 after-tax net loss of $5.2 billion and a pre-tax operating loss of $4.6 billion. The first-quarter losses follow 27 consecutive quarterly after-tax net profits and 35 consecutive quarterly pre-tax operating profits. Additional financial numbers for all airlines are available on the BTS financial databases.
-
U.S. Airline Cargo Data (Preliminary), April 2020
Released June 17
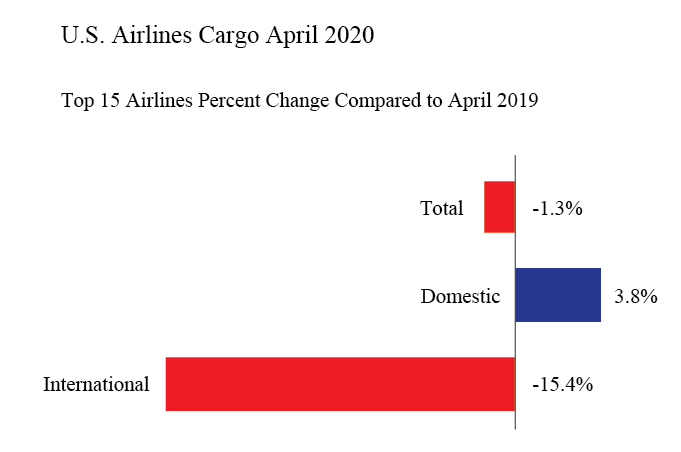
U.S. airlines carried 1.3% less cargo by weight in April 2020 than in April 2019, data filed by 15 of the leading cargo airlines. The 15 airlines carry more than 95% of the total cargo by weight on U.S. airlines. Cargo data consists of freight and mail carried within the U.S. and between the U.S. and foreign points.
April 2020 cargo numbers for the 15 carriers:
-
Total: 1,409 thousand tons, down 1.3% from April 2019 (1,429T tons)
-
Domestic: 1,086 thousand tons, up 3.8% from April 2019 (1,046T tons)
-
International: 324 thousand tons, down 15.4% from April 2019 (383T tons)
-
Passenger Airline Employment, April 2020
Released June 18
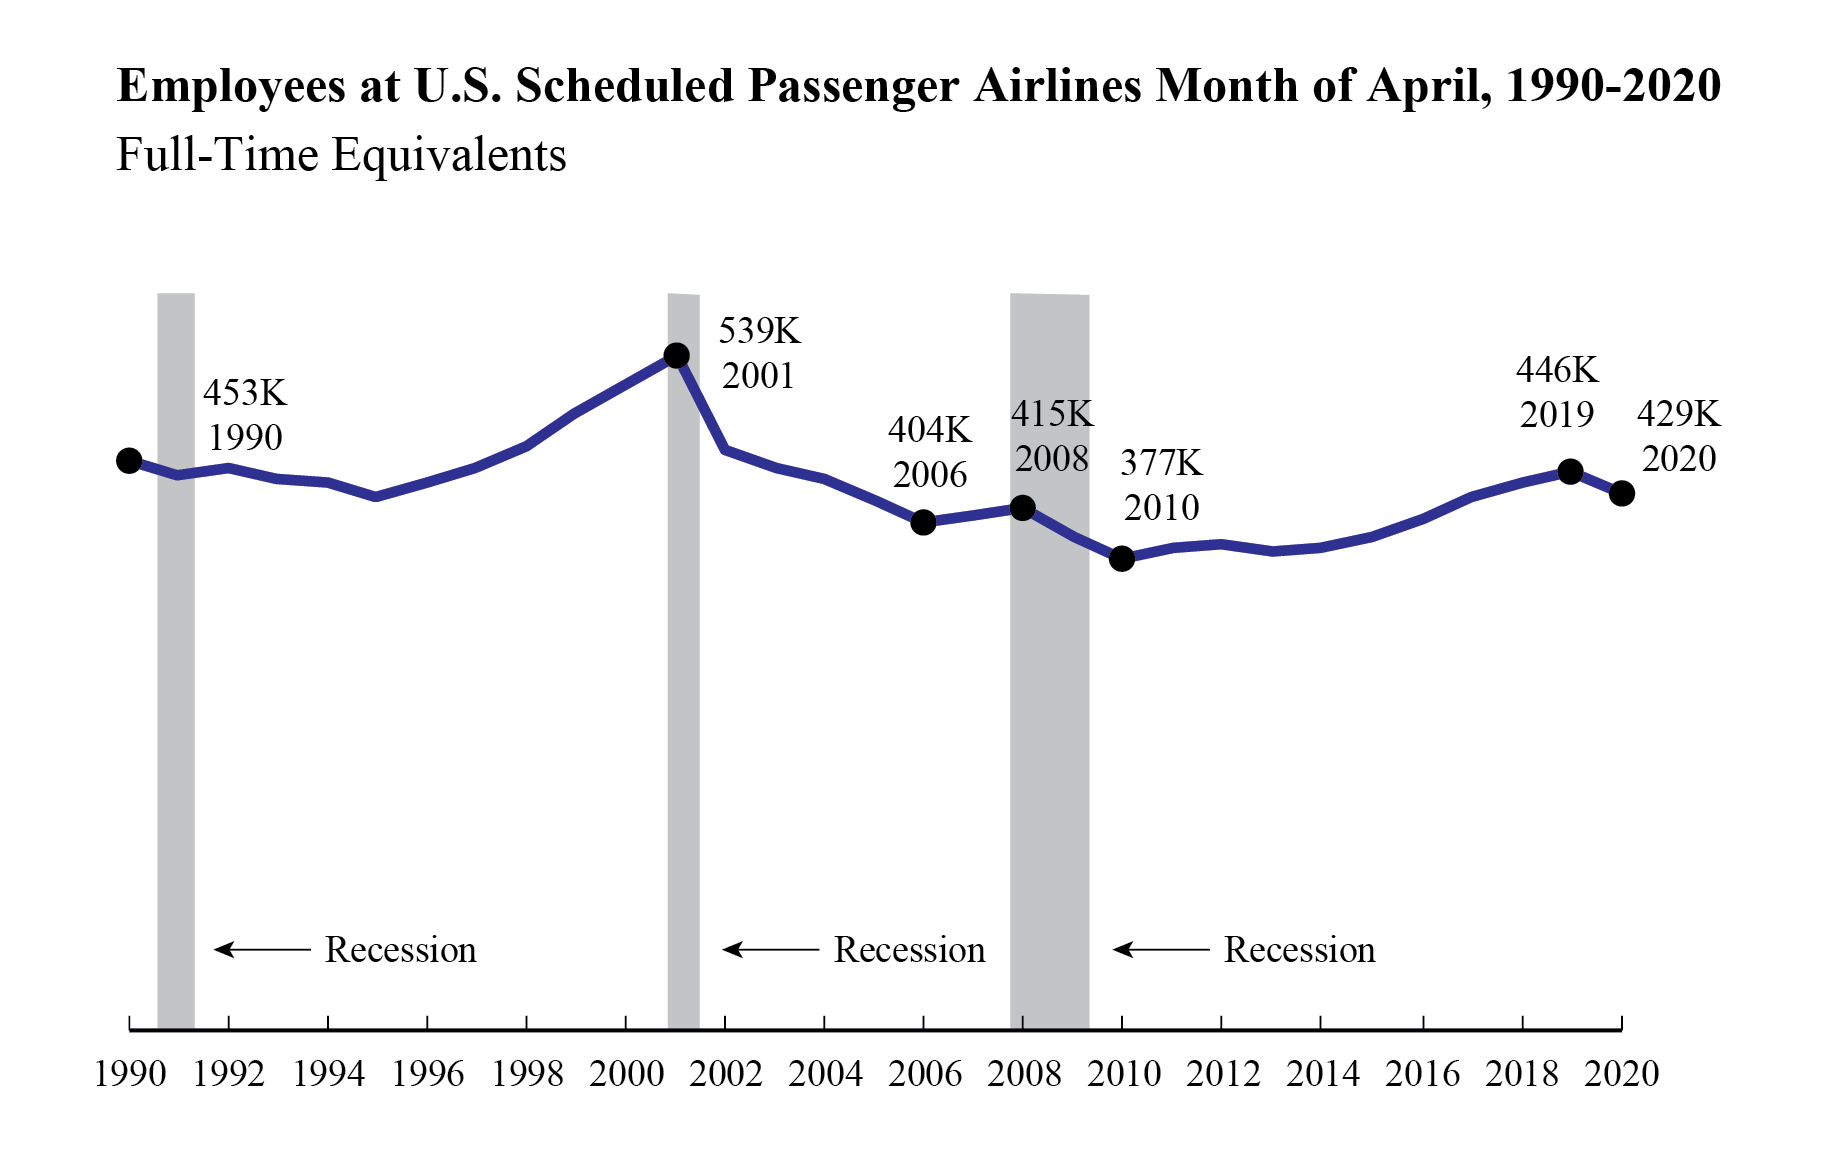
BTS reported that 23 U.S. scheduled passenger airlines employed 6.7% fewer workers in mid-April 2020 than in mid-March 2020.
-
Mid-April’s total number of FTEs (428,569) was down almost 31,000 workers from mid-March 2020 (459,250 FTEs) and was the lowest FTE total for any month since August 2017 (423,747 FTEs).
-
Mid-April 2020 FTEs were down 4.0% or almost 18,000 FTEs from April 2019 (446,323 FTEs).
-
April was the first month that U.S. scheduled passenger airline FTEs were lower than the same month of the previous year since April 2013.
See BTS Release Schedule
BTS Contact: Dave Smallen
202-366-5568


