
Air Cargo Down 15% Between the U.S. and Foreign Points, March 2020 (Preliminary)
U.S. Department of Transportation sent this bulletin at 06/04/2020 11:05 AM EDT |
|
Having trouble viewing this email? View it as a Web page.
|
Air Cargo Down 15% Between the U.S. and Foreign Points, March 2020 (Preliminary)
U.S. and foreign airlines carried 15.2% less cargo by weight between the U.S. and foreign points in March 2020 than in March 2019, according to data filed with the Bureau of Transportation Statistics (BTS) by large air carriers.
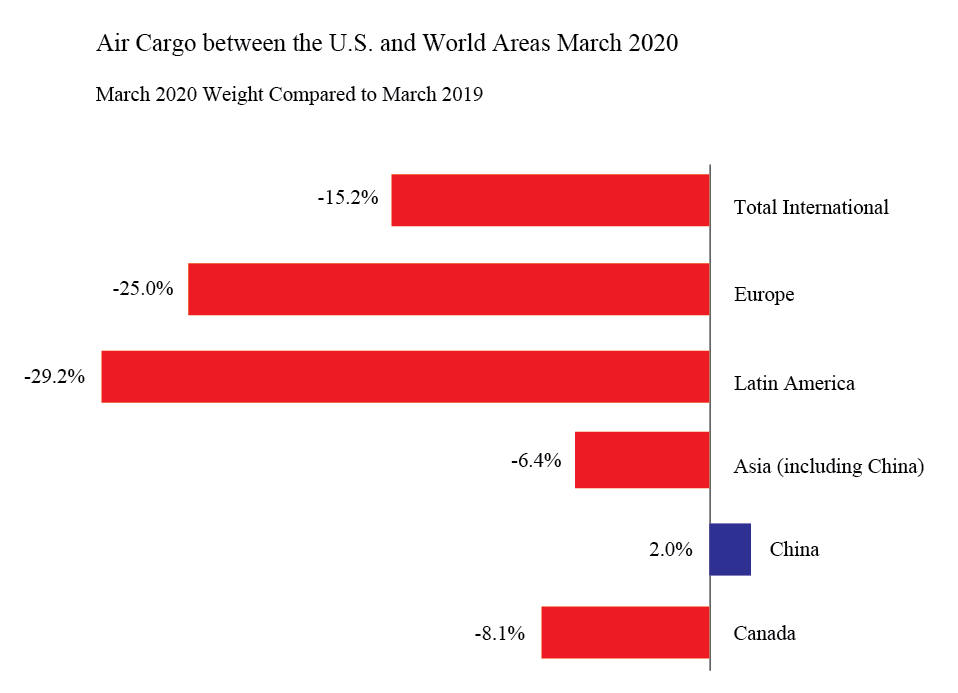
March 2020 cargo numbers to and from the U.S. by world geographic areas (by weight):
- Total to and from the U.S.: 403 thousand tons, down 15.2% from March 2019 (475T tons)
- Europe: 102 thousand tons, down 25.0% from March 2019 (135T tons)
- Latin America: 46 thousand tons, down 29.2% from March 2019 (65T tons)
- Asia (including China): 229 thousand tons, down 6.4% from March 2019 (245T tons)
- China: 66 thousand tons, up 2.0% from March 2019 (66T tons)
- Canada: 9 thousand tons, down 8.1% from March 2019 (10T tons)
The total to and from the U.S. includes world areas that are not shown separately.
Air cargo reports are filed monthly with BTS. Final March data will be released on June 11. Due to confidentiality requirements, complete data between international origins and destinations will be released on September 11. Cargo data in this release consists of cargo carried between the U.S. and foreign points.
Total Cargo to and from the U.S.
The 15.2% decline (preliminary) in the weight of cargo carried on U.S. and foreign airlines between the U.S. and foreign points between March 2020 and March 2019 would be the largest year-to-year decline in the 17 consecutive monthly decreases since October 2018.
|
Year-to-Year Percent Change |
||||
|
|
2016-2017 |
2017-2018 |
2018-2019 |
2019-2020 |
|
January |
7.4 |
13.3 |
-2.1 |
-6.1 |
|
February |
6.3 |
14.2 |
-4.5 |
-9.4 |
|
March |
10.0 |
11.7 |
-1.9 |
-15.2* |
|
April |
6.3 |
13.0 |
-10.0 |
|
|
May |
10.9 |
12.3 |
-6.5 |
|
|
June |
11.1 |
9.3 |
-7.7 |
|
|
July |
11.9 |
4.4 |
-8.4 |
|
|
August |
13.3 |
4.7 |
-5.3 |
|
|
September |
9.5 |
5.8 |
-10.6 |
|
|
October |
13.9 |
1.2 |
-11.8 |
|
|
November |
20.2 |
-9.4 |
-4.0 |
|
|
December |
14.5 |
-2.2 |
-8.6 |
|
|
Annual |
11.5 |
5.9 |
-6.9 |
|
Source: Bureau of Transportation Statistics, T-100 International Market (All Carriers)
* March 2020 data is preliminary
See the tables that accompany this release on the BTS website for year-to-year changes since 2017 for Europe, Latin America, Asia (including China), China and Canada.
Europe
The weight of air cargo between the U.S. and Europe on U.S. and foreign airlines declined 25.0% from March 2019 to March 2020, the largest year-to-year decline in the 13 consecutive decreases since February 2019.
Latin America
The 29.2% decline (preliminary) in the weight of cargo carried on U.S. and foreign airlines between the U.S. and the Latin American region in March 2020 from March 2019 would be the largest year-to-year decline among the 10 decreases in the last 13 months.
Asia (including China)
The weight of cargo carried on U.S. and foreign airlines between the U.S. and Asia declined 6.4% (preliminary) from March 2019 to March 2020, a smaller year-to-year decline than 16.3% in the previous month. March 2020 would be the seventh consecutive year-to-year decline in U.S.-Asia air cargo.
China
March 2020 was the first year-to-year increase (2.0% preliminary) in the weight of cargo carried on U.S. and foreign airlines between the U.S. and China since November 2019. During March 2020, 79.9% of the freight was flown from China to the U.S. while 20.1% was carried from the U.S. to China.
Canada
The 8.1% (preliminary) year-to-year decline in the weight of cargo carried on U.S. and foreign airlines between the U.S. and Canada was fourth decrease since May 2018. It was the second consecutive year-to-year decrease following four consecutive monthly increases. During March 2020, 41.1% of the freight was flown from Canada to the U.S. while 58.9% was carried from the U.S. to Canada.
Reporting Notes
Data are compiled from monthly reports filed with BTS by commercial U.S. air carriers detailing operations, passenger traffic and cargo traffic. This release includes data received by BTS from 35 U.S. and foreign airlines as of May 27.
See the BTS Airlines and Airports page for additional U.S. airlines numbers through February for U.S. airlines. International data by origin and destination is available through November.
BTS has scheduled June 11 for the release of reported data through March.
None of the data are from samples. Measures of statistical significance do not apply to the complete air traffic data.
|
You are subscribed to DOT email updates. Subscriber Services: Manage Preferences |
|
||||||||||||
