BTS 2-Week Outlook
Bureau of Transportation Statistics Upcoming Releases
May 26-June 5
Upcoming from May 26
Wednesday, May 27, 2020 - 11:00am ET
North American Freight Data, March 2020
Thursday, May 28, 2020 - 11:00am ET
Air Cargo between the U.S. and World Regions, March 2020 (Preliminary)
Wednesday, June 3, 2020 - 11:00am ET
Airline Fuel Cost and Consumption, April 2020
Thursday, June 4, 2020 - 11:00am ET
Airline Full-Time/Part-Time Employment, April 2020
Previously Released
May 12 - U.S. Airline Traffic Data (Preliminary), March 2020
May 13 -Transportation Services Index, March 2020
May 14 - Airline Traffic Data, February 2020 Final
May 20 – Airline On-Time/Tarmac Data, March 2020
May 20 - Passenger Airline Employment, March 2020
May 21 -U.S. Airlines Preliminary Cargo Data, March 2020
The Bureau of Transportation Statistics will release the following data sets in the next two weeks:
-
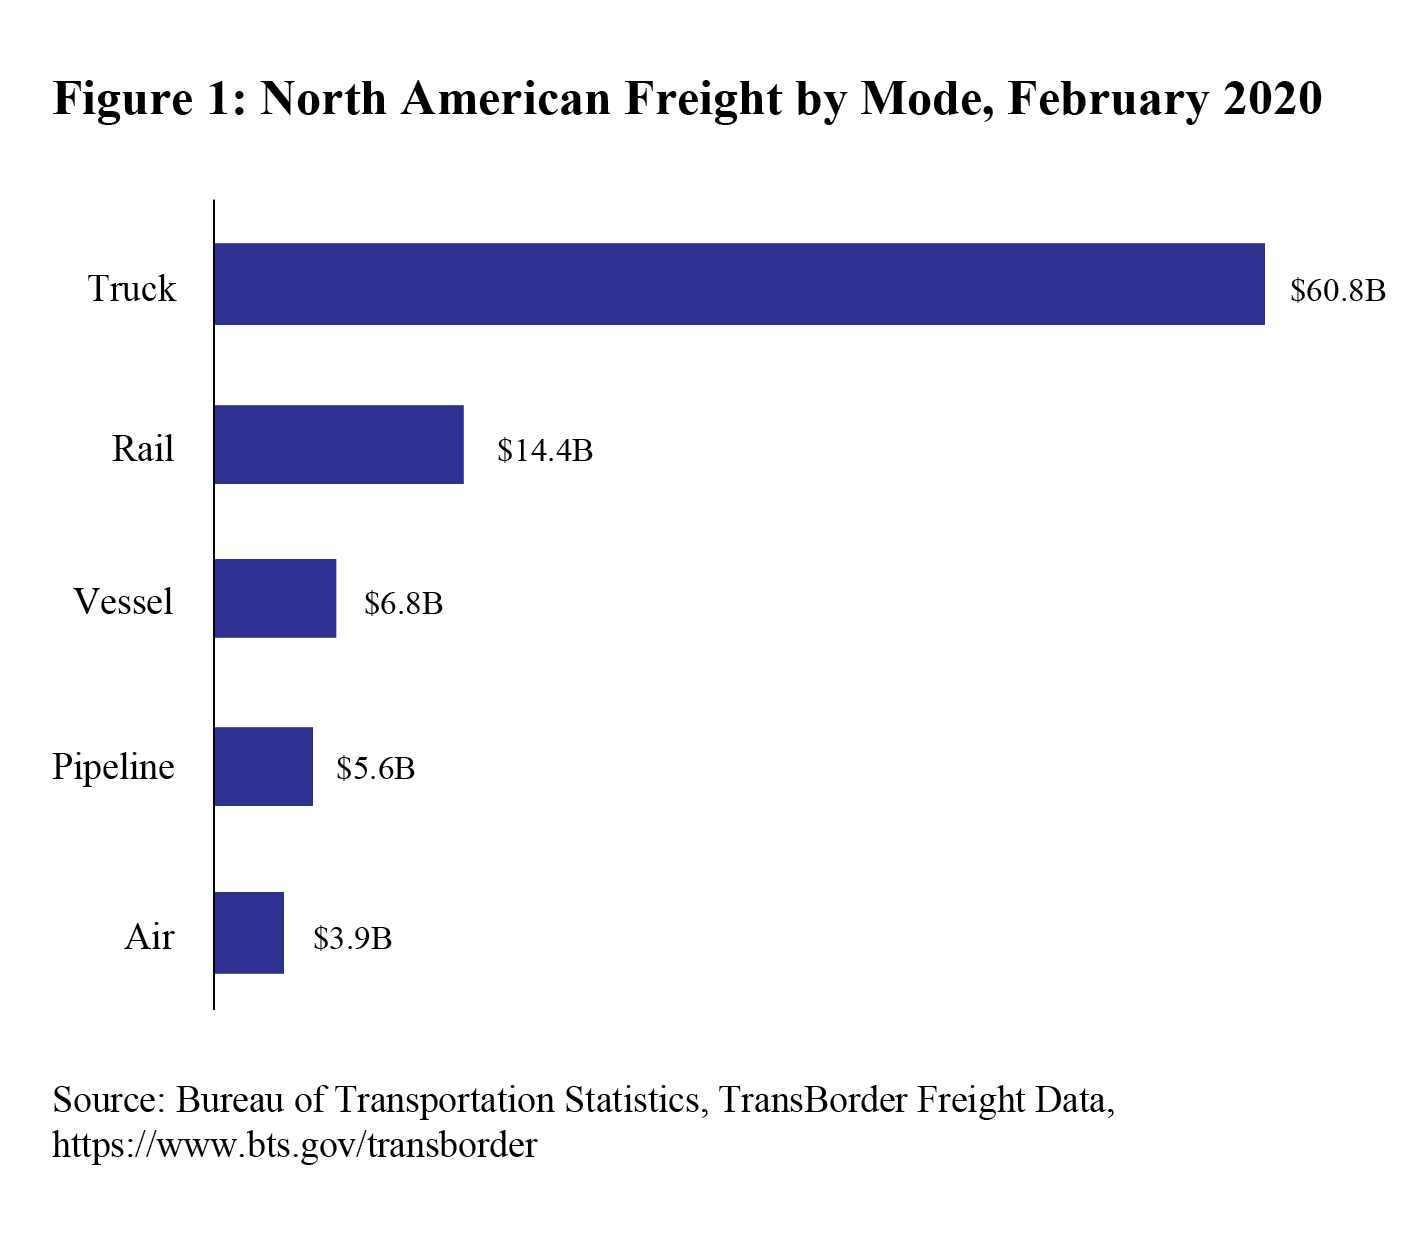
North American Transborder Freight Data, March 2020
Wednesday, May 27, 2020 - 11:00am ET
The release summarizes the monthly value of freight transported by truck, rail and other modes between the U.S. and Canada and the U.S. and Mexico with the top states, ports and commodities. Previously, BTS reported that the value of total Transborder freight in February 2020 was $96 billion, up 1.9% compared to February 2019. Truck moved $61 billion or 63% and rail moved $14 billion or 15%.
-
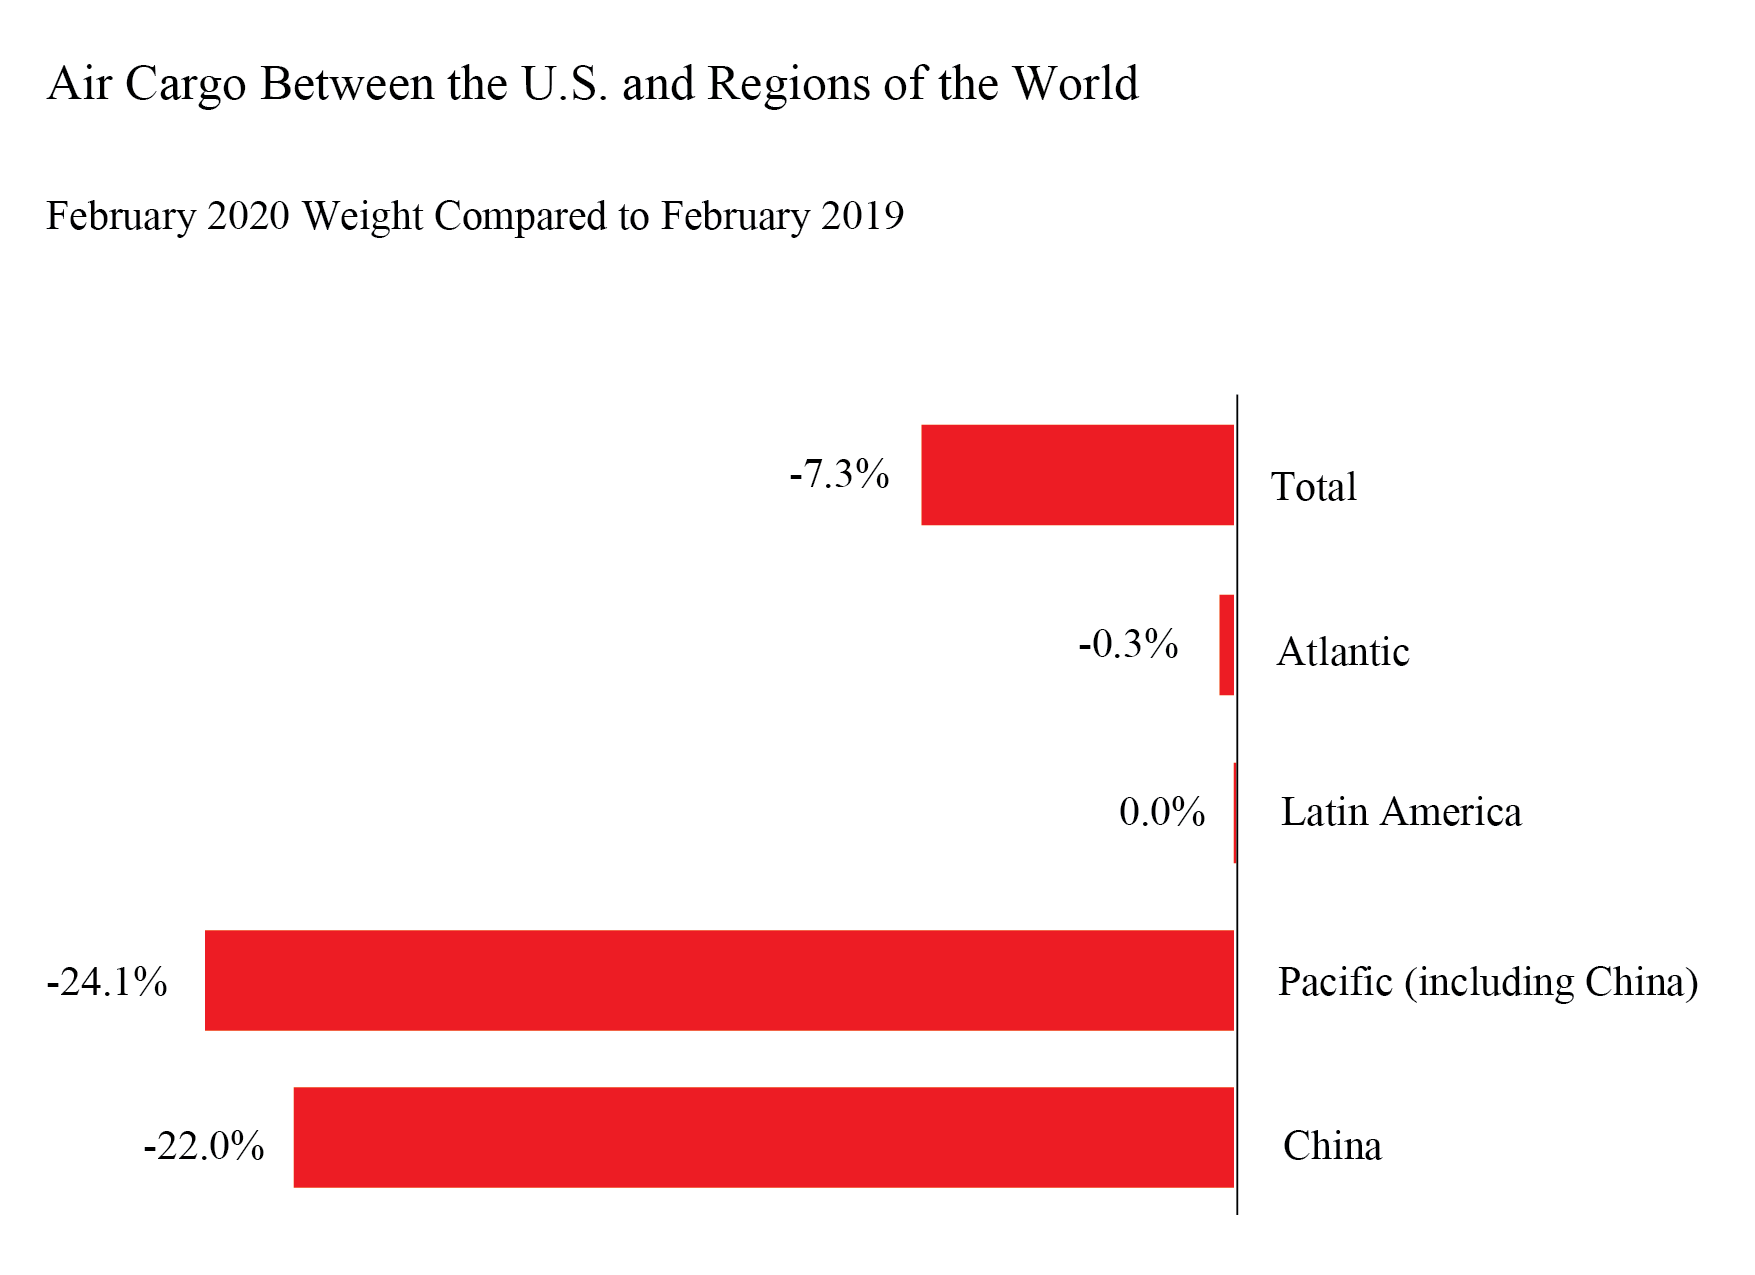
Air Cargo between the U.S. and World Regions, including China, March 2020 (Preliminary)
Thursday, May 28, 2020 - 11:00am ET
The release provides the year-to-year percent change by month from 2016 through March 2020 in the total weight of air cargo between the U.S. and foreign points. It also shows the percent change for cargo between the U.S. and the different regions of the world – Atlantic, Latin America and Pacific. Finally, it shows the list of U.S. airports that received air cargo from China. From the previous release, airlines carried 7.3% less cargo by weight between the U.S. and foreign points in February 2020 than in February 2019.
-
Airline Fuel Cost and Consumption, April 2020
Wednesday, June 3, 2020 - 11:00am ET
Previous release: U.S. airlines March fuel cost was
$1.48/gal, at the lowest level since November 2016 ($1.44). Fuel cost in March 2020 was down 33 cents per gallon from February 2020 ($1.81), and down 54 cents from March 2019 ($2.02). Industry summary of airline fuel consumption, total fuel cost and price paid per gallon are available on the database. Individual
airline numbers through December are available on the BTS website. Individual airline numbers through March will be available on June 15.
-
Airline Full-Time/Part-Time Employment, April 2020
Thursday, June 4, 2020 - 11:00am ET
Previous release: U.S. airline industry March 2020 employment (751,857 total full-time and part-time) was down 0.3% from February 2020 and up 2.3% from March 2019 (passenger+cargo). Monthly full-time and part-time employment statistics are reported by U.S. airlines that operate at least one aircraft that has more than 60 seats or the capacity to carry a payload of passengers, cargo and fuel weighing more than 18,000 pounds. Regulations require airlines to report employment numbers for a pay period near the 15th of the month.
BTS Previously
BTS has released the following:
-
U.S. Airline Traffic Data (Preliminary), March 2020
Released May 12
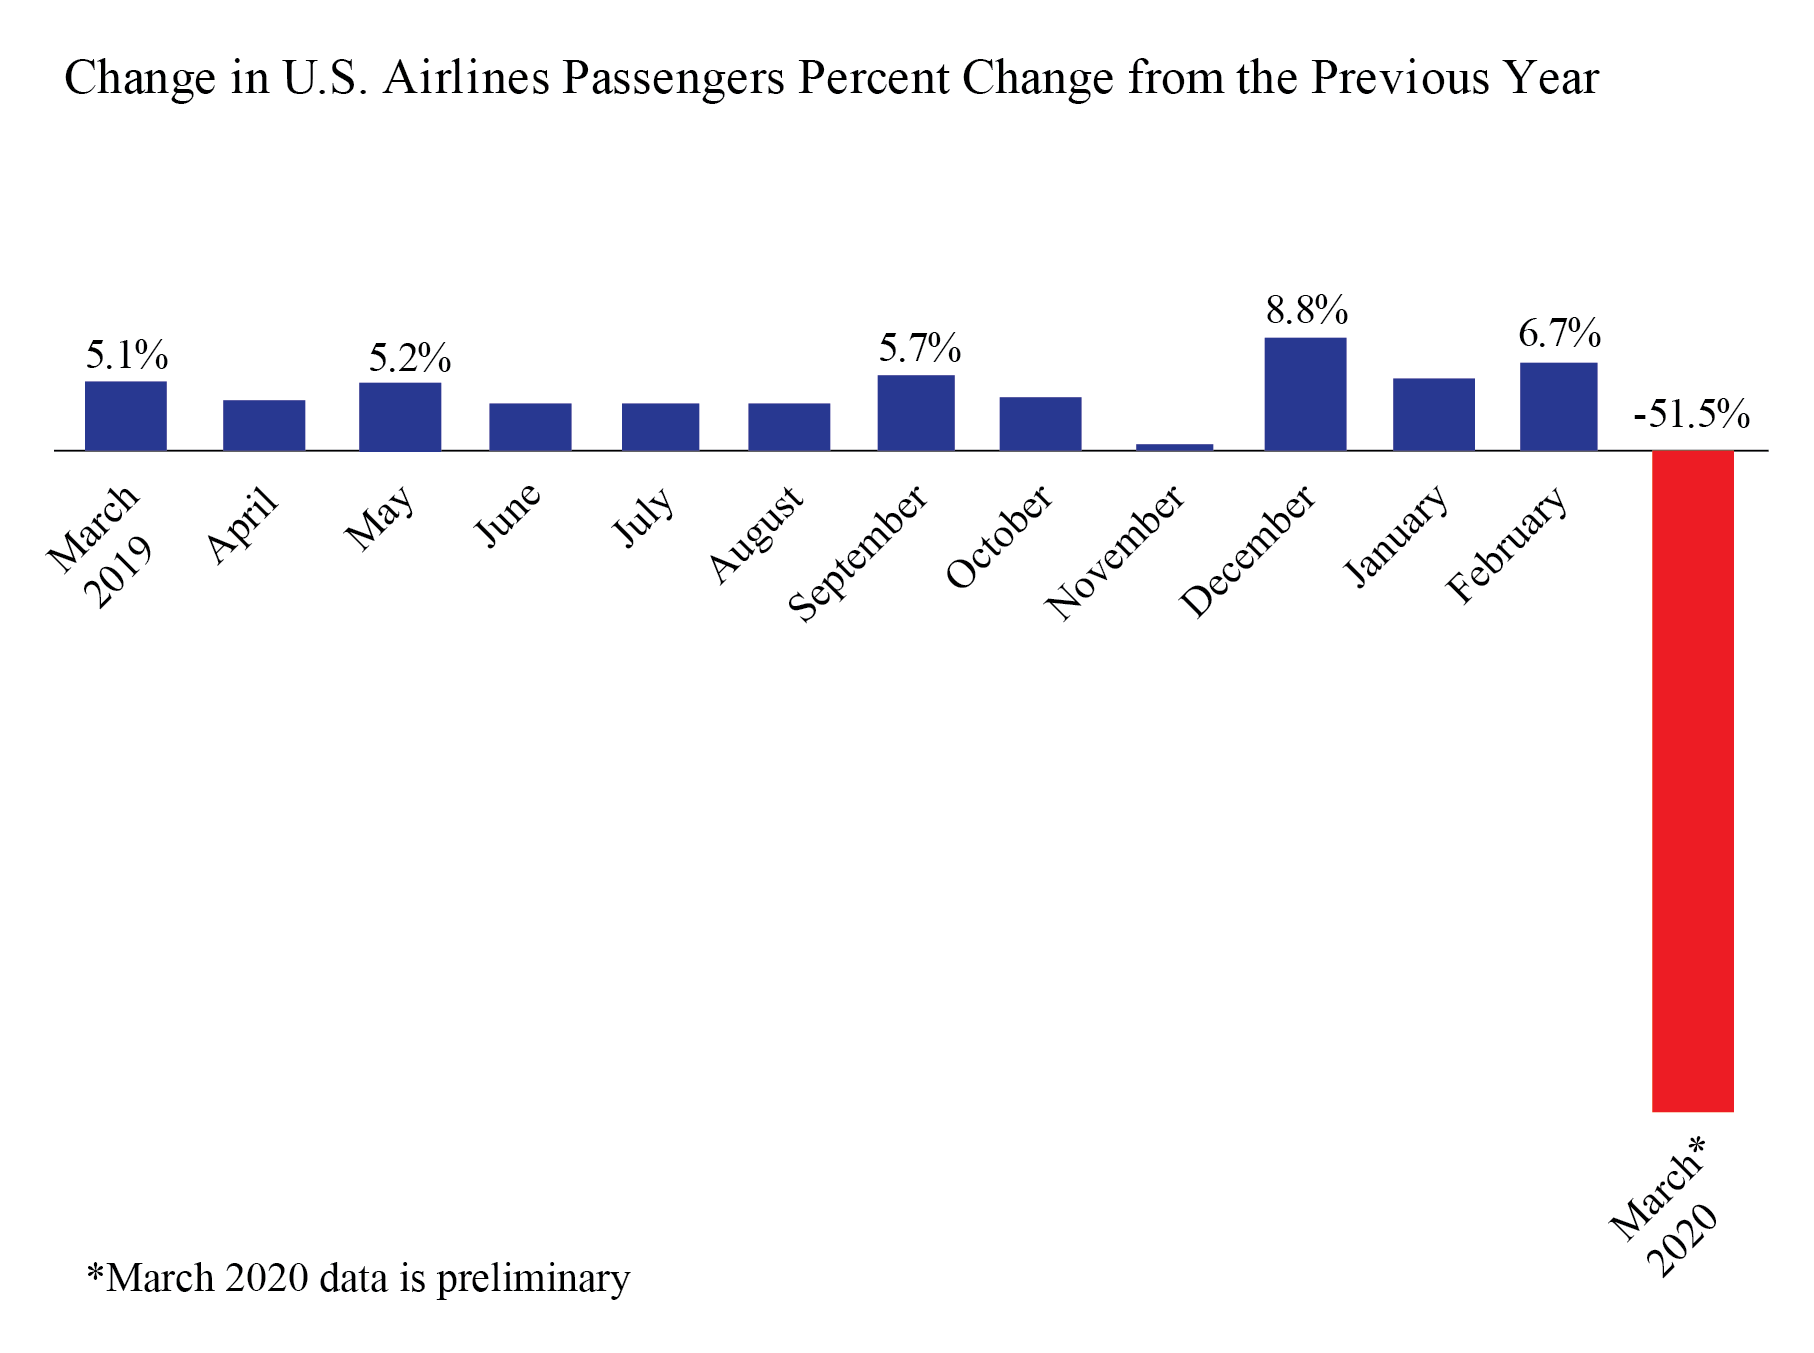
U.S. airlines carried 51% fewer scheduled service passengers in March 2020 than in March 2019, according to preliminary data.
March 2020 passenger numbers for 24 carriers with the most passengers:
-
Total: 38.7 million passengers, down 51% from March 2019 (79.9M)
-
Domestic: 34.1 million passengers, down 51% from March 2019 (69.6M)
-
International: 4.6 million passengers, down 53% from March 2019 (9.9M)
-
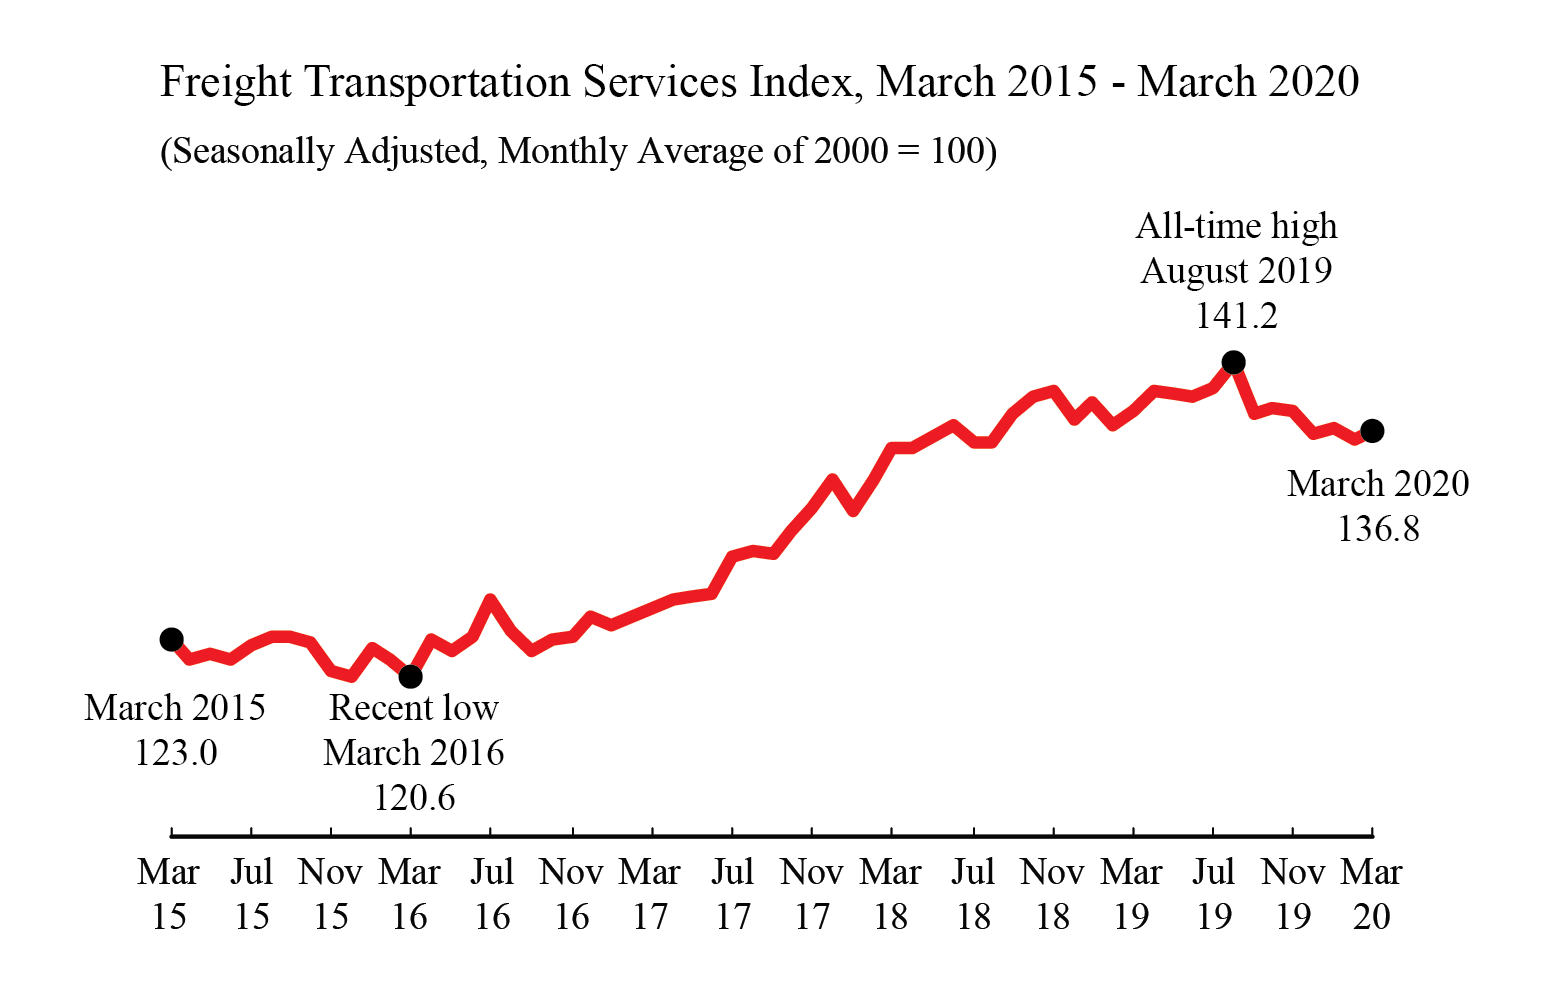
Freight Transportation Services Index (TSI), March 2020
Released May 13
The Freight Transportation Services Index (TSI), which is based on the amount of freight carried by the for-hire transportation industry, rose 0.5% in March from February, rising after a one-month decline. From March 2019 to March 2020, the index fell 0.9% compared to a rise of 1.8% from March 2018 to March 2019 and a rise of 8.4% from March 2017 to March 2018.
-
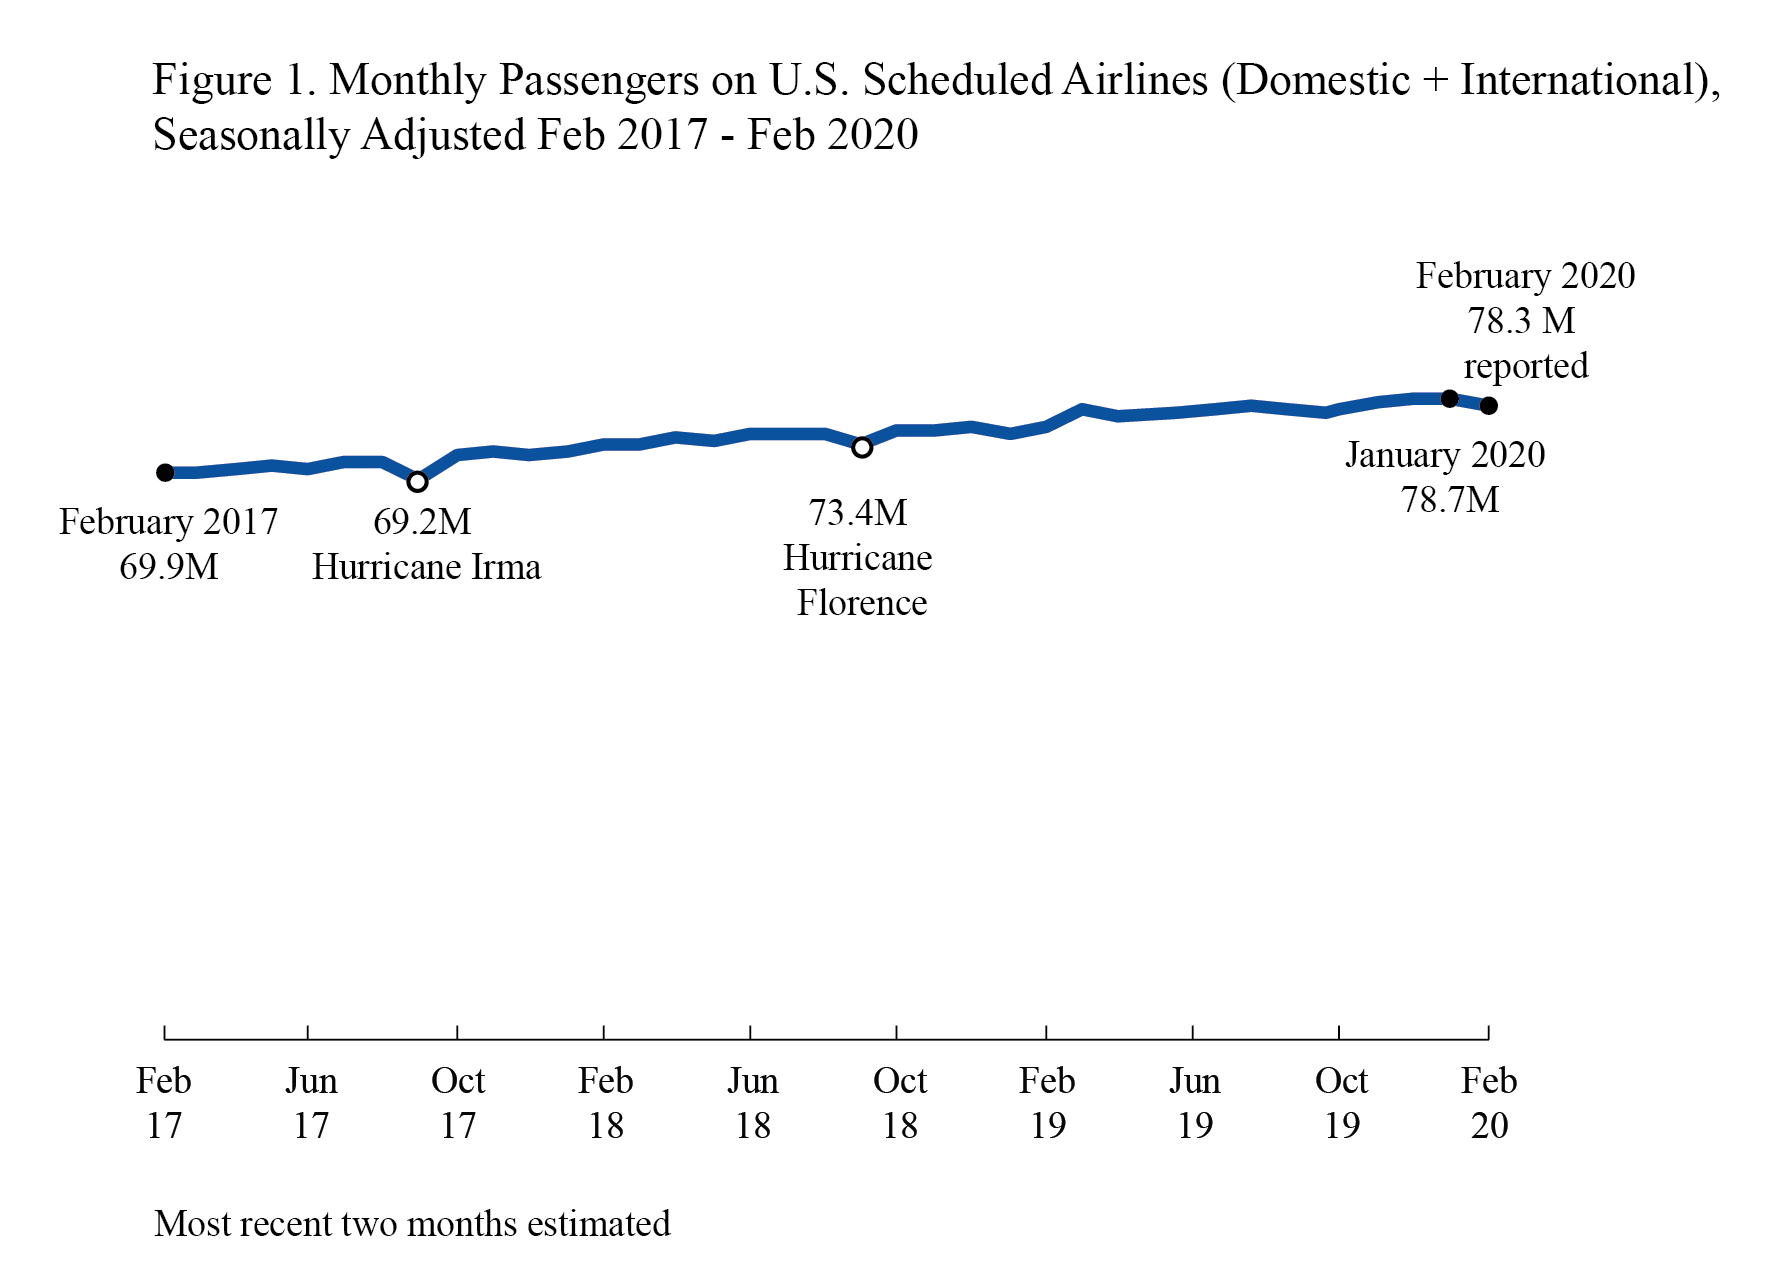
Airline Traffic Data, February 2020 final
Released May 14
U.S. airlines carried 78.3 million systemwide (domestic and international) scheduled service passengers in February 2020, seasonally-adjusted, down 0.6% from January. There were 68.9 million domestic passengers and 9.3 million international passengers on U.S. airlines flights, seasonally-adjusted.
-
Air Travel Consumer Report: March and 1st Quarter 2020 Numbers
Released May 20
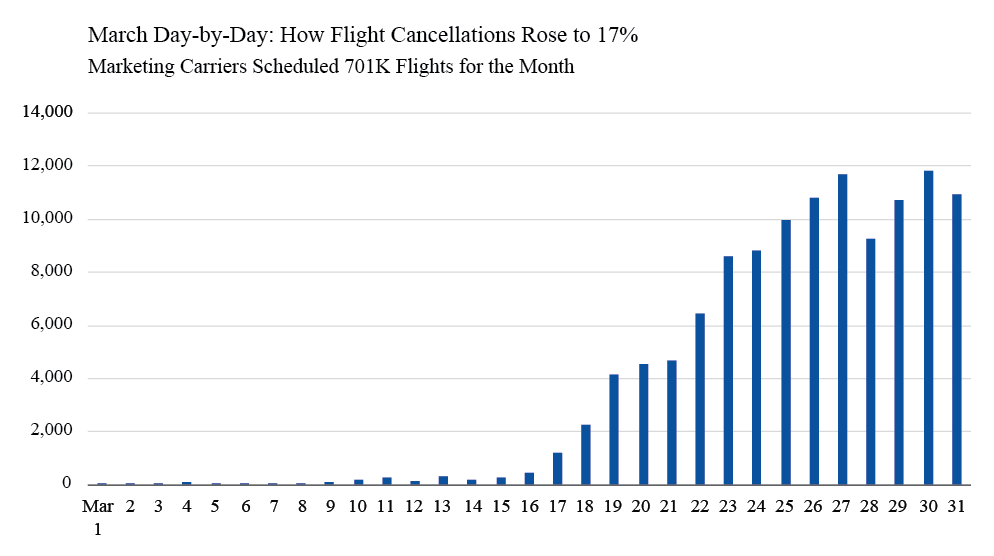
In March 2020, reporting marketing carriers posted an on-time arrival rate of 74.7%, down from both the 83.8% on-time rate in February 2020 and from 80.9% in March 2019. Reporting marketing carriers canceled 16.9% of their scheduled domestic flights, a higher rate than both 1.0% in February 2020 and 2.0% in March 2019. See
March Daily Flights for cancellation numbers by day.
-
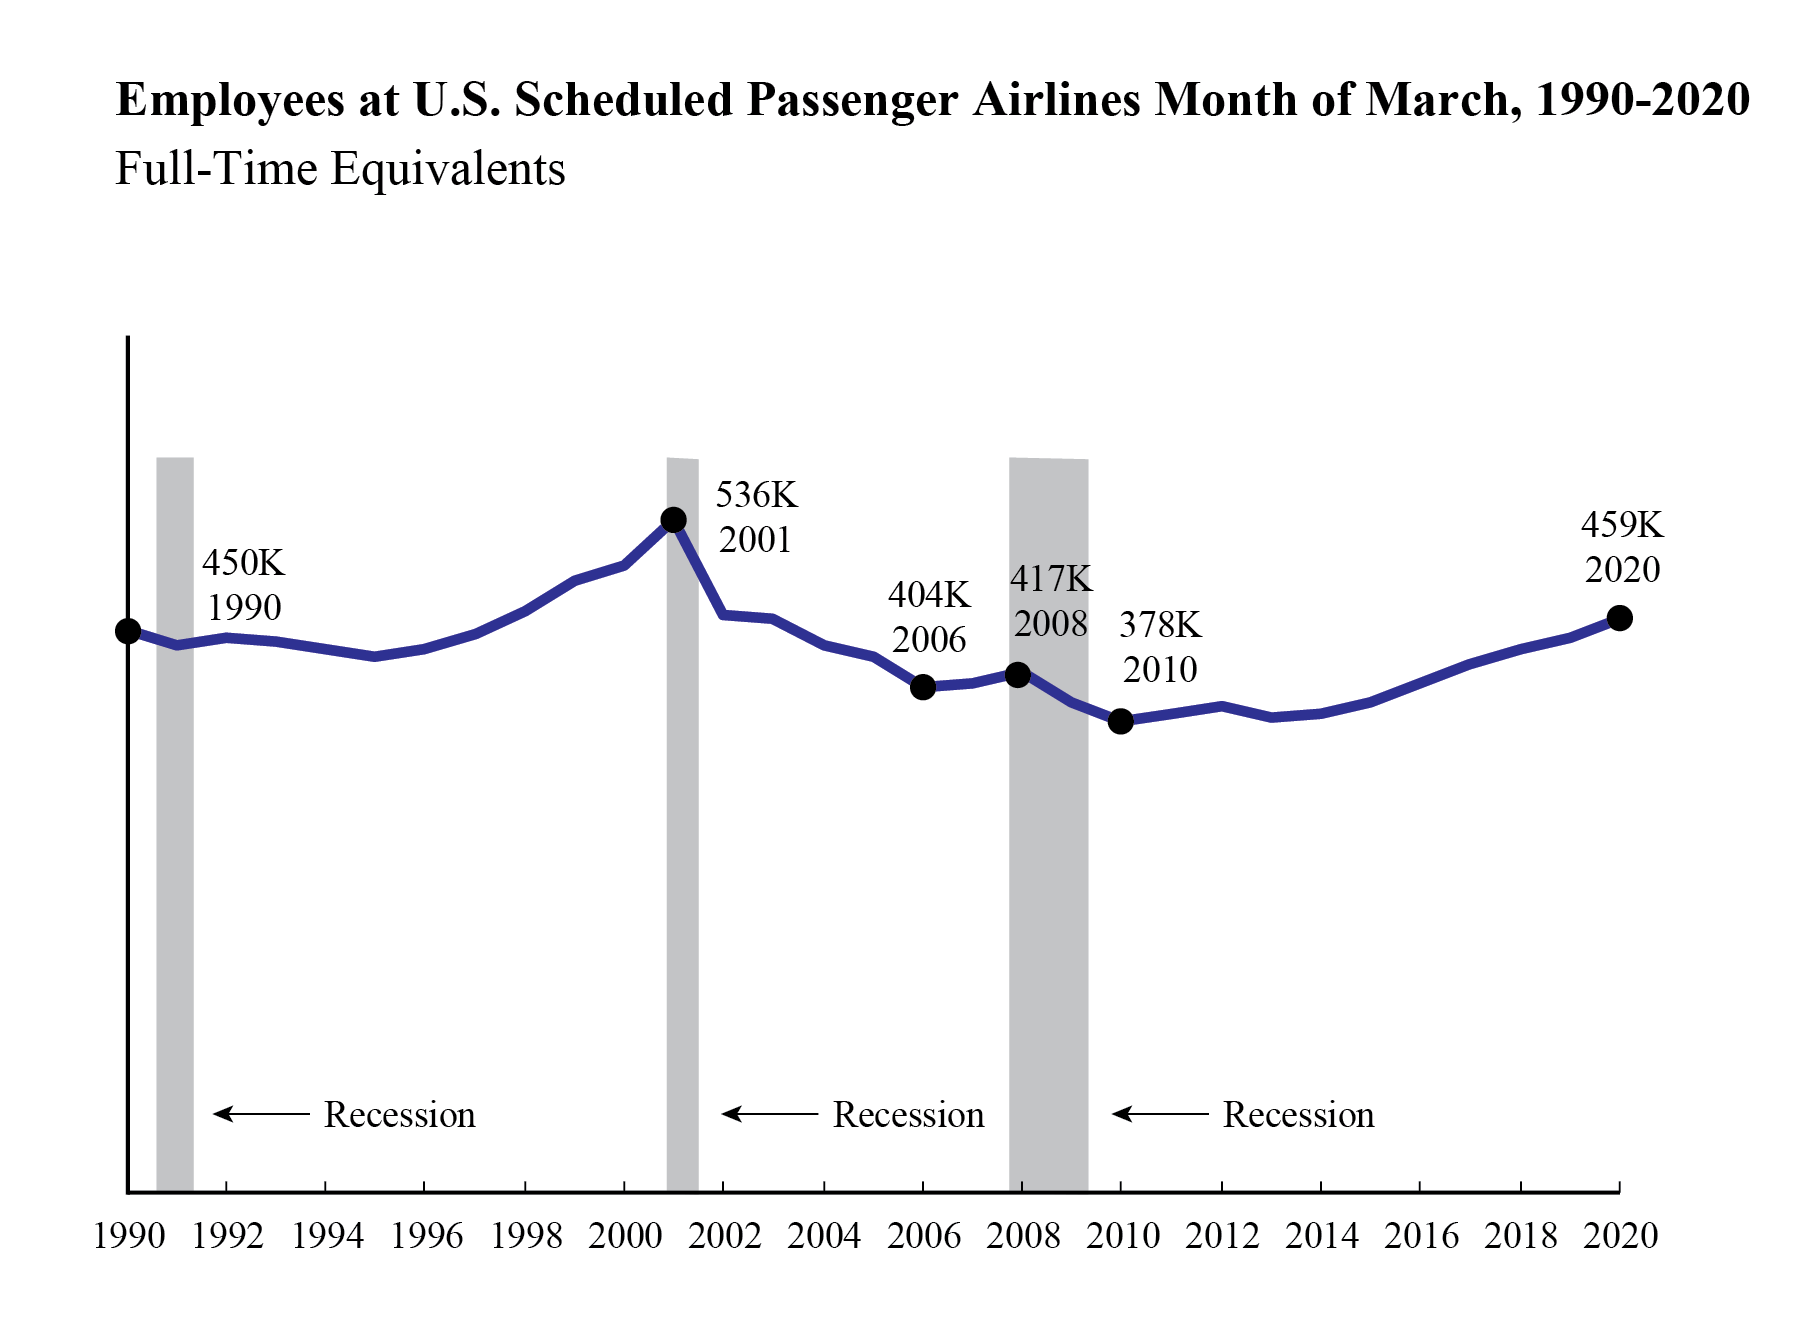
Passenger Airline Employment, March 2020
Released May 20
BTS reported that U.S. scheduled passenger airlines employed 3.2% more workers in March 2020 than in March 2019.
-
March’s 459,190 full-time equivalents (FTEs) was up 3.2% from February 2020 (458,832 FTEs) and was the highest FTE total for any month since February 2003 (460,852 FTEs).
-
March was the 77th consecutive month that U.S. scheduled passenger airline FTEs exceeded the same month of the previous year.
-
Regulations require U.S. airlines to report employment numbers for employees who worked or received pay for any part of the pay period(s) ending nearest the 15th day of the month.
-
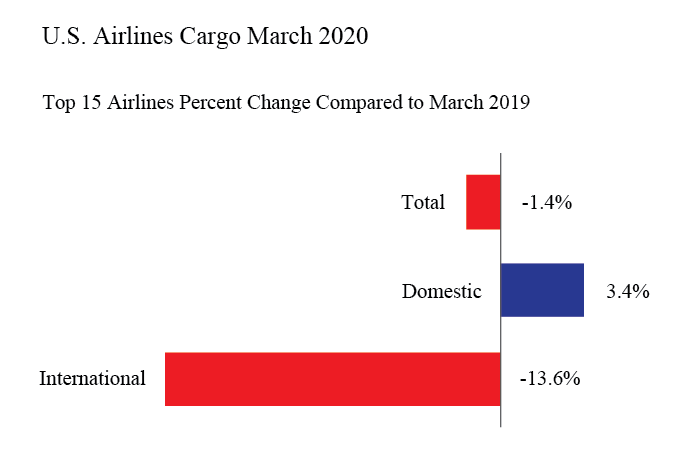
U.S. Airline Cargo Data (Preliminary), March 2020
Released May 21
U.S. airlines carried 1.4% less cargo by weight in March 2020 than in March 2019, data filed by 15 of the leading cargo airlines. The 15 airlines carry more than 95% of the total cargo by weight on U.S. airlines. Cargo data consists of freight and mail carried within the U.S. and between the U.S. and foreign points.
March 2020 cargo numbers for the 15 carriers:
-
Total: 1,455 thousand tons, down 1.4% from March 2019 (1,475T tons)
-
Domestic: 1,098 thousand tons, up 3.4% from March 2019 (1,062T tons)
-
International: 357 thousand tons, down 13.6% from March 2019 (413T tons)
See BTS Release Schedule
BTS Contact: Dave Smallen
202-366-5568