
February 2020 U.S. Airline Traffic Data (Preliminary) (February 2020 passenger total corrected)
U.S. Department of Transportation sent this bulletin at 04/14/2020 12:04 PM EDT |
|
Having trouble viewing this email? View it as a Web page.
|
February 2020 U.S. Airline Traffic Data (Preliminary)
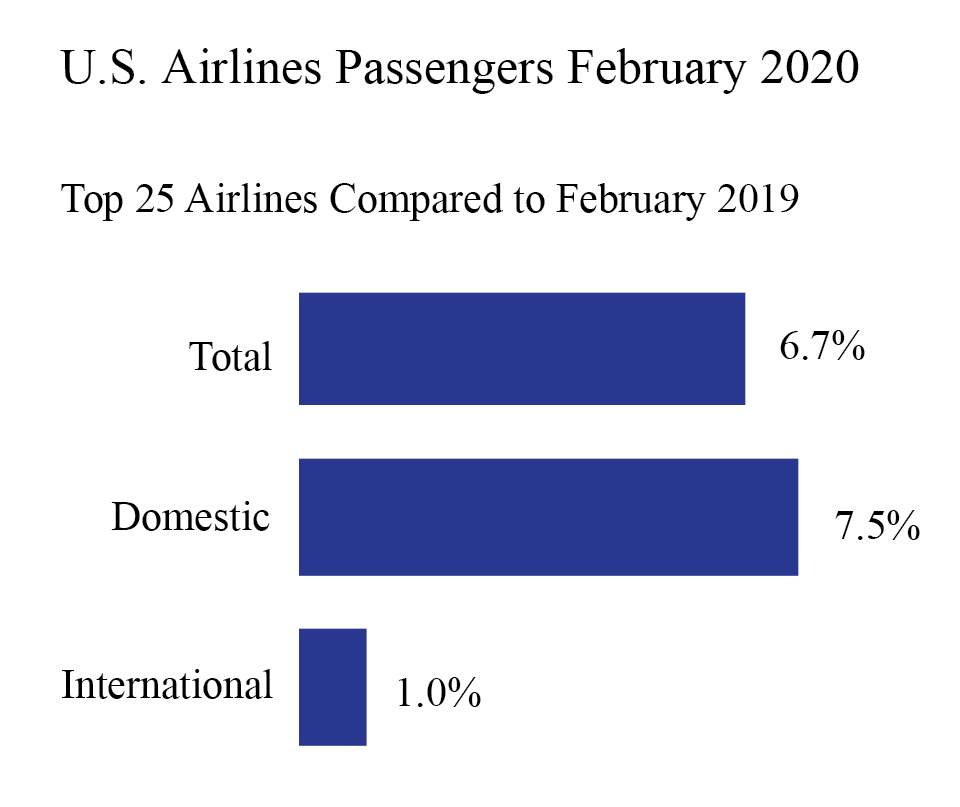
U.S. airlines carried 6.7% more scheduled service passengers in February 2020 than in February 2019, according to preliminary data filed with the Bureau of Transportation Statistics (BTS) by the 25 airlines that carry the most passengers.
The 25 airlines carry 99% of the total passengers traveling on U.S. airlines.
February 2020 passenger numbers for 25 carriers with the most passengers:
- Total: 67.6 million passengers in February 2020, up 6.7% from February 2019 (63.3M)
- Domestic: 59.6 million passengers in February 2020, up 7.5% from February 2019 (55.5M)
- International: 7.91 million passengers in February 2020, up 1.0% from February 2019 (7.84M)
U.S. airline traffic reports are filed monthly with BTS. Final February data will be released on May 14. Complete international data by origin and destination will be released on Aug. 13.
President Trump issued an order on Jan. 31 restricting travel to the U.S. from China. He issued an additional order on March 11 restricting travel to the U.S. from certain European countries.
Systemwide Passengers
February 2020 would be the 29th consecutive month of increases in U.S. airlines passengers from the same month of the previous year dating back to October 2017. During those 29 months, only the 8.8% increase from December 2018 to December 2019 was a larger year-to-year increase than the 6.7% rise from February 2019 to February 2020.
Table 1: Systemwide Percent Change in US Airlines Scheduled Service Passengers from the Same Month of the Previous Year 2017-2020
|
Year-to-Year Percent Change |
||||
|
|
2016-2017 |
2017-2018 |
2018-2019 |
2019-2020 |
|
January |
3.0 |
2.9 |
4.0 |
5.6 |
|
February |
-0.2 |
5.7 |
3.0 |
6.7* |
|
March |
3.4 |
4.6 |
5.1 |
|
|
April |
4.5 |
4.8 |
3.8 |
|
|
May |
3.0 |
4.9 |
5.2 |
|
|
June |
3.4 |
5.0 |
3.7 |
|
|
July |
3.8 |
5.2 |
3.6 |
|
|
August |
5.0 |
5.0 |
3.4 |
|
|
September |
-2.3 |
5.8 |
5.7 |
|
|
October |
4.6 |
3.9 |
4.1 |
|
|
November |
4.6 |
4.5 |
0.5 |
|
|
December |
3.5 |
3.6 |
8.8 |
|
|
Annual |
3.1 |
4.7 |
4.2 |
|
Source: Bureau of Transportation Statistics, T-100 Market
* February 2020 data is preliminary
Domestic Passengers
February 2020 would be the 29th consecutive month of increases in U.S. airlines domestic passengers from the same month of the previous year dating back to October 2017. During those 29 months, only the 9.5% increase from December 2018 to December 2019 was a larger year-to-year domestic passenger increase than the 7.5% rise from February 2019 to February 2020.
Table 2: Domestic Percent Change in US Airlines Scheduled Service Passengers from the Same Month of the Previous Year 2017-2020
|
Year-to-Year Percent Change |
||||
|
|
2016-2017 |
2017-2018 |
2018-2019 |
2019-2020 |
|
January |
3.1 |
3.2 |
3.9 |
6.2 |
|
February |
-0.1 |
5.9 |
3.0 |
7.5* |
|
March |
3.8 |
4.2 |
5.4 |
|
|
April |
3.7 |
5.7 |
3.7 |
|
|
May |
2.7 |
5.3 |
5.2 |
|
|
June |
3.1 |
5.3 |
3.6 |
|
|
July |
3.7 |
5.8 |
3.8 |
|
|
August |
5.0 |
5.5 |
3.4 |
|
|
September |
-2.5 |
5.8 |
5.8 |
|
|
October |
4.7 |
3.8 |
4.2 |
|
|
November |
4.5 |
4.4 |
0.2 |
|
|
December |
3.7 |
3.7 |
9.5 |
|
|
Annual |
3.0 |
4.9 |
4.3 |
|
Source: Bureau of Transportation Statistics, T-100 Domestic Market
* February 2020 data is preliminary
International Passengers
February 2020 would be the 22nd consecutive month of increases in U.S. airlines international passengers from the same month of the previous year dating back to May 2018. The 1.0% increase in passengers from February 2019 would be the smallest year-to-year increase during those 22 months.
Table 3: International Percent Change in US Airlines Scheduled Service Passengers from the Same Month of the Previous Year 2017-2020
|
Year-to-Year Percent Change |
||||
|
|
2016-2017 |
2017-2018 |
2018-2019 |
2019-2020 |
|
January |
2.1 |
1.0 |
4.5 |
1.9 |
|
February |
-1.2 |
4.6 |
3.4 |
1.0* |
|
March |
0.4 |
7.2 |
3.4 |
|
|
April |
9.8 |
-1.0 |
4.6 |
|
|
May |
5.4 |
2.3 |
5.6 |
|
|
June |
5.3 |
3.4 |
4.2 |
|
|
July |
4.6 |
1.6 |
2.2 |
|
|
August |
4.9 |
2.0 |
3.9 |
|
|
September |
-1.1 |
5.9 |
4.6 |
|
|
October |
3.2 |
4.3 |
3.2 |
|
|
November |
5.4 |
4.7 |
2.2 |
|
|
December |
1.7 |
3.2 |
3.6 |
|
|
Annual |
3.5 |
3.1 |
3.8 |
|
Source: Bureau of Transportation Statistics, T-100 International Market
* February 2020 data is preliminary
Reporting Notes
Data are compiled from monthly reports filed with BTS by commercial U.S. air carriers detailing operations, passenger traffic and freight traffic. This release includes data received by BTS from 25 U.S. airlines as of April 7.
See the BTS Airlines and Airports page for additional U.S. airlines numbers through December for U.S. airlines. International data by origin and destination is available through September.
BTS has scheduled April 16 for the release of reported data through January.
None of the data are from samples. Measures of statistical significance do not apply to the complete air traffic data.
|
You are subscribed to DOT email updates. Subscriber Services: Manage Preferences |
|
||||||||||||
