
2019 North American Transborder Freight Numbers
U.S. Department of Transportation sent this bulletin at 03/06/2020 11:04 AM EST |
|
Having trouble viewing this email? View it as a Web page.
|
2019 North American Transborder Freight Numbers
Transborder freight between the U.S. and other North American countries (Canada and Mexico) in 2019:
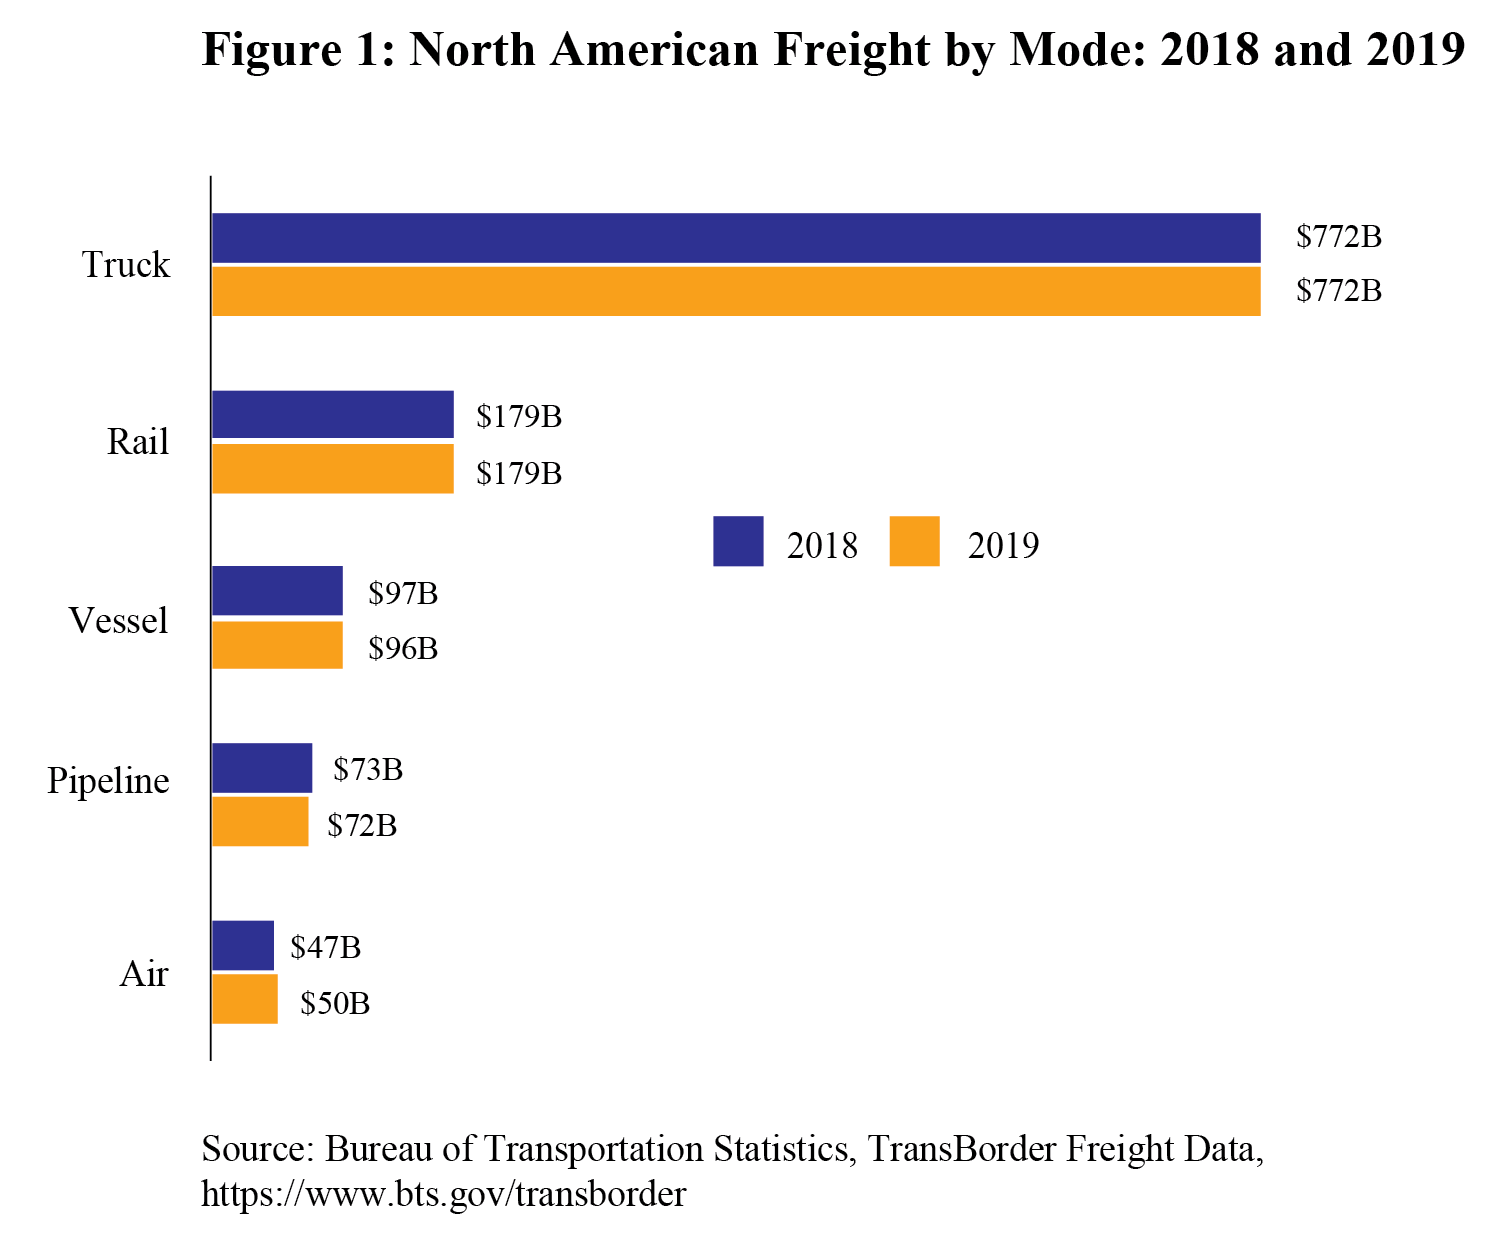
- Total Transborder Freight: $1.2 trillion of transborder freight moved by all modes of transportation, down 0.2% from 2018
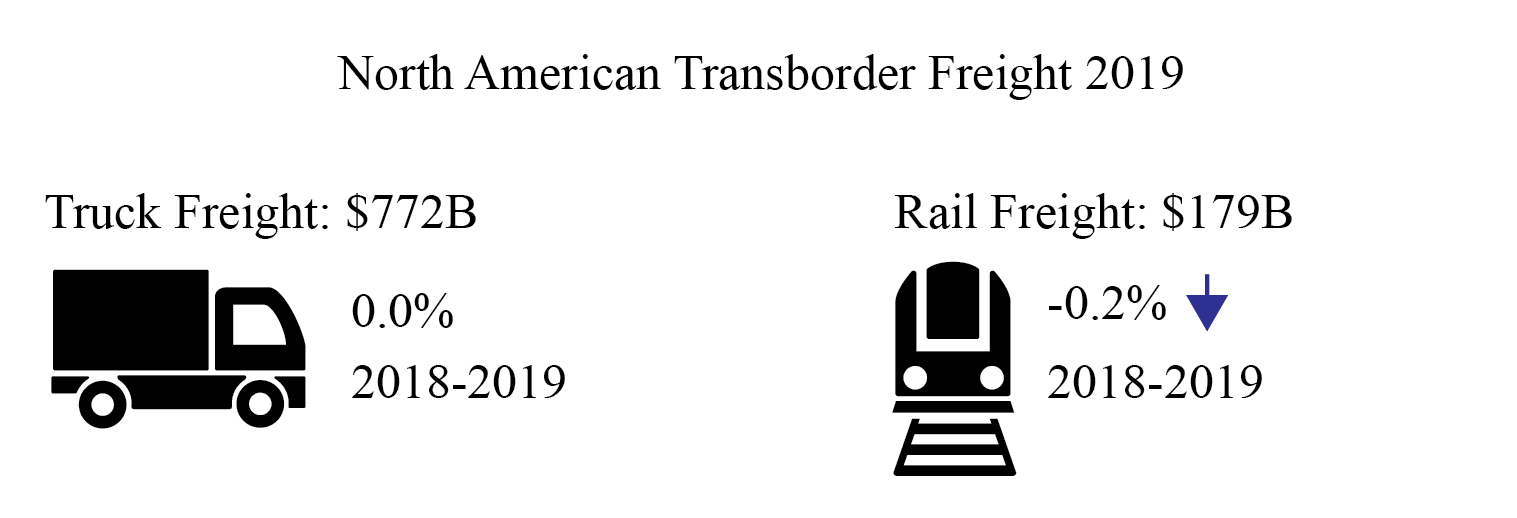
- Most-used mode: Truck moved $772 billion of freight, virtually unchanged compared to 2018
- Second most-used mode: Rail moved $179 billion of freight, down 0.2% compared to 2018
Truck Freight: $772 billion (63.0% of all transborder freight)
-
By border:
- Compared to previous year:
-
Busiest three truck border ports (45.8% of total transborder truck freight):
- Laredo, TX: $182 billion
- Detroit, MI: $106 billion
- El Paso, TX: $65 billion
-
Top three truck commodities (51.1% of total transborder truck freight):
- Computers and parts: $156 billion
- Electrical machinery: $121 billion
- Motor vehicles and parts: $117 billion
Rail Freight: $179 billion (14.6% of all transborder freight)
- By border:
- Compared to previous year:
-
Busiest three rail border ports (52.9% of total transborder rail freight):
- Laredo, TX: $44 billion
- Detroit, MI: $26 billion
- Port Huron, MI: $24 billion
-
Top three rail commodities (62.8% of total transborder rail freight):
- Motor vehicles and parts: $89 billion
- Mineral fuels: $14 billion
- Plastics: $9 billion
Freight by Mode:
Almost all (99.6%) of pipeline freight between the U.S. and Canada were mineral fuels, primarily oil and gas. Most of these freight flows were on pipelines linking Canada and the American Midwest.
Of freight by vessel between the U.S. and Mexico, $35 billion, or 53.5% were mineral fuels, primarily oil and gas shipments between Gulf of Mexico ports in the U.S. and Mexico – with over half of those shipments going through Texas ports.
Reporting Notes
Data in this Bureau of Transportation Statistics release are not seasonally adjusted and are not adjusted for inflation. For previous statistical releases and summary tables, see TransBorder Releases. See TransBorder Freight Data for data from previous months, and for additional state, port, and commodity data. BTS has scheduled the release of January TransBorder numbers for March 25.
|
You are subscribed to DOT email updates. Subscriber Services: Manage Preferences |
|
||||||||||||
