
Third Quarter 2019 Air Fare Data
U.S. Department of Transportation sent this bulletin at 01/22/2020 11:01 AM EST |
|
Having trouble viewing this email? View it as a Web page.
|
Third Quarter 2019 Air Fare Data
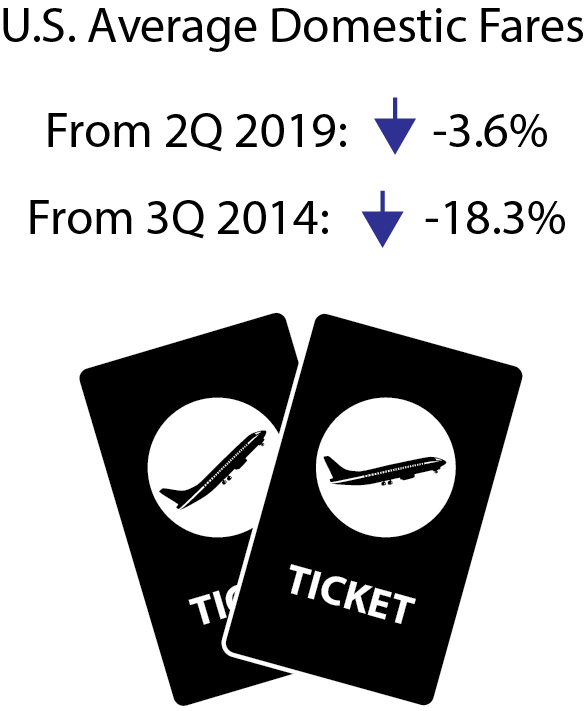
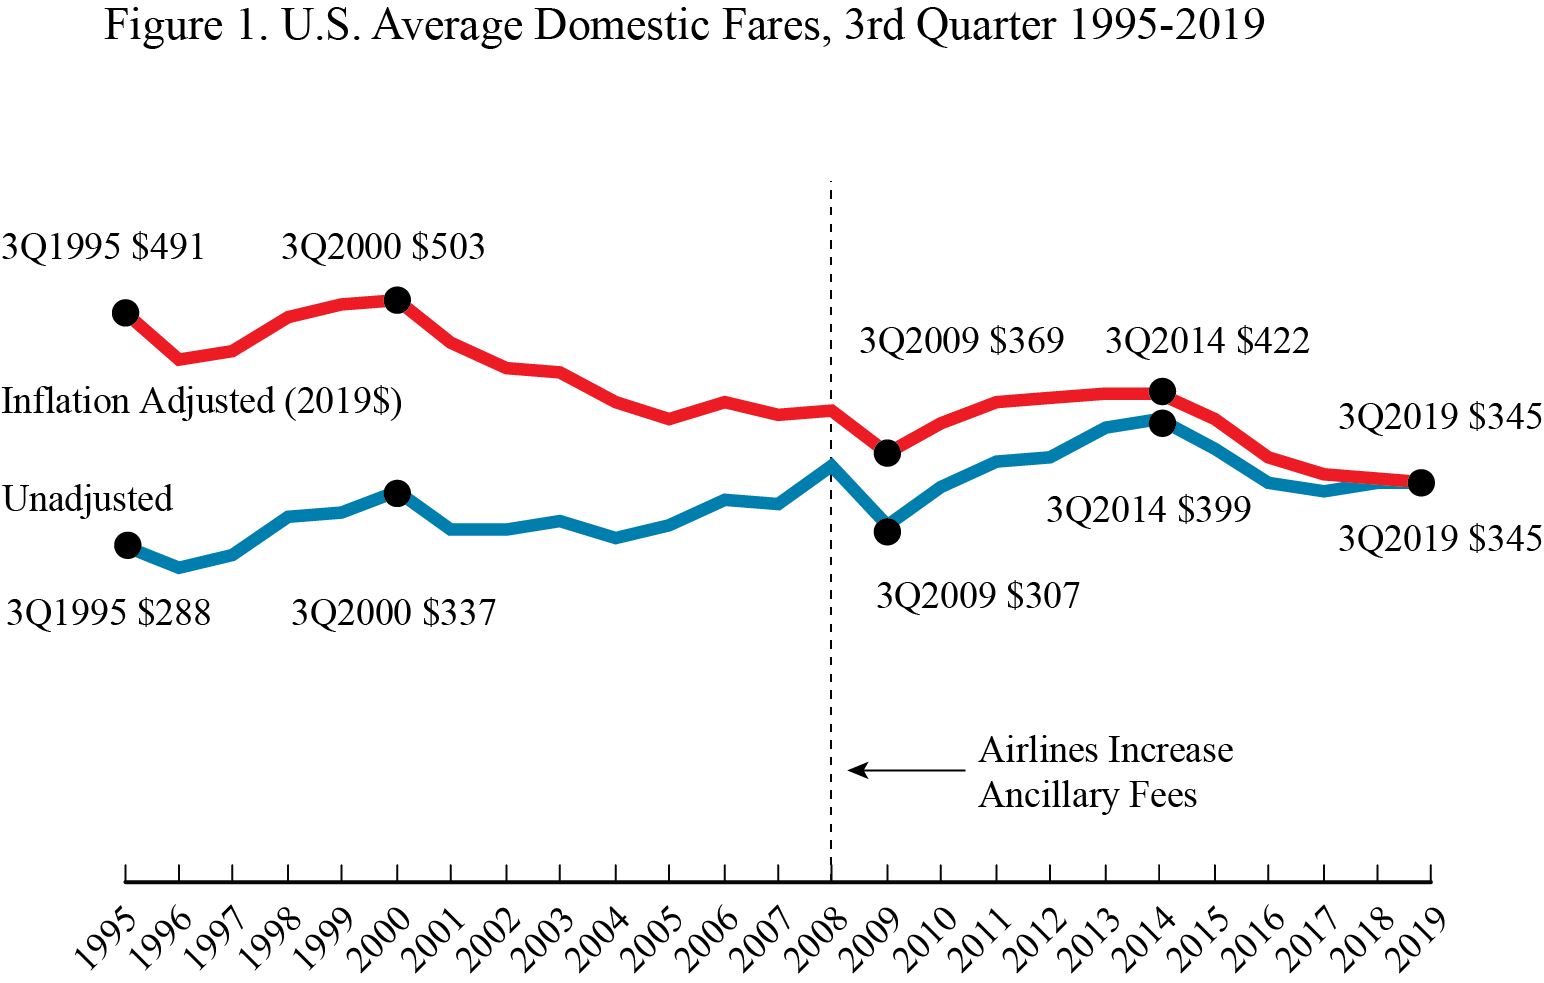
U.S. domestic air fares in the third quarter of 2019 of $345 were the lowest on record, inflation adjusted, based on Bureau of Transportation Statistics (BTS) records dating from 1995. The third-quarter 2019 fares were down 1.2% from the previous low of $349 in the third quarter of 2018.
Adjusted for inflation, (constant 2019 dollars) the 3Q 2019 air fare was:
- Down 1.2% from 3Q 2018 ($349)
- Down 3.6% from 2Q 2019 ($358). The second-quarter fare was revised from $364 in the previous release after Frontier Airlines refiled second-quarter data. Frontier’s revised second-quarter and third-quarter data are included in this release.
- Down 18.3% from 3Q 2014 ($422)
Source: Bureau of Transportation Statistics, BTS Air Fares, Origin and Destination Survey
Itinerary Fares: Round-trips, but includes one-way tickets if no return is purchased.
Breakout of trip types: one-way, 40% ($250); round-trip, 60% ($421).
Other Revenue: In recent years, airlines increasingly obtain additional revenue from passenger fees, as well as from other sources. U.S. passenger airlines collected 73.8% of total operating revenue of $108.6 billion from passenger fares during the first nine months of 2019, down from 88.5% in 1990.
Fares by Airport
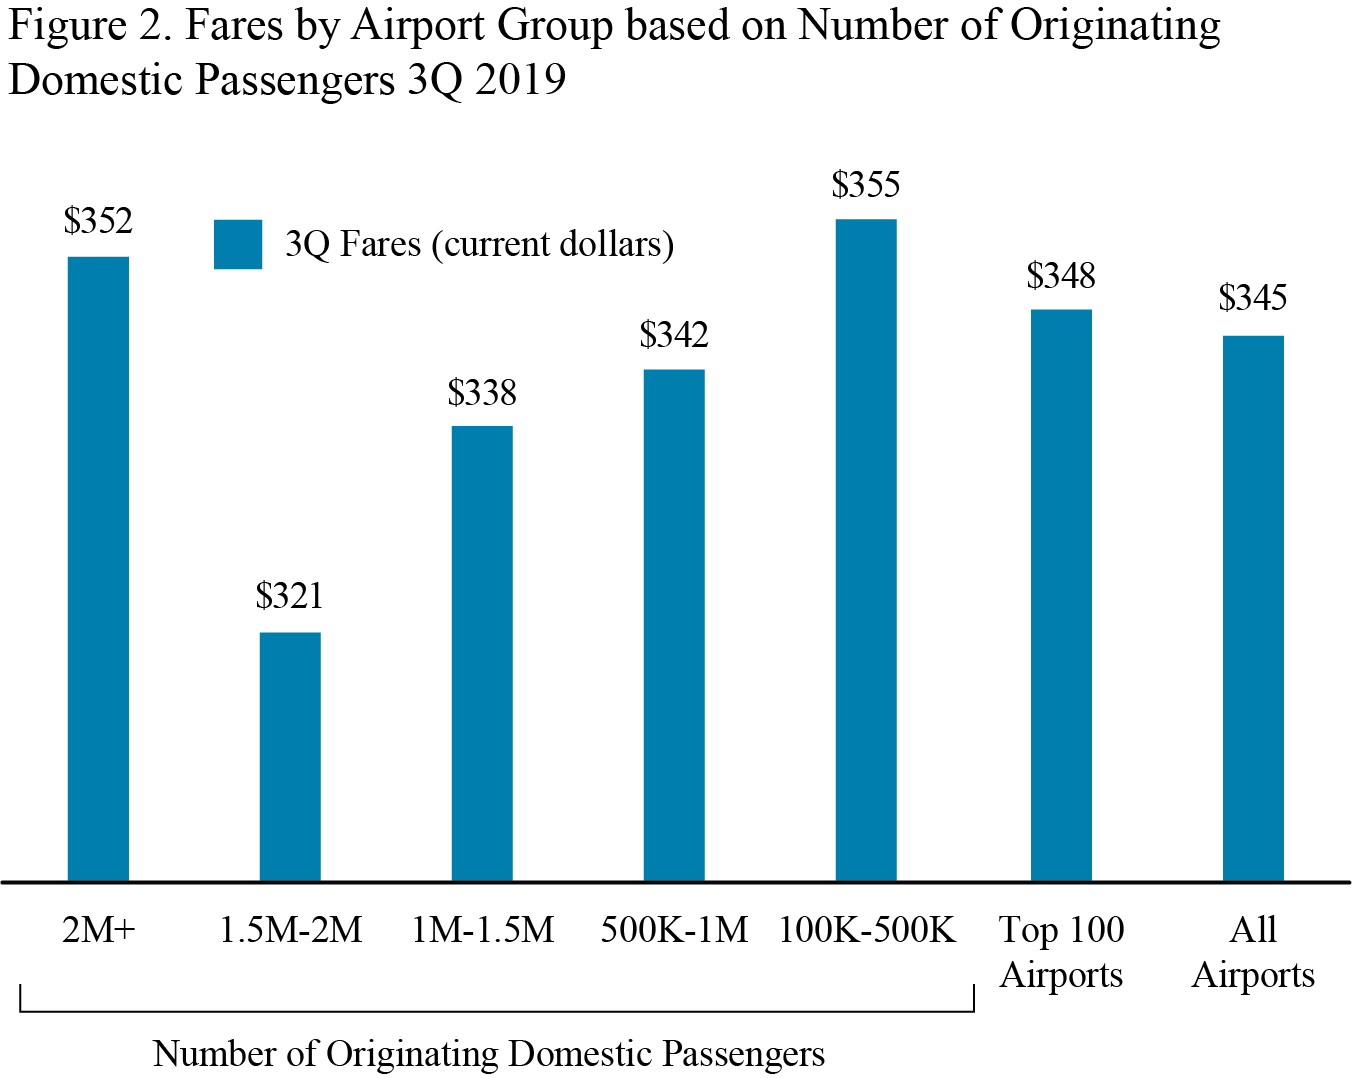
Source: Bureau of Transportation Statistics, BTS Air Fares, Origin and Destination Survey
Additional data: see Top 100 Airports or All Airports. Fourth Quarter 2019 average fare data will be released April 21.
Standard error: Results for average fares are based on the BTS Origin & Destination Survey, a 10% sample of airline tickets used during the quarter. Averages for airports with smaller samples may be less reliable.
Note: Results for average fares are based on the BTS Origin & Destination Survey, a 10 percent sample of airline tickets used during the quarter. For results based on all itinerary fares, the standard error is 0.28. The 90% confidence interval ranges from $344.64 to $345.54. For results based on round-trip fares, the standard error is 0.35. The 90% confidence interval ranges from $420.55 to $421.70. For results based on one-way fares, the standard error is 0.33. The 90% confidence interval ranges from $249.44 to $250.54.
|
You are subscribed to DOT email updates. Subscriber Services: Manage Preferences |
|
||||||||||||
