
October 2019 U.S. Passenger Airline Employment Data
U.S. Department of Transportation sent this bulletin at 12/13/2019 11:03 AM EST |
|
Having trouble viewing this email? View it as a Web page.
|
October 2019 U.S. Passenger Airline Employment Data
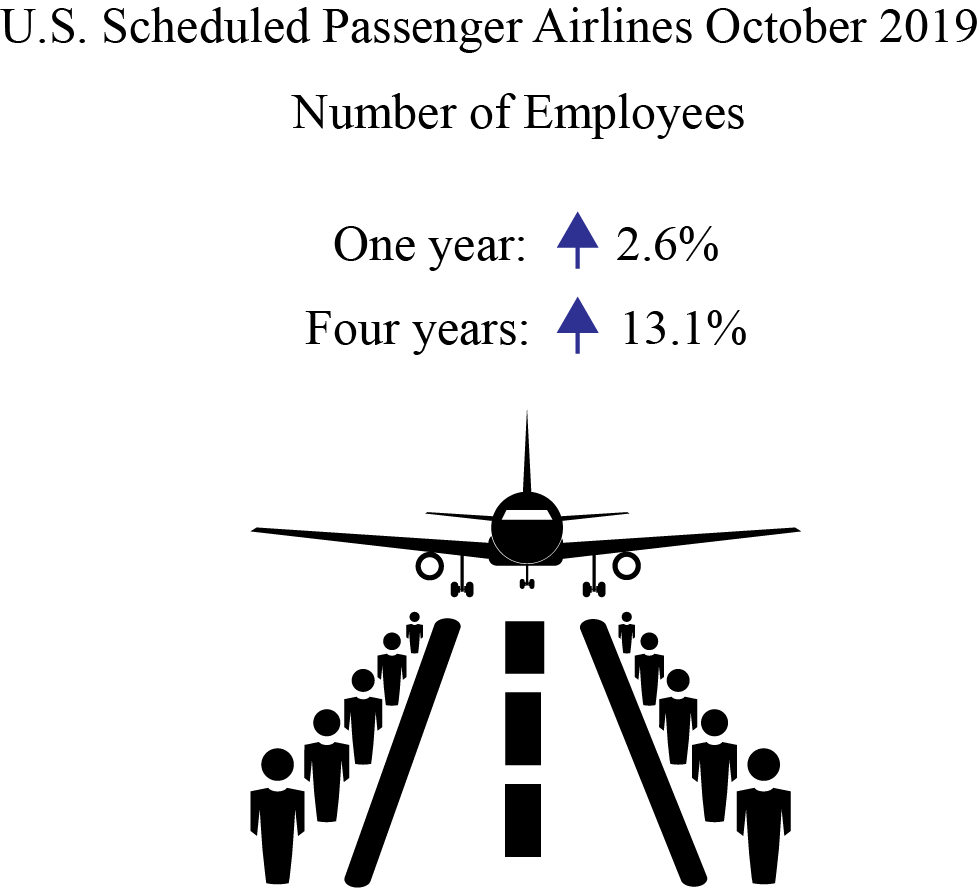
The 21 U.S. scheduled passenger airlines employed 2.6% more workers in October 2019 than in October 2018:
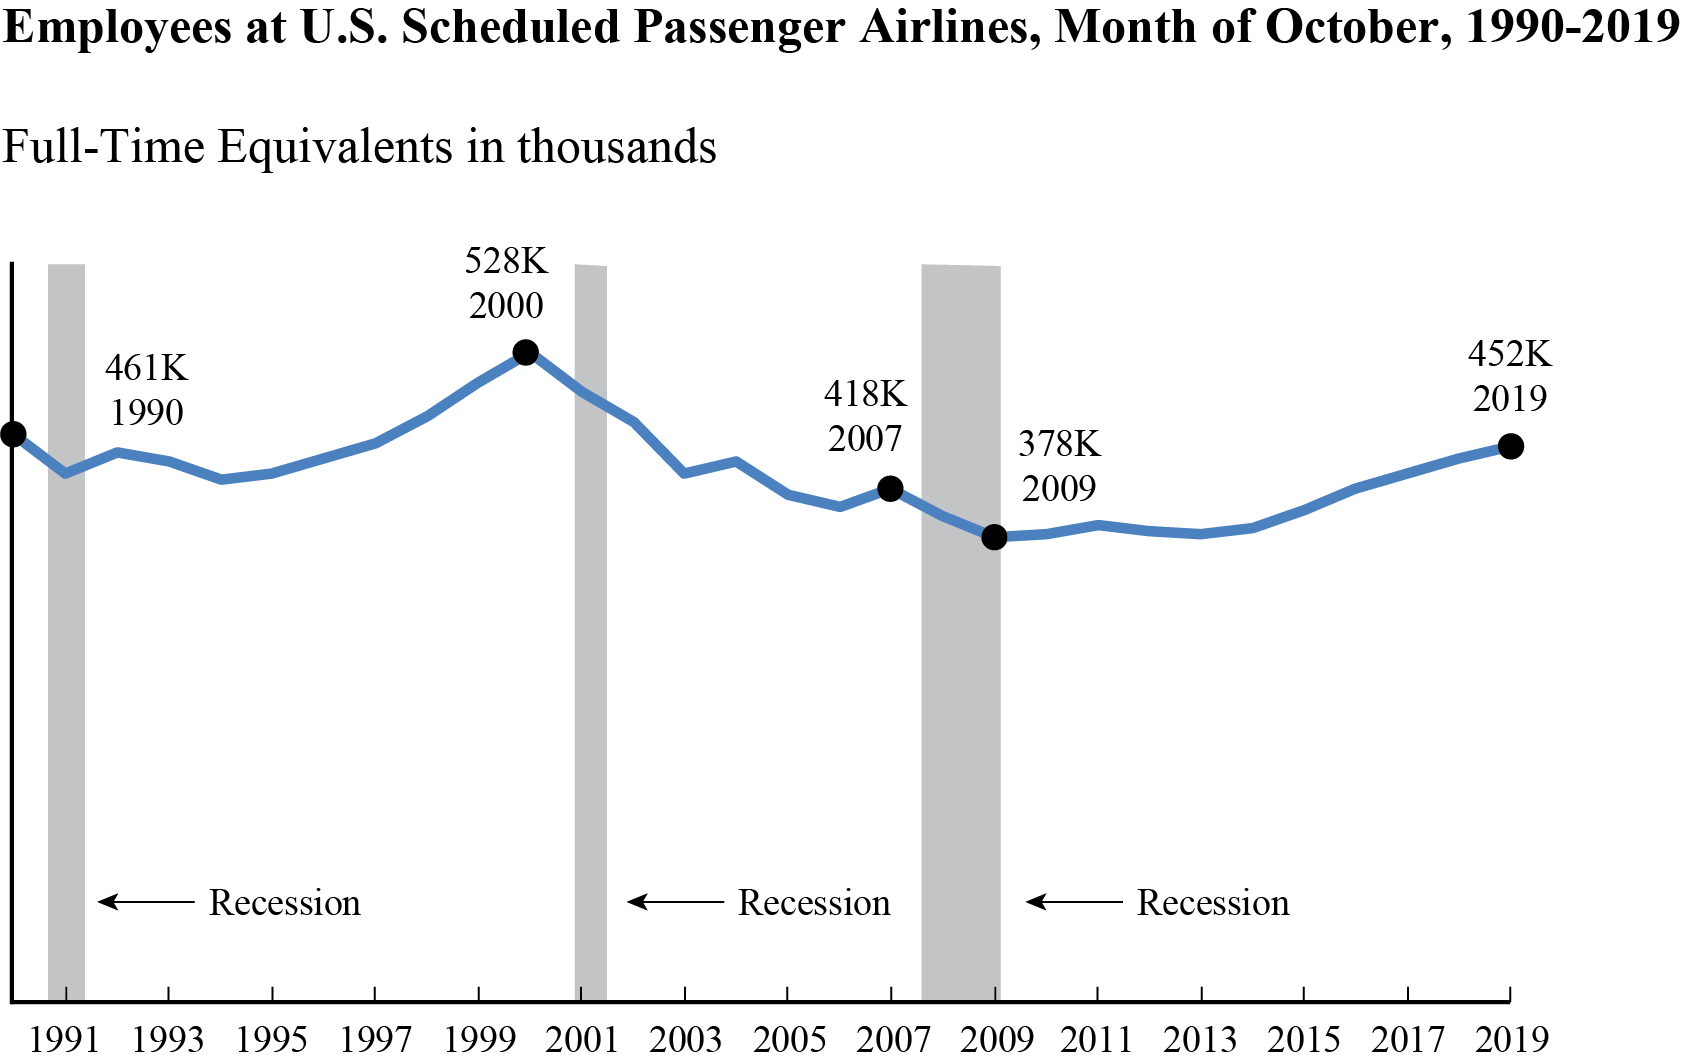
- October’s 452,440 full-time equivalents (FTEs) was the highest employment total since March 2003 (458,598 FTEs).
- October was the 72nd consecutive month that U.S. scheduled passenger airline FTEs exceeded the same month of the previous year.
U.S. airline employment reports are filed monthly with the Bureau of Transportation Statistics. See the tables that accompany this release on the BTS website for detailed data since 2015 (Tables 1-15) and industry summary data since 1990.
All 21 scheduled service passenger airlines
- 452,440 FTEs
- Up 2.6% (11,301 FTEs) over October 2018 (441,139 FTEs)
- Up 13.1% (52,512 FTEs) over October 2015 (399,928 FTEs)
Four network airlines
- 288,780 FTEs, 63.8% of total scheduled passenger airline FTEs
- Up 1.4% (4,015 FTEs) over October 2018 (284,765 FTEs)
- Up 8.7% (23,076 FTEs) over October 2015 (265,704 FTEs)
Network airlines operate a significant portion of their flights using at least one hub where connections are made for flights to down-line destinations or spoke cities. Note that beginning with January 2018 data, Virgin America’s numbers are included with Alaska Airlines in the network category.
Five low-cost airlines
- 97,282 FTEs, 21.5% of total scheduled passenger airline FTEs
- Up 4.7% (4,392 FTEs) over October 2018 (92,890 FTEs)
- Up 26.2% (20,219 FTEs) over October 2015 (77,063 FTEs)
Low-cost airlines operate under a low-cost business model, with infrastructure and aircraft operating costs below the overall industry average.
10 regional airlines
- 58,180 FTEs, 12.9% of total scheduled passenger airline FTEs
- Up 5.0% (2,754 FTEs) over October 2018 (55,426 FTEs)
- Up 15.2% (7,694 FTEs) over October 2015 (50,486 FTEs)
Regional carriers typically provide service from small cities, using primarily regional jets to support the network carriers’ hub and spoke systems.
Top Employers by Group
- Network: American 101,486 FTEs
- Low-Cost: Southwest 60,811 FTEs
- Regional: SkyWest 15,179 FTEs
Two other airlines
Other carriers generally operate within specific niche markets. They are: Hawaiian Airlines and Sun Country Airlines.
Reporting Notes
Airlines that operate at least one aircraft that has more than 60 seats or the capacity to carry a payload of passengers, cargo and fuel weighing more than 18,000 pounds must report monthly employment statistics.
Data are compiled from monthly reports filed with BTS by commercial air carriers as of Dec. 4. Additional airline employment data and previous releases can be found on the BTS website. BTS has scheduled release of November passenger airline employment data for Jan. 21.
|
You are subscribed to DOT email updates. Subscriber Services: Manage Preferences |
|
||||||||||||
