BTS 2-Week Outlook
Bureau of Transportation Statistics Upcoming Releases
October 15-25
Upcoming from October 15
Tuesday, October 15, 2019 - 11:00am ET
Airline On-Time/Tarmac Data, August 2019
Tuesday, October 15, 2019 - 2:00pm ET
Average Air Fares, 2nd Quarter 2019
Wednesday, October 16, 2019 - 11:00am ET
Passenger Airline Employment, August 2019
Wednesday, October 23, 2019 - 11:00am ET
North American Freight Data, August 2019
Friday, October 25, 2019 - 11:00am ET
National Transportation Atlas Database (NTAD), Fall 2019 Update
Previously Released
October 3 - Airline Fuel Cost and Consumption, August 2019
October 7- Airline Full-Time/Part-Time Employment, August 2019
October 9 - Transportation Services Index, August 2019
October 10 - Airline Traffic Data, September 2019 Estimated, July 2019 Reported
The Bureau of Transportation Statistics will release the following data sets in the next two weeks:
- Air Travel Consumer Report: August 2019 Numbers
Tuesday, October 15, 2019 - 11:00am ET
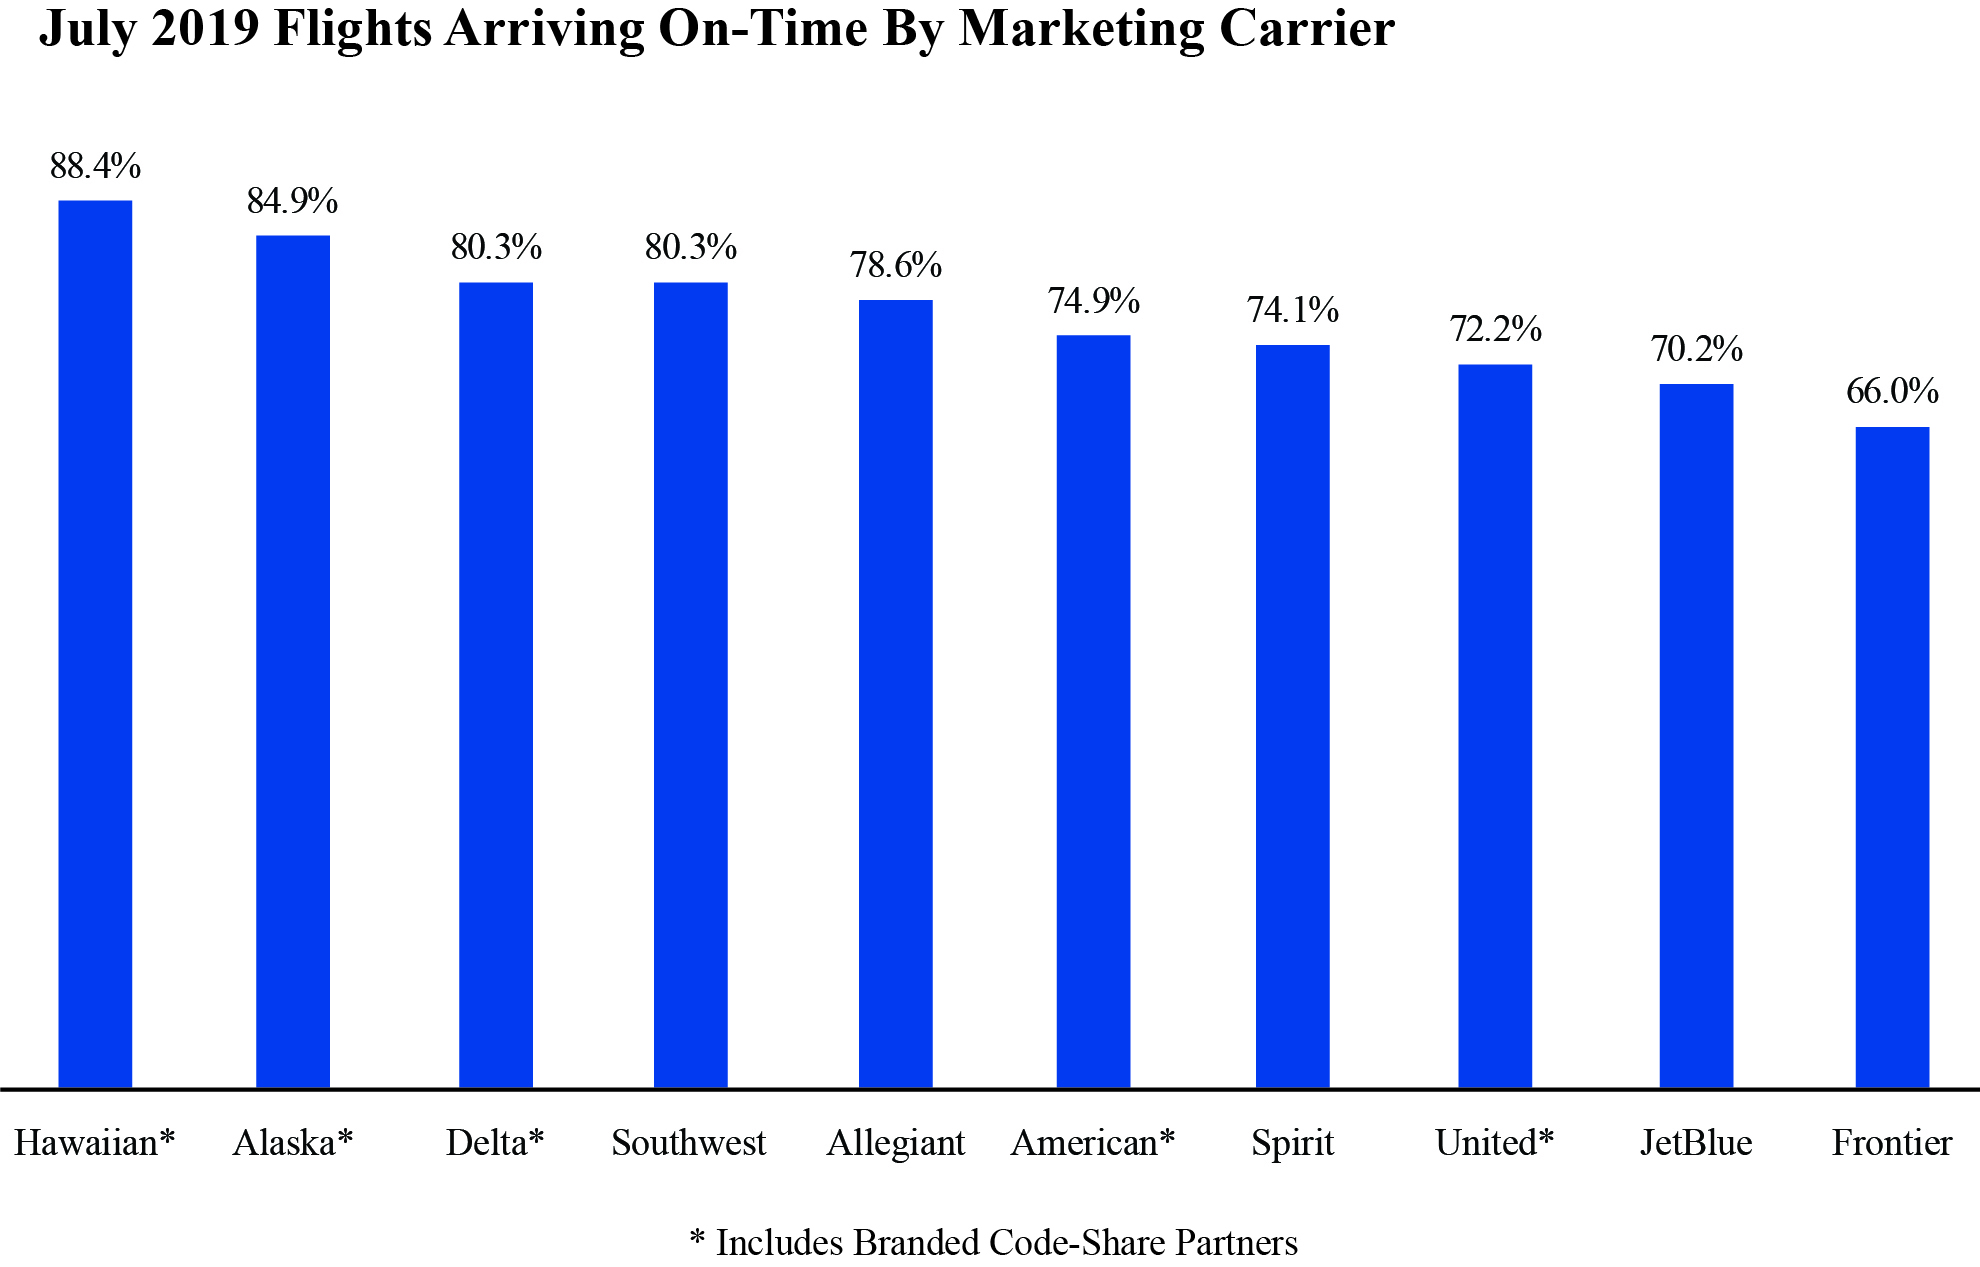
This release consists on U.S. airline domestic monthly on-time performance, cancellations, tarmac data, mishandled baggage and denied boardings released in coordination with the Department of Transportation’s release of the Air Travel Consumer Report. From the previous month’s release, in July 2019 reporting marketing carriers posted an on-time arrival rate of 76.9%, up from both the 73.3% on-time rate in June 2019 and from 76.0% in July 2018. Reporting marketing carriers canceled 2.1% of their scheduled domestic flights, equal to the rate of 2.1% in June 2019 but a higher rate than 1.8% in July 2018. The marketing carriers include branded code-share partners of mainline carriers.
-
Average Air Fares, 2nt Quarter 2019
Tuesday, October 15, 2019 - 2:00pm ET
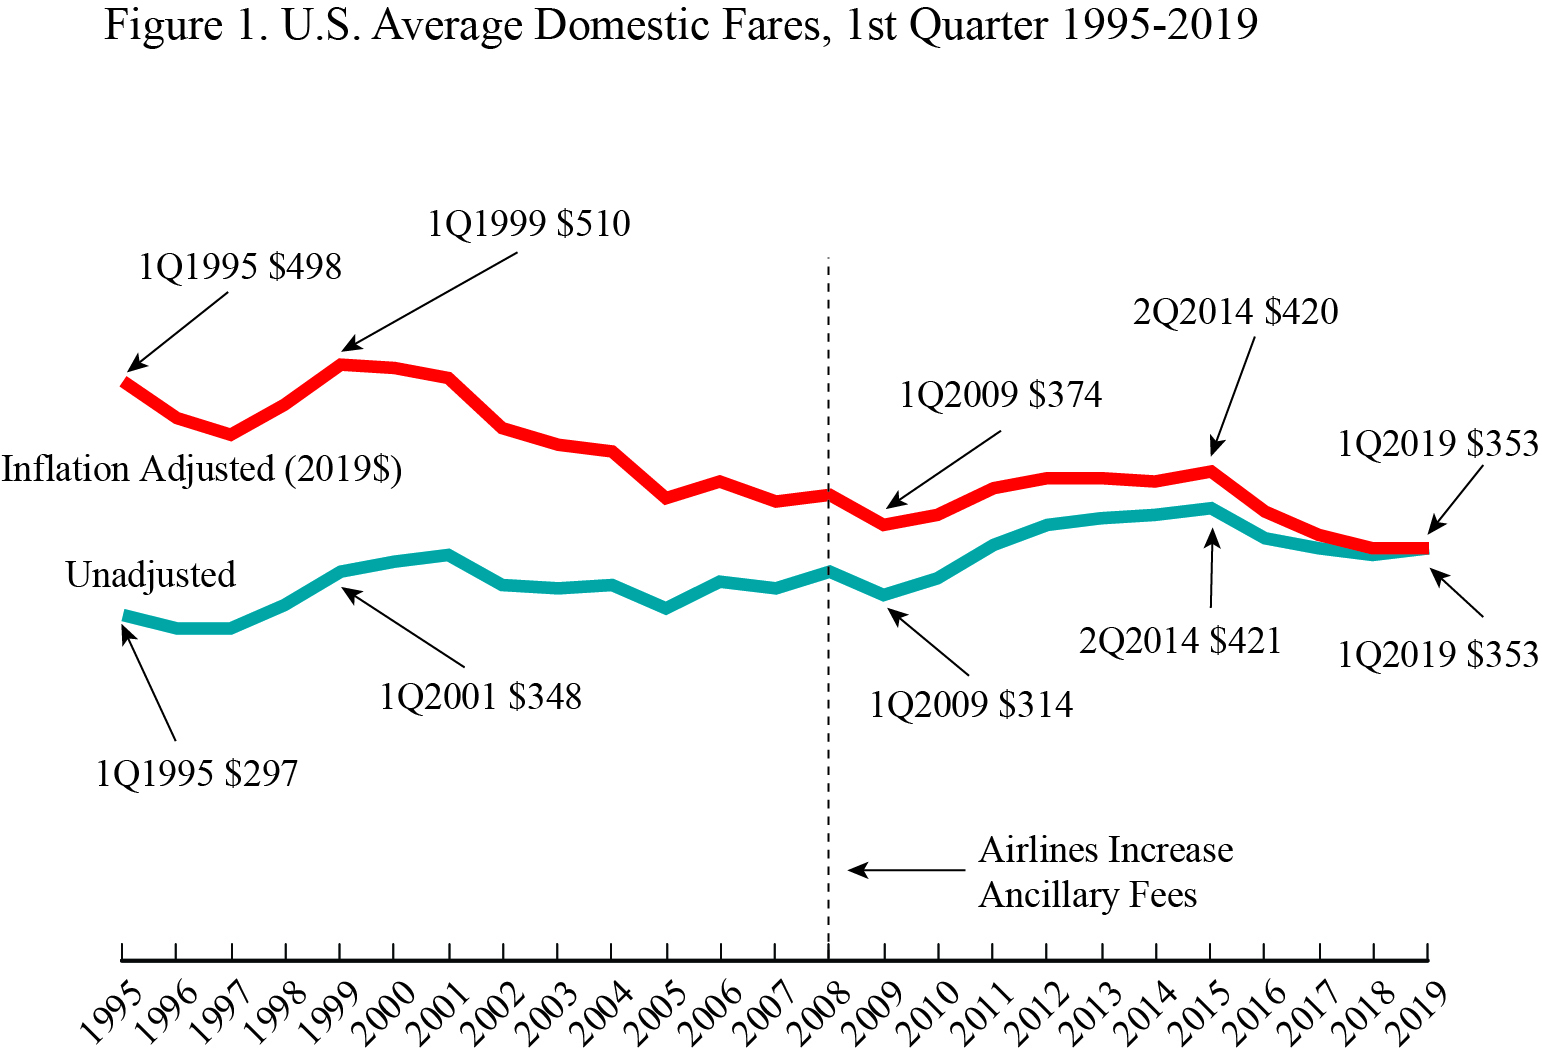
This release consists of average domestic itinerary fares, both inflation-adjusted and unadjusted, derived from the Origin & Destination Survey, a 10% ticket sample. In the previous release, BTS reported that the first-quarter 2019 average domestic itinerary air fare of $353 was down 2.0% from the fourth quarter of 2018 ($361) and up 0.3% from the first quarter of 2018 ($352).
-
Passenger Airline Employment, August 2019
Wednesday, October 16, 2019 - 11:00am ET
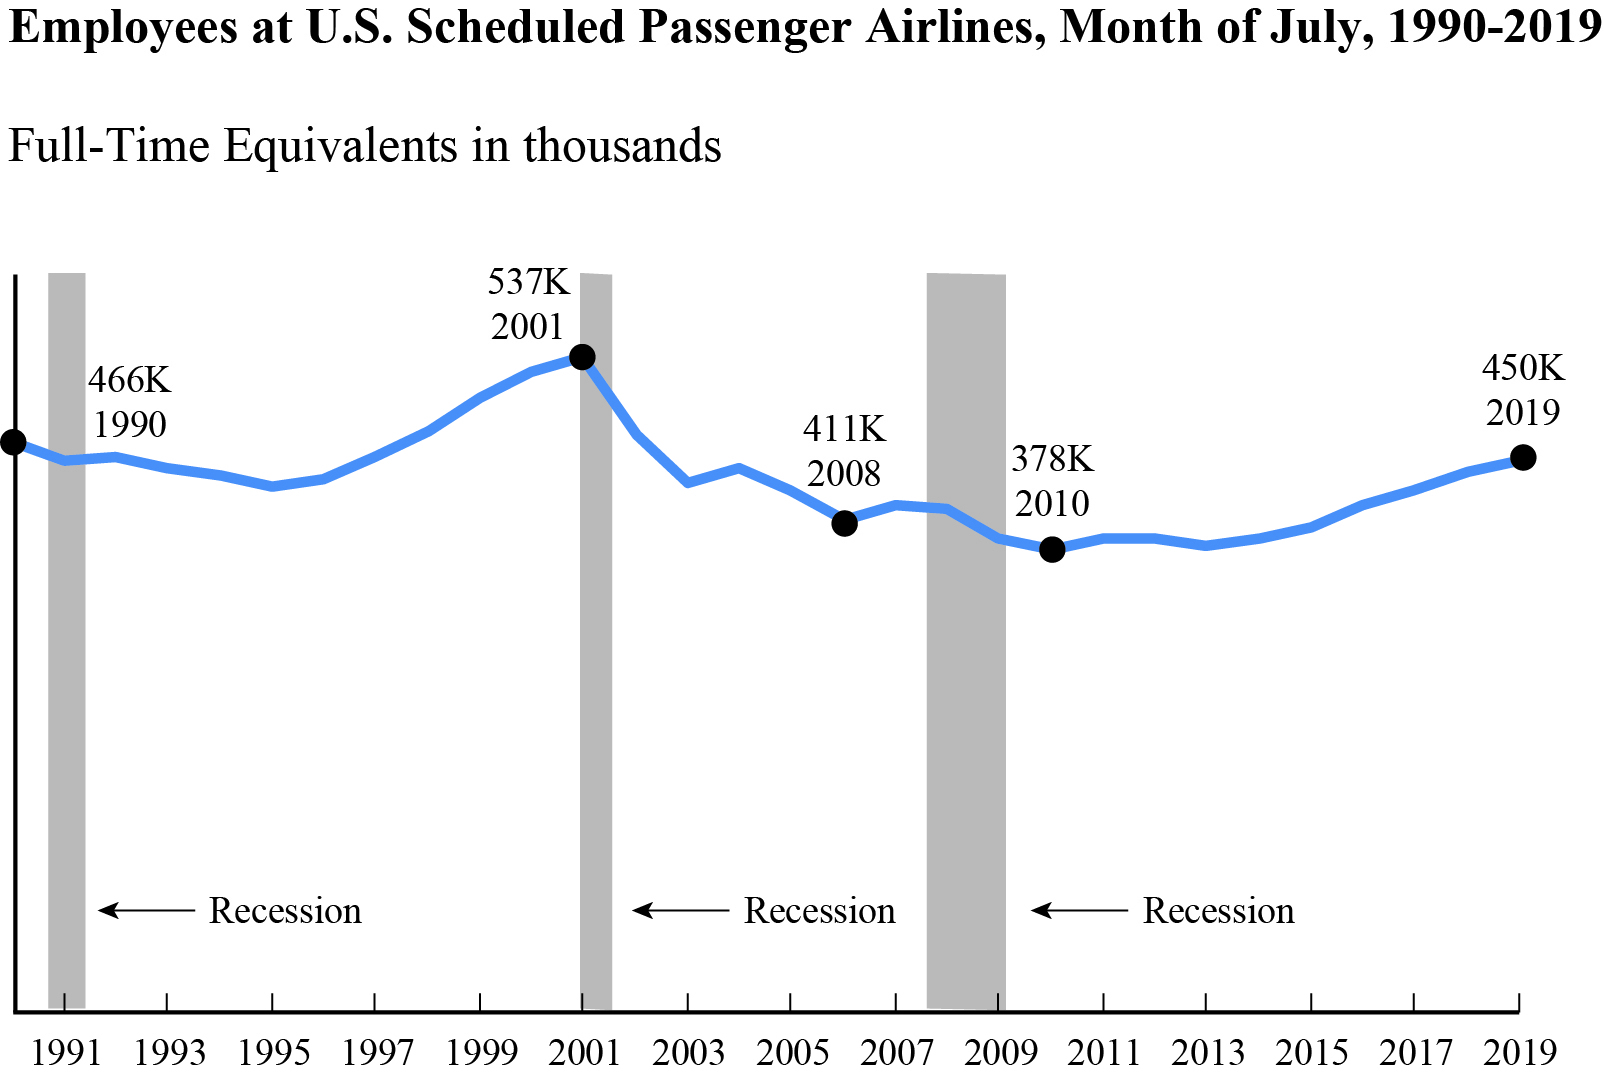
The release details full-time equivalent (FTE) employment numbers for U.S. scheduled service passenger airlines. Previously, BTS reported that U.S. scheduled passenger airlines employed 1.5% more workers in July 2019 than in July 2019. July’s 449,907 full-time equivalents (FTEs) was the highest employment total for any month since March 2003 (458,598 FTEs) and was the 69th consecutive month that U.S. scheduled passenger airline FTEs exceeded the same month of the previous year.
-
North American Transborder Freight Data, August 2019
Wednesday, October 23, 2019 - 11:00am ET
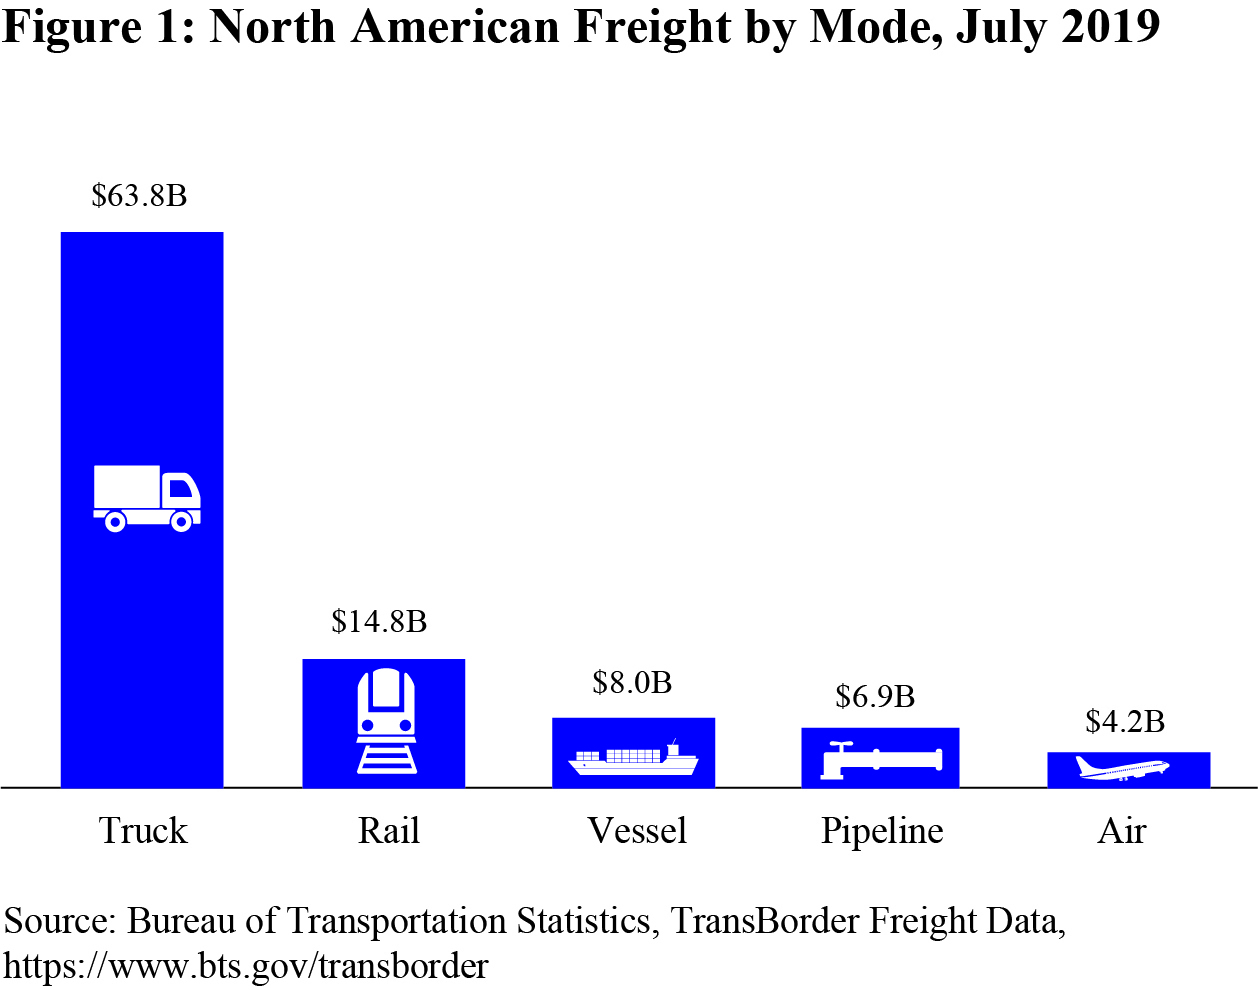
The release summarizes the value of freight transported in June by truck, rail and other modes between the U.S. and Canada and the U.S. and Mexico with the top states, ports and commodities. Previously, BTS reported that the value of total Transborder freight in July was $102.4 billion, up 1.2% compared to July 2018. Truck moved $64 billion or 62% and rail moved $15 billion or 15%.
-
National Transportation Atlas Database, Fall Update
Friday, October 25, 2019 - 11:00am ET
Previously, the
National Transportation Atlas Database (NTAD) summer update was released with one new dataset and 11 updated datasets. NTAD is a Bureau of Transportation Statistics (BTS) compilation of geospatial datasets representing the nation’s transportation infrastructure, containing roadways, railways, waterways, and airports. The new dataset in this version is roll-on/roll-off (ro-ro) port intermodal freight facilities. The
ro-ro facilities layer is the third in a series of datasets to be released as part of the Intermodal Freight Facility database.
BTS Previously
BTS has released the following:
-
Airline Fuel Cost and Consumption, August 2019
October 3
U.S. airlines August fuel cost was $1.94/gal, down four cents from July 2019 ($1.98) and down 26 cents from August 2018 ($2.20). Industry summary of airline fuel consumption, total fuel cost and price paid per gallon are available on the database. Individual airline numbers through March are available on the
BTS website.
-
Airline Full-Time/Part-Time Employment, August 2019
October 7
U.S. airlines industry August employment (742,431 total full-time and part-time) was down 0.2% from July 2019and up 3.2% from August 2018 (passenger+cargo). Monthly full-time and part-time employment statistics are reported by U.S. airlines that operate at least one aircraft that has more than 60 seats or the capacity to carry a payload of passengers, cargo and fuel weighing more than 18,000 pounds.
-
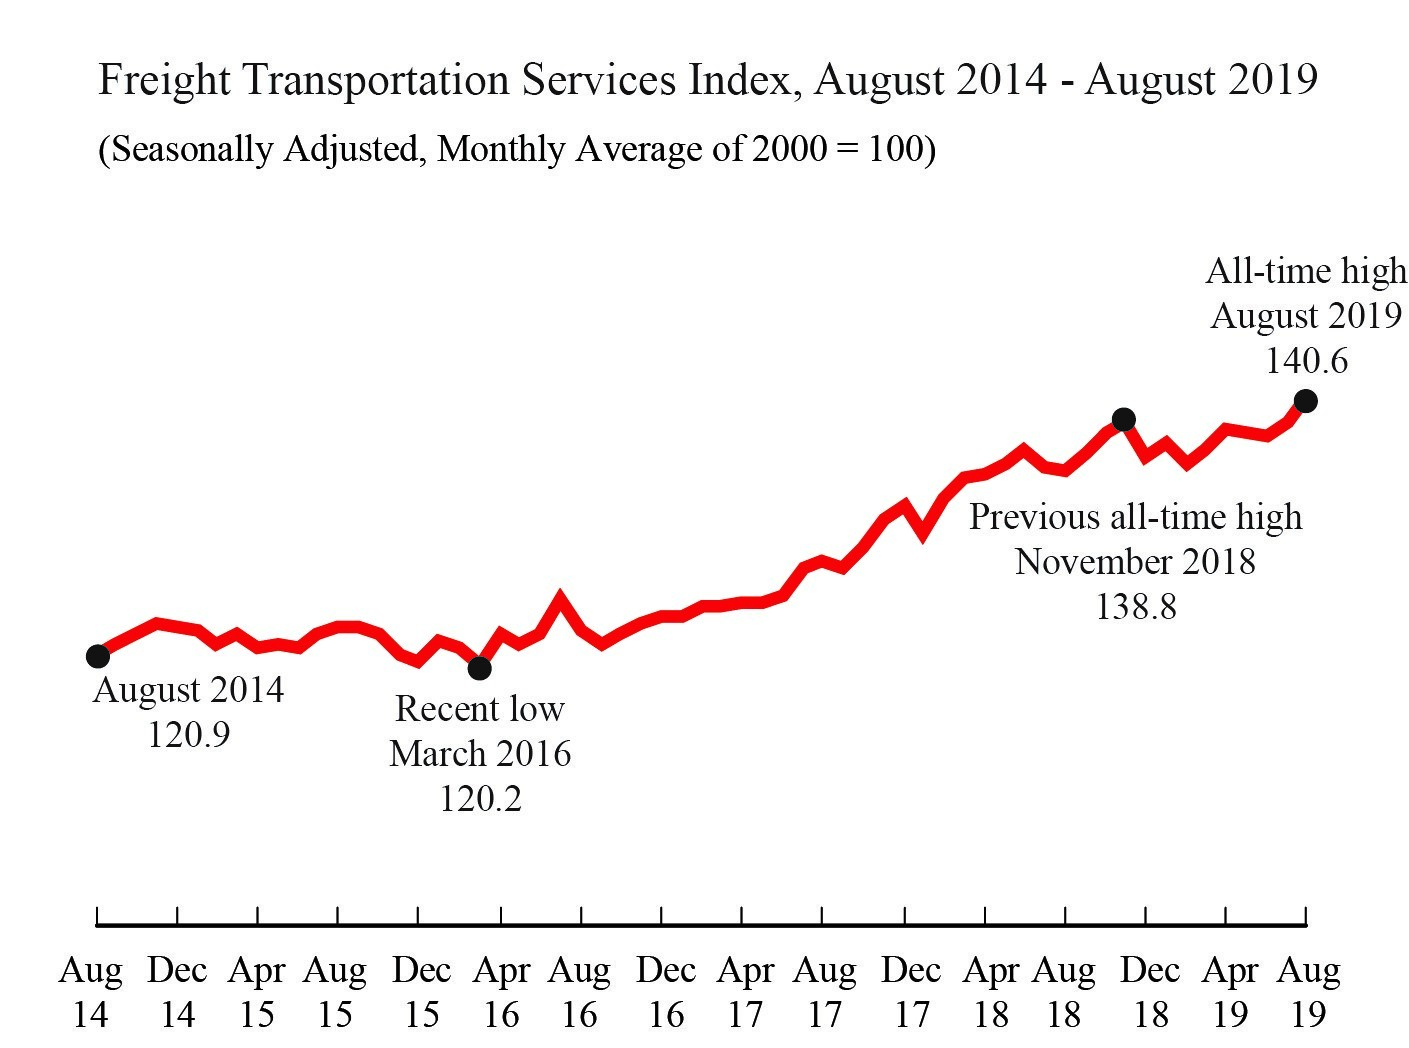
Freight Transportation Services Index (TSI), August 2019
October 9
The Freight Transportation Services Index (TSI), which is based on the amount of freight carried by the for-hire transportation industry, rose 1.4% in August from July, rising to a new all-time high with the second consecutive monthly increase. From August 2018 to August 2019, the index rose 4.1% compared to a rise of 5.5% from August 2017 to August 2018.
-
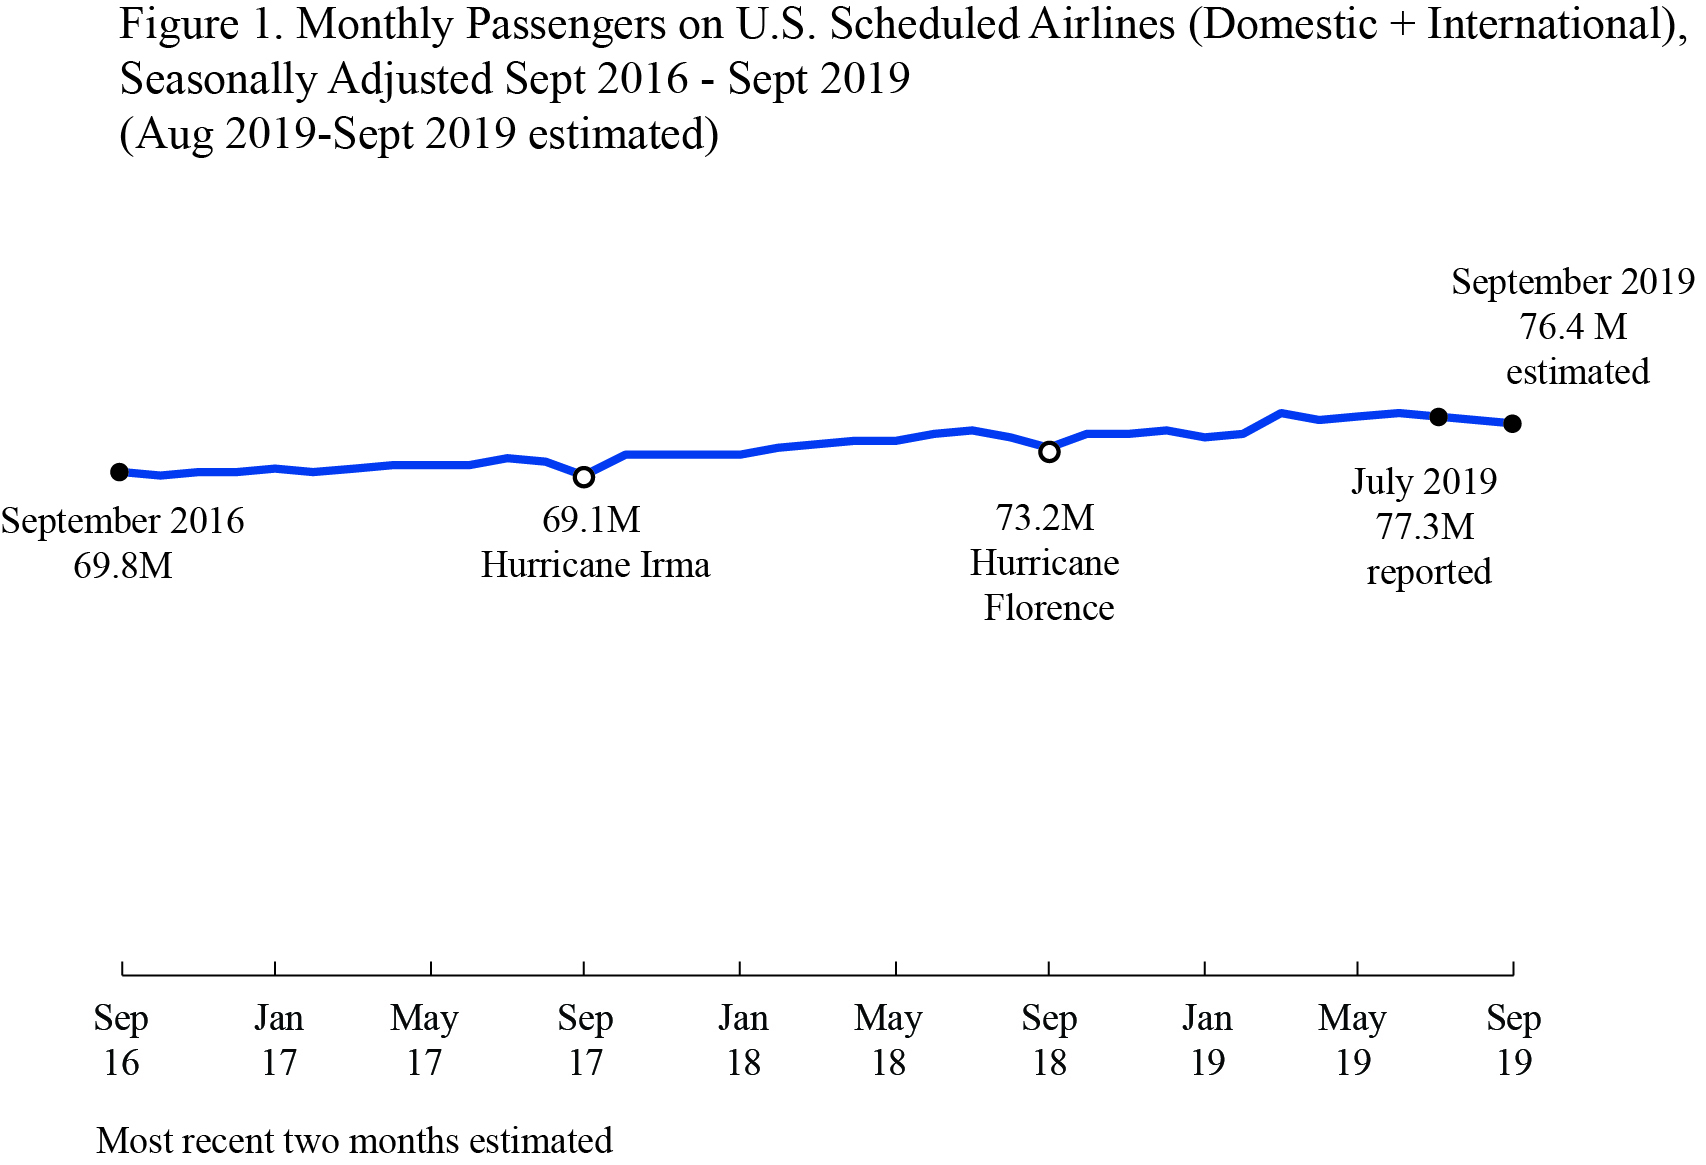
Airline Traffic Data, September 2019 estimate, July 2019 reported
October 10
U.S. airlines carried an all-time high estimated 76.4 million systemwide (domestic and international) scheduled service passengers in September 2019, seasonally-adjusted, according to the Bureau of Transportation Statistics’ (BTS) first estimate, down 0.7% from the August second estimate. The air traffic estimate released is a statistical estimate based on U.S. airlines reported data through July. In unadjusted reported data for July, systemwide, domestic and international enplanements all reached all-time monthly highs.
See BTS Release Schedule
BTS Contact: Dave Smallen
202-366-5568